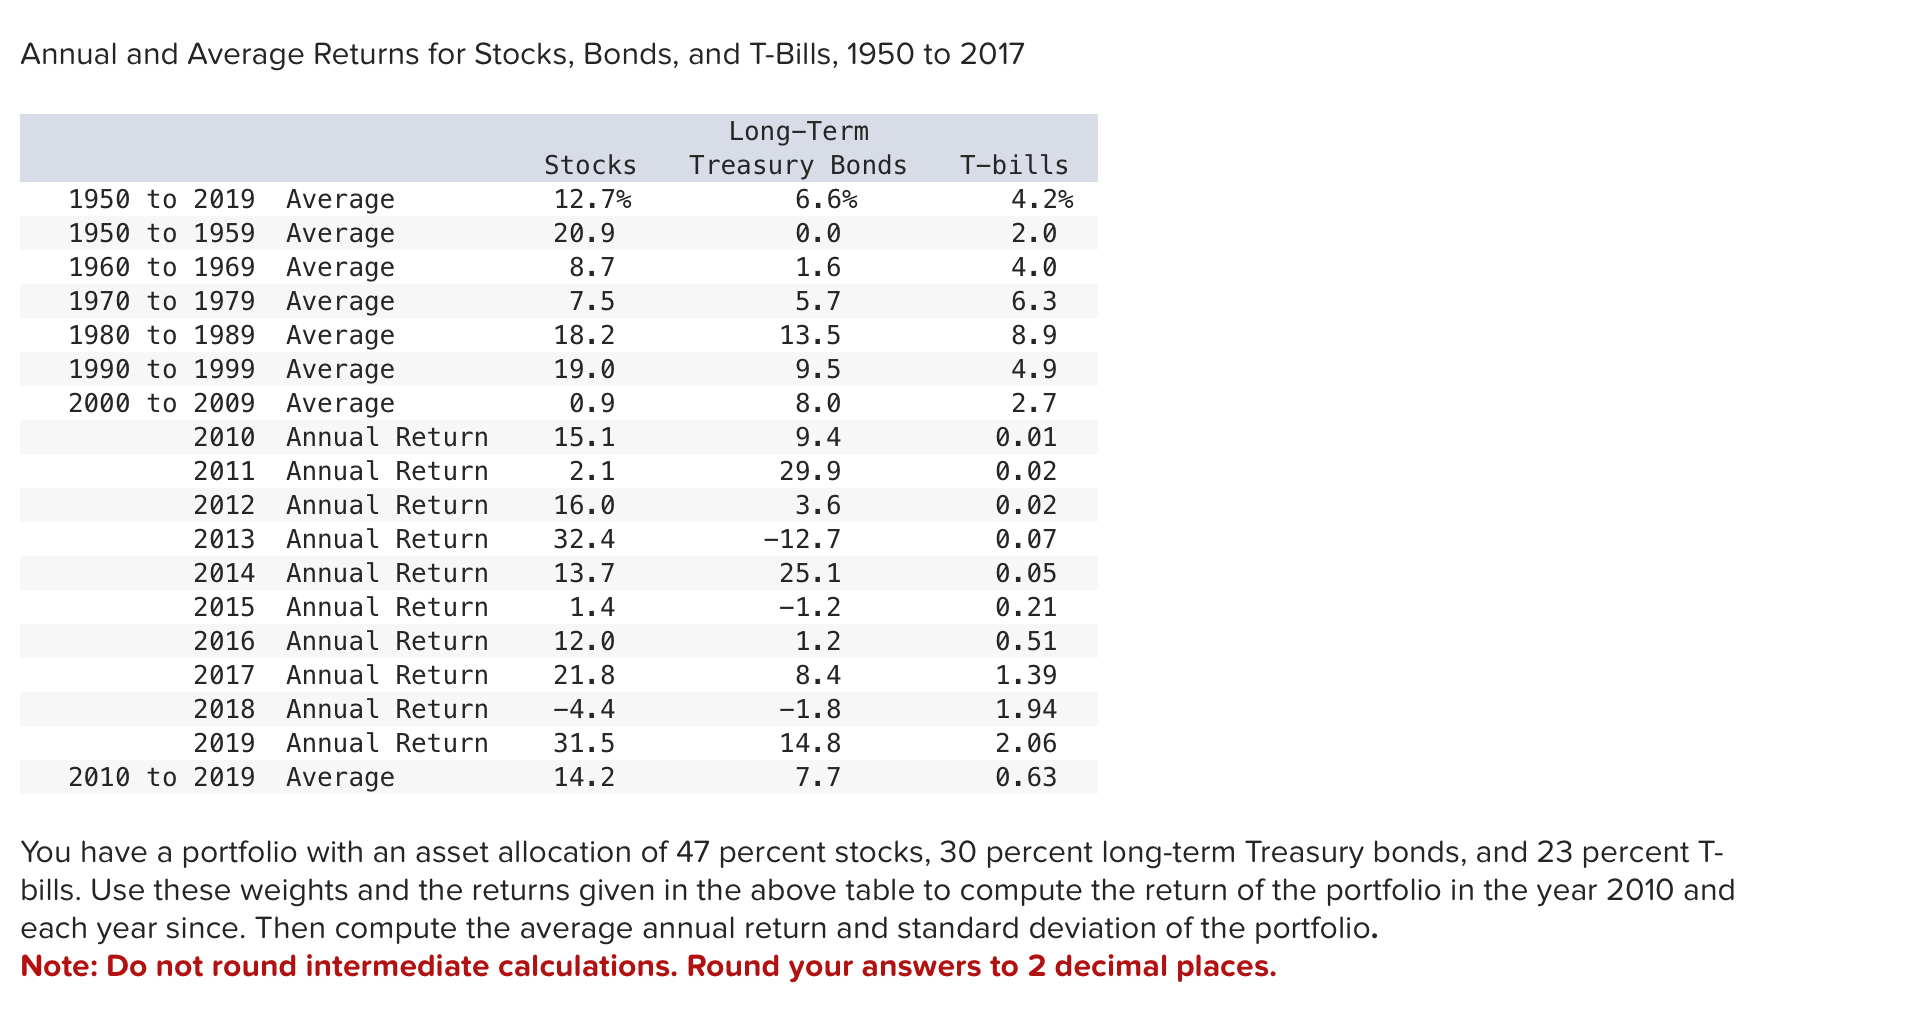
Annual and Average Returns for Stocks, Bonds, and T-Bills, 1950 to 2017 1950 to 2019 Average...
Fantastic news! We've Found the answer you've been seeking!
Question:
Transcribed Image Text:
Annual and Average Returns for Stocks, Bonds, and T-Bills, 1950 to 2017 1950 to 2019 Average 1950 to 1959 Average 1960 to 1969 Average 1970 to 1979 1980 to 1989 Average Average Average 1990 to 1999 2000 to 2009 Average 2010 Annual Return 2011 Annual Return 2012 Annual Return 2013 Annual Return 2014 Annual Return 2015 Annual Return 2016 Annual Return 2017 Annual Return 2018 Annual Return 2019 Annual Return 2010 to 2019 Average Long-Term Stocks Treasury Bonds 12.7% 20.9 8.7 7.5 18.2 19.0 0.9 15.1 2.1 16.0 32.4 13.7 1.4 12.0 21.8 -4.4 31.5 14.2 6.6% 0.0 1.6 5.7 13.5 9.5 8.0 9.4 29.9 3.6 -12.7 25.1 -1.2 1.2 8.4 -1.8 14.8 7.7 T-bills 4.2% 2.0 4.0 6.3 8.9 4.9 2.7 0.01 0.02 0.02 0.07 0.05 0.21 0.51 1.39 1.94 2.06 0.63 You have a portfolio with an asset allocation of 47 percent stocks, 30 percent long-term Treasury bonds, and 23 percent T- bills. Use these weights and the returns given in the above table to compute the return of the portfolio in the year 2010 and each year since. Then compute the average annual return and standard deviation of the portfolio. Note: Do not round intermediate calculations. Round your answers to 2 decimal places. 2010 2011 2012 2013 2014 2015 2016 2017 2018 2019 Average Standard deviation Portfolio Return % % % % % % % % % % % % Annual and Average Returns for Stocks, Bonds, and T-Bills, 1950 to 2017 1950 to 2019 Average 1950 to 1959 Average 1960 to 1969 Average 1970 to 1979 1980 to 1989 Average Average Average 1990 to 1999 2000 to 2009 Average 2010 Annual Return 2011 Annual Return 2012 Annual Return 2013 Annual Return 2014 Annual Return 2015 Annual Return 2016 Annual Return 2017 Annual Return 2018 Annual Return 2019 Annual Return 2010 to 2019 Average Long-Term Stocks Treasury Bonds 12.7% 20.9 8.7 7.5 18.2 19.0 0.9 15.1 2.1 16.0 32.4 13.7 1.4 12.0 21.8 -4.4 31.5 14.2 6.6% 0.0 1.6 5.7 13.5 9.5 8.0 9.4 29.9 3.6 -12.7 25.1 -1.2 1.2 8.4 -1.8 14.8 7.7 T-bills 4.2% 2.0 4.0 6.3 8.9 4.9 2.7 0.01 0.02 0.02 0.07 0.05 0.21 0.51 1.39 1.94 2.06 0.63 You have a portfolio with an asset allocation of 47 percent stocks, 30 percent long-term Treasury bonds, and 23 percent T- bills. Use these weights and the returns given in the above table to compute the return of the portfolio in the year 2010 and each year since. Then compute the average annual return and standard deviation of the portfolio. Note: Do not round intermediate calculations. Round your answers to 2 decimal places. 2010 2011 2012 2013 2014 2015 2016 2017 2018 2019 Average Standard deviation Portfolio Return % % % % % % % % % % % %
Expert Answer:
Answer rating: 100% (QA)
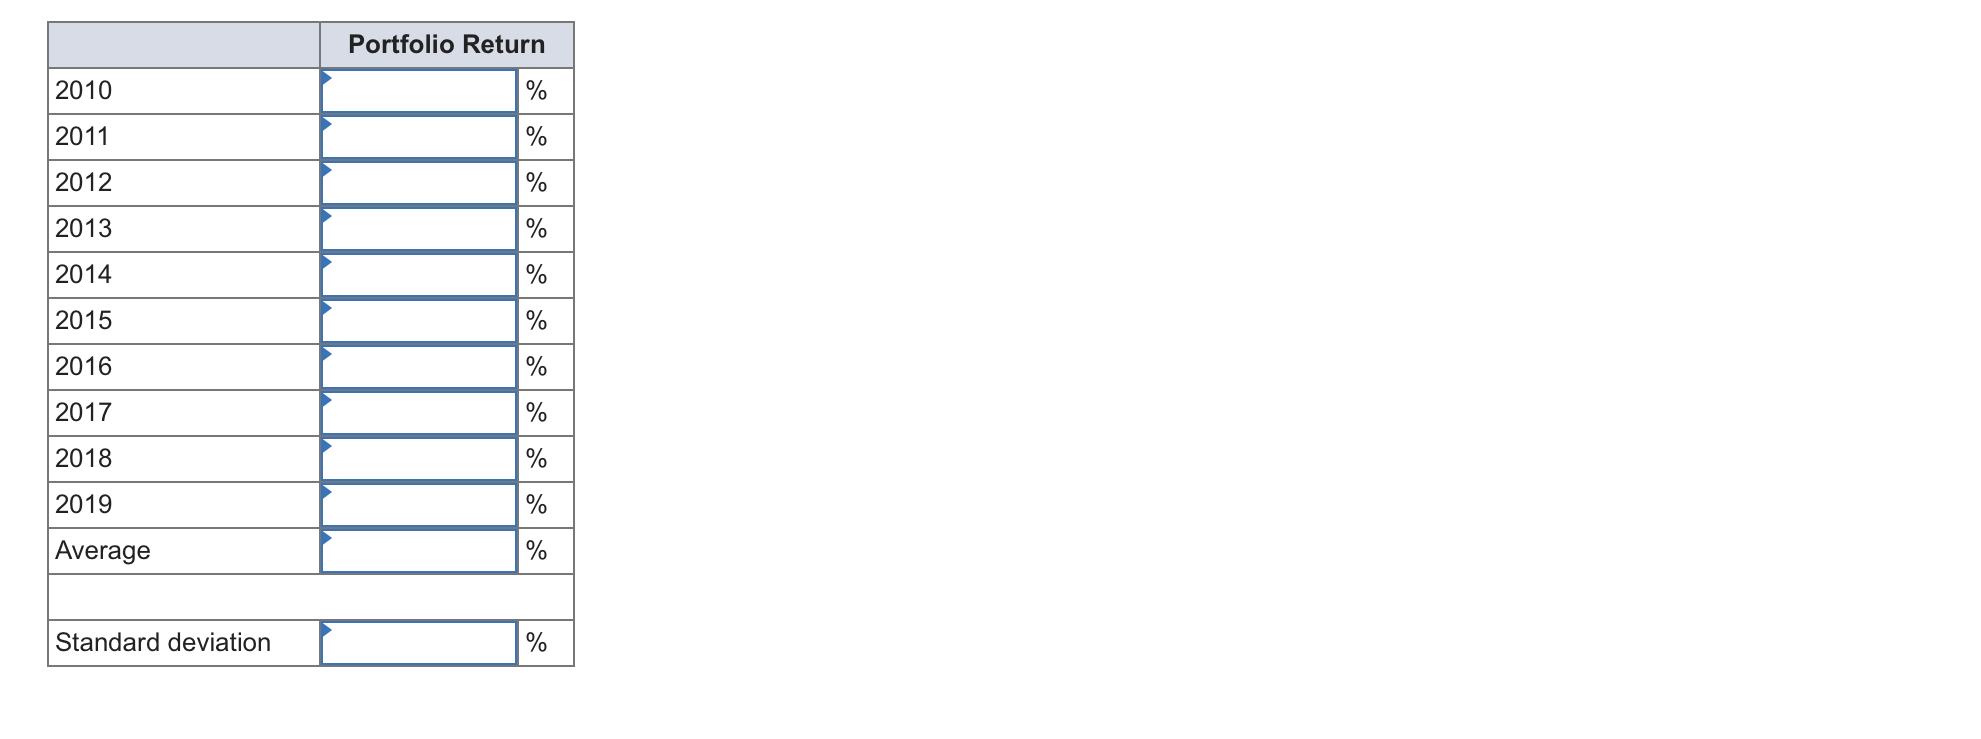
SOLUTION To compute the return of the portfolio in each year and calculate the average annual return ... View the full answer
Related Book For
Finance Applications and Theory
ISBN: 978-0077861681
3rd edition
Authors: Marcia Cornett, Troy Adair
Posted Date:
Students also viewed these finance questions
-
Suppose the following information is related to legal merger: The combinor issued 10000 common shares with $10 par value and $20 FMV to acquire all the voting common stocks of combinee. The business...
-
The following additional information is available for the Dr. Ivan and Irene Incisor family from Chapters 1-5. Ivan's grandfather died and left a portfolio of municipal bonds. In 2012, they pay Ivan...
-
The following additional information is available for the Dr. Ivan and Irene Incisor family from Chapters 1-6. On December 12, Irene purchased the building where her store is located. She paid...
-
Write a program RecoverSignal that will read the binary file written by StoreSignal, as described in the previous exercise. Display the integer values that the data represents on the screen.
-
Calculate the inventory turnover, days' sales in inventory, receivables turnover, days' sales in receivables, and total asset turnover ratios for 2013 and 2014 for Tyler Toys. Should any of these...
-
The binary phase diagram for the silver (Ag) and germanium (Ge) system is shown in Figure 11-34. Figure 11-34 The silver-germanium phase diagram (for Problem 11-35). (a) Schematically draw the phase...
-
Internal control is a. the act of stealing a businesss assets. b. the preparation of fraudulent financial statements. C. the process that helps a business achieve its objectives, such as operating...
-
Waronek owned and operated a trucking rig, transporting goods for L.T.L. Perishables, Inc., of St. Paul, Minnesota. He accepted an offer to haul a trailer load of beef from Illini Beef Packers, Inc.,...
-
23. The JIT Corp uses the a raw and in process (RIP) inventory account. At the end of each month, all inventories are counted, their conversion components are estimated, and inventory account...
-
AnderSet Laboratories produces rough lenses that will ultimately be ground into precision lenses for use in laboratory equipment. The company has developed the following thickness measures, based on...
-
Let a, b 0 be constants. Determine the curvature function k(t) of the ellipse y(t) = (a cost, b sint). For which values of t is the curvature a minimum? a maximum?
-
Explain the ego personality and personality development through psychoanalytic-social personality theories and how it may affect a individual personality.?
-
Explain the distinction between a stock's price and its intrinsic value?
-
Calculate the following for each of the years listed A. Debt/ Equity ratio B. Debt/asset ratio C.Profit Margin (as a %) D. Gross Margin (as a %) E. Calculate the change in profit margin over each...
-
Calla Canoe Company has experienced rapid growth in its first few months of operations and has had a sig in customers renting canoes and purchasing T-shirts. Many of these customers are asking for...
-
the Jordan family has a health insurance policy with the following characteristics: a. Deductible: $1,000 b. Coinsurance Provision: 80%/20% c. Out of Pocket Maximum: $5,000 If total health expenses...
-
You work for a small investment management firm. You have been provided with the following historical information for three stocks and the market index. The information is shown in the table below....
-
Determine the resultant moment produced by the forces about point O. 0.25 m 0.125 m, 0 0.3 m- 60 F = 500 N F = 600 N
-
Use the following information to complete the following balance sheet. Sales are $8.8 million, capital intensity ratio is 2.10 times, debt ratio is 55 percent, and fixed asset turnover ratio is 1.2...
-
Everything else held constant, if a firm announces that it will halve the length of time between its ex-dividend date and its payment date, what should be the effect on the stock price?
-
In 2000, the S&P 500 Index earned -9.1 percent while the T-bill yield was 5.9 percent. Does this mean the market risk premium was negative? Explain.
-
For each scenario below, describe which of the five general conditions that undermine independence in appearance is most relevant. a. An auditor recommends its audit clients' services to other...
-
Client-acceptance decisions have become increasingly important. This is mainly due to the increased risk of litigation against audit firms in some countries as a result of being associated with...
-
What is strategic analysis? Discuss the types of knowledge that auditors strive to obtain from the analysis.
Study smarter with the SolutionInn App