

Apple Inc CONSOLIDATED STATEMENT OF OPERATIONS - Vertical Analysis (In millions, except number of shares which...
Fantastic news! We've Found the answer you've been seeking!
Question:
Transcribed Image Text:
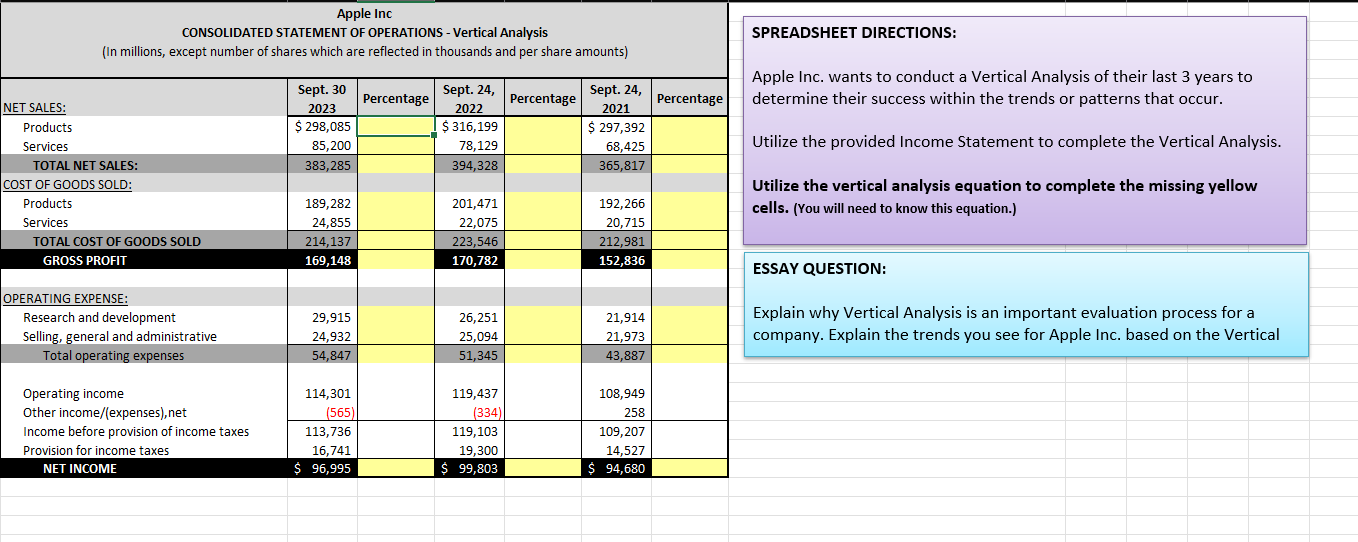
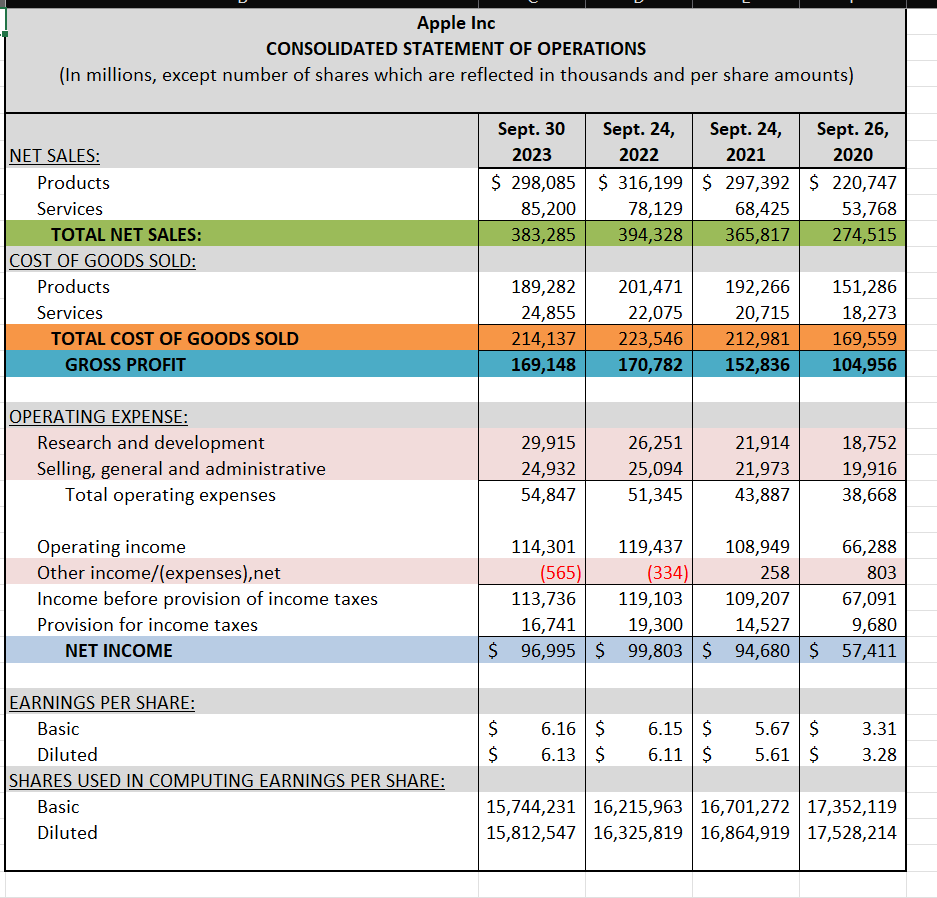
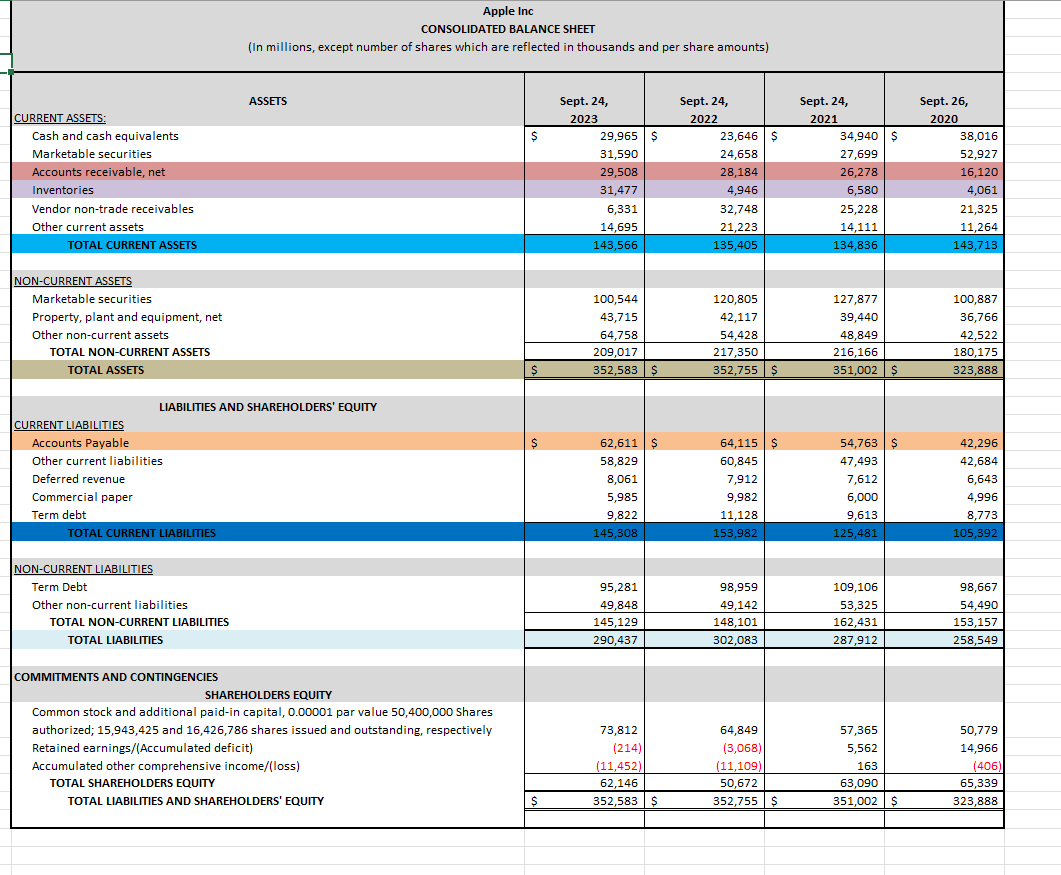
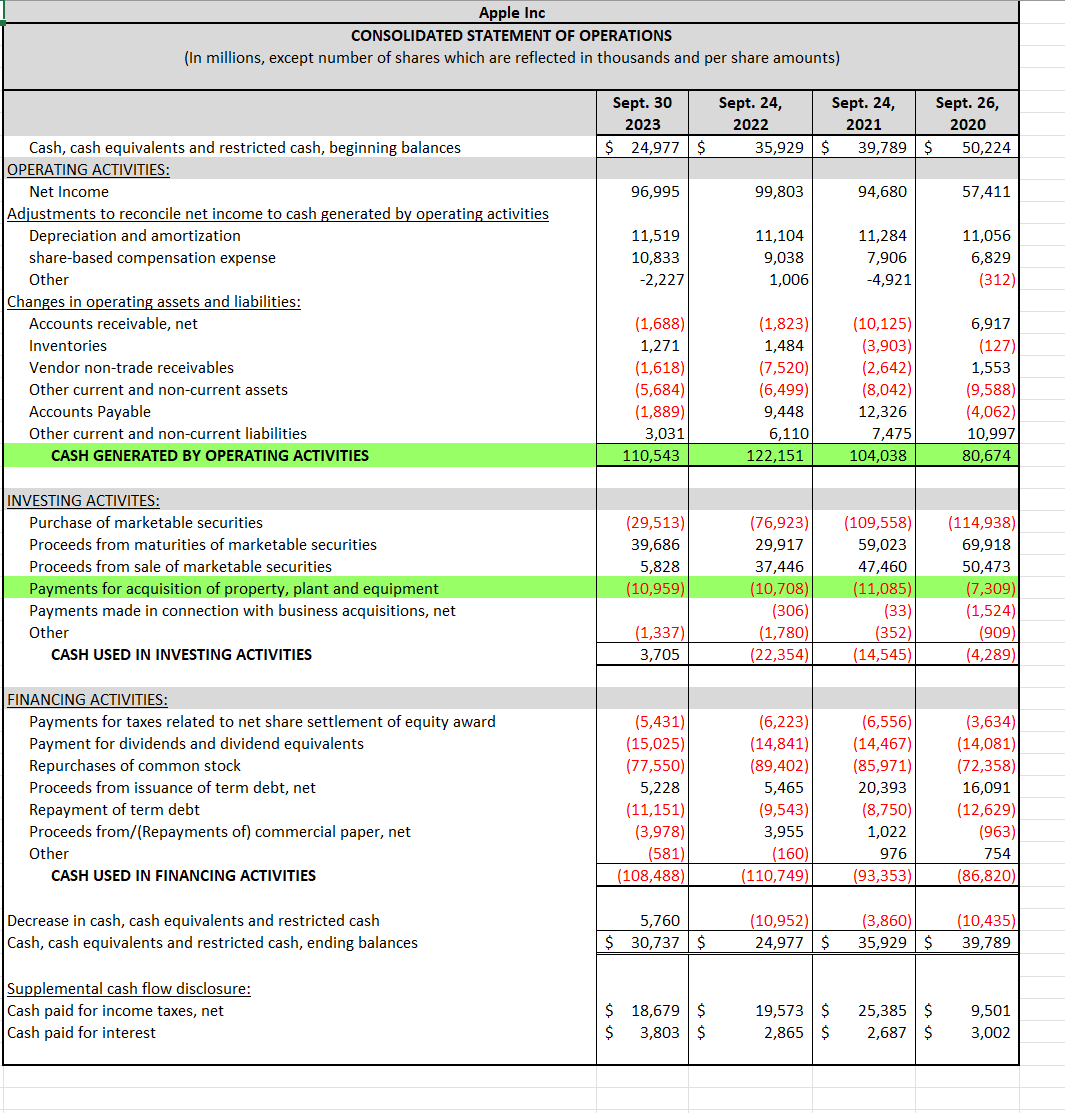
Apple Inc CONSOLIDATED STATEMENT OF OPERATIONS - Vertical Analysis (In millions, except number of shares which are reflected in thousands and per share amounts) NET SALES: Sept. 30 2023 Percentage Sept. 24, 2022 Percentage Products $ 298,085 $316,199 Services TOTAL NET SALES: 85,200 78,129 Sept. 24, 2021 $297,392 68,425 383,285 394,328 365,817 COST OF GOODS SOLD: Products 189,282 201,471 192,266 Services 24,855 22,075 20,715 TOTAL COST OF GOODS SOLD 214,137 223,546 212,981 GROSS PROFIT 169,148 170,782 152,836 OPERATING EXPENSE: Research and development 29,915 26,251 21,914 Selling, general and administrative 24,932 25,094 21,973 Total operating expenses 54,847 51,345 43,887 Operating income 114,301 119,437 108,949 Other income/(expenses), net (565) (334) Income before provision of income taxes 113,736 119,103 Provision for income taxes 16,741 19,300 258 109,207 14,527 NET INCOME $ 96,995 $ 99,803 $ 94,680 Percentage SPREADSHEET DIRECTIONS: Apple Inc. wants to conduct a Vertical Analysis of their last 3 years to determine their success within the trends or patterns that occur. Utilize the provided Income Statement to complete the Vertical Analysis. Utilize the vertical analysis equation to complete the missing yellow cells. (You will need to know this equation.) ESSAY QUESTION: Explain why Vertical Analysis is an important evaluation process for a company. Explain the trends you see for Apple Inc. based on the Vertical Apple Inc CONSOLIDATED STATEMENT OF OPERATIONS (In millions, except number of shares which are reflected in thousands and per share amounts) NET SALES: Sept. 30 2023 Sept. 24, 2022 Sept. 24, 2021 Sept. 26, 2020 Products Services TOTAL NET SALES: COST OF GOODS SOLD: $ 298,085 $ 316,199 $ 297,392 $ 220,747 85,200 78,129 68,425 383,285 394,328 365,817 53,768 274,515 Products 189,282 201,471 192,266 151,286 Services 24,855 22,075 20,715 18,273 TOTAL COST OF GOODS SOLD 214,137 223,546 212,981 169,559 GROSS PROFIT 169,148 170,782 152,836 104,956 OPERATING EXPENSE: Research and development 29,915 26,251 21,914 18,752 Selling, general and administrative 24,932 25,094 21,973 19,916 Total operating expenses 54,847 51,345 43,887 38,668 Operating income 114,301 119,437 108,949 66,288 Other income/(expenses), net Income before provision of income taxes Provision for income taxes NET INCOME EARNINGS PER SHARE: Basic Diluted SHARES USED IN COMPUTING EARNINGS PER SHARE: Basic Diluted $ 96,995 $ 99,803 $ 94,680 $ 57,411 $ 6.16 $ 6.15 $ $ 6.13 $ 6.11 $ 5.67 $ 5.61 $ 3.31 3.28 15,744,231 16,215,963 | 16,701,272 17,352,119 15,812,547 16,325,819 16,864,919 17,528,214 (565) (334) 258 803 113,736 119,103 109,207 67,091 16,741 19,300 14,527 9,680 Apple Inc CONSOLIDATED BALANCE SHEET (In millions, except number of shares which are reflected in thousands and per share amounts) ASSETS CURRENT ASSETS: Cash and cash equivalents Marketable securities Accounts receivable, net Inventories Vendor non-trade receivables Other current assets TOTAL CURRENT ASSETS NON-CURRENT ASSETS Marketable securities Property, plant and equipment, net Other non-current assets TOTAL NON-CURRENT ASSETS TOTAL ASSETS CURRENT LIABILITIES Accounts Payable Other current liabilities Deferred revenue Commercial paper LIABILITIES AND SHAREHOLDERS' EQUITY Term debt TOTAL CURRENT LIABILITIES NON-CURRENT LIABILITIES Term Debt Other non-current liabilities TOTAL NON-CURRENT LIABILITIES TOTAL LIABILITIES COMMITMENTS AND CONTINGENCIES SHAREHOLDERS EQUITY Common stock and additional paid-in capital, 0.00001 par value 50,400,000 Shares authorized; 15,943,425 and 16,426,786 shares issued and outstanding, respectively Retained earnings/(Accumulated deficit) Accumulated other comprehensive income/(loss) TOTAL SHAREHOLDERS EQUITY TOTAL LIABILITIES AND SHAREHOLDERS' EQUITY Sept. 24, 2023 Sept. 24, 2022 Sept. 24, 2021 Sept. 26, 2020 $ 29,965 $ 23,646 $ 34,940 $ 38,016 31,590 24,658 27,699 52,927 29,508 28,184 26,278 16,120 31,477 4,946 6,580 4,061 6,331 32,748 25,228 21,325 14,695 21,223 14,111 11,264 143,566 135,405 134,836 143,713 100,544 120,805 127,877 100,887 43,715 42,117 39,440 36,766 64,758 54,428 48,849 42,522 209,017 217,350 216,166 180,175 $ 352,583 $ 352,755 $ 351,002 $ 323,888 62,611 $ 64,115 $ 54,763 $ 42,296 58,829 60,845 47,493 42,684 8,061 7,912 7,612 6,643 5,985 9,982 6,000 4,996 9,822 11,128 9,613 8,773 145,308 153,982 125,481 105,392 95,281 98,959 109,106 98,667 49,848 49,142 53,325 54,490 145,129 148,101 162,431 153,157 290,437 302,083 287,912 258,549 73,812 64,849 57,365 50,779 (214) (3,068) 5,562 14,966 (11,452) (11,109) 163 (406) 62,146 50,672 63,090 65,339 $ 352,583 $ 352,755 $ 351,002 $ 323,888 Apple Inc CONSOLIDATED STATEMENT OF OPERATIONS (In millions, except number of shares which are reflected in thousands and per share amounts) Sept. 30 2023 Sept. 24, 2022 Sept. 24, 2021 Sept. 26, 2020 Cash, cash equivalents and restricted cash, beginning balances $ 24,977 $ 35,929 $ 39,789 $ 50,224 OPERATING ACTIVITIES: Net Income 96,995 99,803 94,680 57,411 Adjustments to reconcile net income to cash generated by operating activities Depreciation and amortization 11,519 11,104 11,284 11,056 share-based compensation expense 10,833 9,038 7,906 6,829 Other Changes in operating assets and liabilities: Accounts receivable, net Inventories Vendor non-trade receivables Other current and non-current assets -2,227 1,006 -4,921 (312) (1,688) (1,823) (10,125) 6,917 1,271 1,484 (3,903) (127) (1,618) (7,520) (2,642) 1,553 (5,684) (6,499) (8,042) (9,588) Accounts Payable (1,889) 9,448 12,326 (4,062) Other current and non-current liabilities 3,031 6,110 7,475 10,997 CASH GENERATED BY OPERATING ACTIVITIES 110,543 122,151 104,038 80,674 INVESTING ACTIVITES: Purchase of marketable securities (29,513) (76,923) (109,558) (114,938) Proceeds from maturities of marketable securities 39,686 29,917 59,023 69,918 Proceeds from sale of marketable securities 5,828 37,446 47,460 50,473 Payments for acquisition of property, plant and equipment (10,959) (10,708) (11,085) (7,309) Payments made in connection with business acquisitions, net (306) (33) (1,524) Other (1,337) (1,780) (352) (909) CASH USED IN INVESTING ACTIVITIES 3,705 (22,354) (14,545) (4,289) FINANCING ACTIVITIES: Payments for taxes related to net share settlement of equity award (5,431) (6,223) (6,556) (3,634) Payment for dividends and dividend equivalents (15,025) (14,841) (14,467) (14,081) Repurchases of common stock (77,550) (89,402) (85,971) (72,358) Proceeds from issuance of term debt, net 5,228 5,465 20,393 16,091 Repayment of term debt (11,151) (9,543) (8,750) (12,629) Proceeds from/(Repayments of) commercial paper, net Other CASH USED IN FINANCING ACTIVITIES (3,978) 3,955 1,022 (963) (581) (160) 976 754 (108,488) (110,749) (93,353) (86,820) Decrease in cash, cash equivalents and restricted cash 5,760 Cash, cash equivalents and restricted cash, ending balances $ 30,737 $ (10,952) 24,977 $ (3,860) (10,435) 35,929 $ 39,789 Supplemental cash flow disclosure: Cash paid for income taxes, net Cash paid for interest $ 18,679 $ 19,573 $ 25,385 $ 9,501 $ 3,803 $ 2,865 $ 2,687 $ 3,002 Final Financial Analysis - Apple Inc. 2021 to 2023 Apple Inc. designs, manufactures, and markets smartphones, personal computers, tablets, wearables, and accessories worldwide. It also provides AppleCare support and cloud services; and operates various platforms, including the App Store that allow customers to discover and download applications and digital content, such as books, music, video, games, and podcasts. Your final will analyze Apple Inc. and evaluate how they are doing financially in 2023. You will conduct a comparative analysis of Apple's financial statements from the years 2022 to 2023 looking at ratios to determine their profitability, liquidity, solvency, and efficiency in conducting business. You will complete a Horizontal and Vertical Analysis of the Income Statements from the years 2021, 2022, and 2023 to determine trends or changes by evaluating increases and decreases within the statement line items. You will aid Apple in determining the best investment opportunity by analyzing the Return on Investment and Payback Periods for the purchase of a new factory. And finally, you will help determine which factory will provide the best break-even option on the manufacturing and production of the new IPhone 14. Along with your overview of Apple Inc. you will present your knowledge of Business Forms, the four Financial Statements and their equations. You will prepare a Balance Sheet and an Income statement for Apple Inc. and you will provide your knowledge of the profitability, liquidity, solvency, and efficiency ratios. Apple Inc CONSOLIDATED STATEMENT OF OPERATIONS - Vertical Analysis (In millions, except number of shares which are reflected in thousands and per share amounts) NET SALES: Sept. 30 2023 Percentage Sept. 24, 2022 Percentage Products $ 298,085 $316,199 Services TOTAL NET SALES: 85,200 78,129 Sept. 24, 2021 $297,392 68,425 383,285 394,328 365,817 COST OF GOODS SOLD: Products 189,282 201,471 192,266 Services 24,855 22,075 20,715 TOTAL COST OF GOODS SOLD 214,137 223,546 212,981 GROSS PROFIT 169,148 170,782 152,836 OPERATING EXPENSE: Research and development 29,915 26,251 21,914 Selling, general and administrative 24,932 25,094 21,973 Total operating expenses 54,847 51,345 43,887 Operating income 114,301 119,437 108,949 Other income/(expenses), net (565) (334) Income before provision of income taxes 113,736 119,103 Provision for income taxes 16,741 19,300 258 109,207 14,527 NET INCOME $ 96,995 $ 99,803 $ 94,680 Percentage SPREADSHEET DIRECTIONS: Apple Inc. wants to conduct a Vertical Analysis of their last 3 years to determine their success within the trends or patterns that occur. Utilize the provided Income Statement to complete the Vertical Analysis. Utilize the vertical analysis equation to complete the missing yellow cells. (You will need to know this equation.) ESSAY QUESTION: Explain why Vertical Analysis is an important evaluation process for a company. Explain the trends you see for Apple Inc. based on the Vertical Apple Inc CONSOLIDATED STATEMENT OF OPERATIONS (In millions, except number of shares which are reflected in thousands and per share amounts) NET SALES: Sept. 30 2023 Sept. 24, 2022 Sept. 24, 2021 Sept. 26, 2020 Products Services TOTAL NET SALES: COST OF GOODS SOLD: $ 298,085 $ 316,199 $ 297,392 $ 220,747 85,200 78,129 68,425 383,285 394,328 365,817 53,768 274,515 Products 189,282 201,471 192,266 151,286 Services 24,855 22,075 20,715 18,273 TOTAL COST OF GOODS SOLD 214,137 223,546 212,981 169,559 GROSS PROFIT 169,148 170,782 152,836 104,956 OPERATING EXPENSE: Research and development 29,915 26,251 21,914 18,752 Selling, general and administrative 24,932 25,094 21,973 19,916 Total operating expenses 54,847 51,345 43,887 38,668 Operating income 114,301 119,437 108,949 66,288 Other income/(expenses), net Income before provision of income taxes Provision for income taxes NET INCOME EARNINGS PER SHARE: Basic Diluted SHARES USED IN COMPUTING EARNINGS PER SHARE: Basic Diluted $ 96,995 $ 99,803 $ 94,680 $ 57,411 $ 6.16 $ 6.15 $ $ 6.13 $ 6.11 $ 5.67 $ 5.61 $ 3.31 3.28 15,744,231 16,215,963 | 16,701,272 17,352,119 15,812,547 16,325,819 16,864,919 17,528,214 (565) (334) 258 803 113,736 119,103 109,207 67,091 16,741 19,300 14,527 9,680 Apple Inc CONSOLIDATED BALANCE SHEET (In millions, except number of shares which are reflected in thousands and per share amounts) ASSETS CURRENT ASSETS: Cash and cash equivalents Marketable securities Accounts receivable, net Inventories Vendor non-trade receivables Other current assets TOTAL CURRENT ASSETS NON-CURRENT ASSETS Marketable securities Property, plant and equipment, net Other non-current assets TOTAL NON-CURRENT ASSETS TOTAL ASSETS CURRENT LIABILITIES Accounts Payable Other current liabilities Deferred revenue Commercial paper LIABILITIES AND SHAREHOLDERS' EQUITY Term debt TOTAL CURRENT LIABILITIES NON-CURRENT LIABILITIES Term Debt Other non-current liabilities TOTAL NON-CURRENT LIABILITIES TOTAL LIABILITIES COMMITMENTS AND CONTINGENCIES SHAREHOLDERS EQUITY Common stock and additional paid-in capital, 0.00001 par value 50,400,000 Shares authorized; 15,943,425 and 16,426,786 shares issued and outstanding, respectively Retained earnings/(Accumulated deficit) Accumulated other comprehensive income/(loss) TOTAL SHAREHOLDERS EQUITY TOTAL LIABILITIES AND SHAREHOLDERS' EQUITY Sept. 24, 2023 Sept. 24, 2022 Sept. 24, 2021 Sept. 26, 2020 $ 29,965 $ 23,646 $ 34,940 $ 38,016 31,590 24,658 27,699 52,927 29,508 28,184 26,278 16,120 31,477 4,946 6,580 4,061 6,331 32,748 25,228 21,325 14,695 21,223 14,111 11,264 143,566 135,405 134,836 143,713 100,544 120,805 127,877 100,887 43,715 42,117 39,440 36,766 64,758 54,428 48,849 42,522 209,017 217,350 216,166 180,175 $ 352,583 $ 352,755 $ 351,002 $ 323,888 62,611 $ 64,115 $ 54,763 $ 42,296 58,829 60,845 47,493 42,684 8,061 7,912 7,612 6,643 5,985 9,982 6,000 4,996 9,822 11,128 9,613 8,773 145,308 153,982 125,481 105,392 95,281 98,959 109,106 98,667 49,848 49,142 53,325 54,490 145,129 148,101 162,431 153,157 290,437 302,083 287,912 258,549 73,812 64,849 57,365 50,779 (214) (3,068) 5,562 14,966 (11,452) (11,109) 163 (406) 62,146 50,672 63,090 65,339 $ 352,583 $ 352,755 $ 351,002 $ 323,888 Apple Inc CONSOLIDATED STATEMENT OF OPERATIONS (In millions, except number of shares which are reflected in thousands and per share amounts) Sept. 30 2023 Sept. 24, 2022 Sept. 24, 2021 Sept. 26, 2020 Cash, cash equivalents and restricted cash, beginning balances $ 24,977 $ 35,929 $ 39,789 $ 50,224 OPERATING ACTIVITIES: Net Income 96,995 99,803 94,680 57,411 Adjustments to reconcile net income to cash generated by operating activities Depreciation and amortization 11,519 11,104 11,284 11,056 share-based compensation expense 10,833 9,038 7,906 6,829 Other Changes in operating assets and liabilities: Accounts receivable, net Inventories Vendor non-trade receivables Other current and non-current assets -2,227 1,006 -4,921 (312) (1,688) (1,823) (10,125) 6,917 1,271 1,484 (3,903) (127) (1,618) (7,520) (2,642) 1,553 (5,684) (6,499) (8,042) (9,588) Accounts Payable (1,889) 9,448 12,326 (4,062) Other current and non-current liabilities 3,031 6,110 7,475 10,997 CASH GENERATED BY OPERATING ACTIVITIES 110,543 122,151 104,038 80,674 INVESTING ACTIVITES: Purchase of marketable securities (29,513) (76,923) (109,558) (114,938) Proceeds from maturities of marketable securities 39,686 29,917 59,023 69,918 Proceeds from sale of marketable securities 5,828 37,446 47,460 50,473 Payments for acquisition of property, plant and equipment (10,959) (10,708) (11,085) (7,309) Payments made in connection with business acquisitions, net (306) (33) (1,524) Other (1,337) (1,780) (352) (909) CASH USED IN INVESTING ACTIVITIES 3,705 (22,354) (14,545) (4,289) FINANCING ACTIVITIES: Payments for taxes related to net share settlement of equity award (5,431) (6,223) (6,556) (3,634) Payment for dividends and dividend equivalents (15,025) (14,841) (14,467) (14,081) Repurchases of common stock (77,550) (89,402) (85,971) (72,358) Proceeds from issuance of term debt, net 5,228 5,465 20,393 16,091 Repayment of term debt (11,151) (9,543) (8,750) (12,629) Proceeds from/(Repayments of) commercial paper, net Other CASH USED IN FINANCING ACTIVITIES (3,978) 3,955 1,022 (963) (581) (160) 976 754 (108,488) (110,749) (93,353) (86,820) Decrease in cash, cash equivalents and restricted cash 5,760 Cash, cash equivalents and restricted cash, ending balances $ 30,737 $ (10,952) 24,977 $ (3,860) (10,435) 35,929 $ 39,789 Supplemental cash flow disclosure: Cash paid for income taxes, net Cash paid for interest $ 18,679 $ 19,573 $ 25,385 $ 9,501 $ 3,803 $ 2,865 $ 2,687 $ 3,002 Final Financial Analysis - Apple Inc. 2021 to 2023 Apple Inc. designs, manufactures, and markets smartphones, personal computers, tablets, wearables, and accessories worldwide. It also provides AppleCare support and cloud services; and operates various platforms, including the App Store that allow customers to discover and download applications and digital content, such as books, music, video, games, and podcasts. Your final will analyze Apple Inc. and evaluate how they are doing financially in 2023. You will conduct a comparative analysis of Apple's financial statements from the years 2022 to 2023 looking at ratios to determine their profitability, liquidity, solvency, and efficiency in conducting business. You will complete a Horizontal and Vertical Analysis of the Income Statements from the years 2021, 2022, and 2023 to determine trends or changes by evaluating increases and decreases within the statement line items. You will aid Apple in determining the best investment opportunity by analyzing the Return on Investment and Payback Periods for the purchase of a new factory. And finally, you will help determine which factory will provide the best break-even option on the manufacturing and production of the new IPhone 14. Along with your overview of Apple Inc. you will present your knowledge of Business Forms, the four Financial Statements and their equations. You will prepare a Balance Sheet and an Income statement for Apple Inc. and you will provide your knowledge of the profitability, liquidity, solvency, and efficiency ratios.
Expert Answer:

Related Book For 

Posted Date:
Students also viewed these accounting questions
-
Use the attached "words.txt" file to store the words along with their ranks in an AVL tree. Then provide the user the option to search for any word. If the word exists the program displays the rank...
-
You borrowed $325000 using a 30- year fixed rate mortgage with a 5.25% interest rate: A) What is your schedule monthly payment? B) What is the amount of interest and principal paid with the first...
-
For what values of t is each function in Problem 10 continuous? a. r(t) = ln(t - 1)i + 20 - t j b. r(t) = ln(t-1)i + tan-1 tj + t k c. r(t
-
Walter White, Inc.'s return on equity is 13 percent, and management has plans to retain 20 percent of earnings for investment in the company. a. What will be the company's growth rate? b. How would...
-
Background inventory data represent average environmental interventions related to a particular material used in a particular industry.Who supplies such information? Why has background inventory data...
-
Herman Swayne is a waiter at the Dixie Hotel. In his first weekly pay in March, he earned $160.00 for the 40 hours he worked. In addition, he reports his tips for February to his employer ($700.00),...
-
Here are the relevant estimates for the budget preparation of Beta Corporation for the fourth quarter of 2023: October November December Credit sales 1 403 380 1 631 850 1 205 930 Credit purchases...
-
Table 5.5 gives data on average public teacher pay (annual salary in dollars) and spending on public schools per pupil (dollars) in 1985 for 50 states and the District of Columbia. To find out if...
-
Y5 1 Immigration in a Solow Economy [15 Points] 1 2 Consider a Solow model where the production function is Y = K. L-a, where a = and Y is aggregate output. K and L are aggregate capital and the...
-
As a Customer Service Representative, you work with the Ramp Service Employees to make sure that everything goes smoothly with flight arrivals and departures. Lately, you have not been getting along...
-
35. A soccer ball is kicked from the ground at an angle above the horizontal. Show that the equation h = 0.25R tan represents the maximum height of the ball, where h is the height and R is the range.
-
How does climate change occur? What are some of the public health risks of climate change? Which populations are the most vulnerable to climate change health risks? What is the difference between...
-
Given that human power consumption is 15 Terawatts, what area (in km2) would be required to be covered with solar panels? Assume that these solar panels are able to convert 40 Watts per square meter...
-
Do you think it is computationally feasible to calculate the behavior of individual gas particles using conservation of momentum and energy for a room full of air? Explain.
-
With the addition of water after a certain amount is taken from a sample containing 5% (w / w) NaCl solved and analyzed according to the Volhard method. 0.1M AgNO 3 into this solution 50 ml of the...
-
Flicker, Inc., a closely held corporation, acquired a passive activity this year. Gross income from operations of the activity was $160,000. Operating expenses, not including depreciation, were...
-
Clear Water Co. reports the following balance sheet accounts as of December 31. Prepare a classified balance sheet. Buildings... Accounts receivable. Land..... Merchandise inventory. Accounts...
-
Who is responsible for overseeing corporate activities?
-
Google has both fixed and variable costs. Why are fixed costs depicted as a horizontal line on a CVP chart?
-
Use and Dispose Company was organized to manufacture and sell inexpensive golf clubs that can be used during the golf round and then thrown away at the end of the round. In order to keep the business...
-
What factors must auditors consider when making materiality decisions?
-
What three assurances can auditors give to the parties that rely on financial statements?

Study smarter with the SolutionInn App