

A. Preparation Download the Case Project Excel Template from Blackboard and enter your NUID on the NUID
Question:
A. Preparation
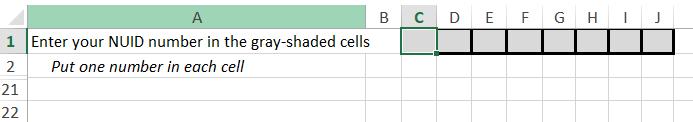
Download the Case Project Excel Template from Blackboard and enter your NUID on the NUID tab, one number per column. This step sets up your unique assignment.
B. Understanding the Company
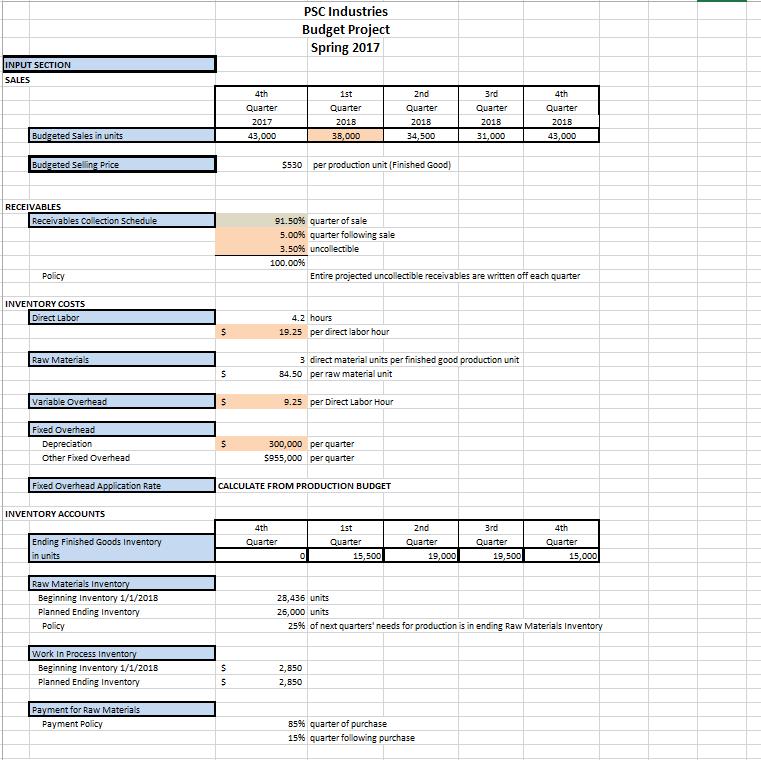
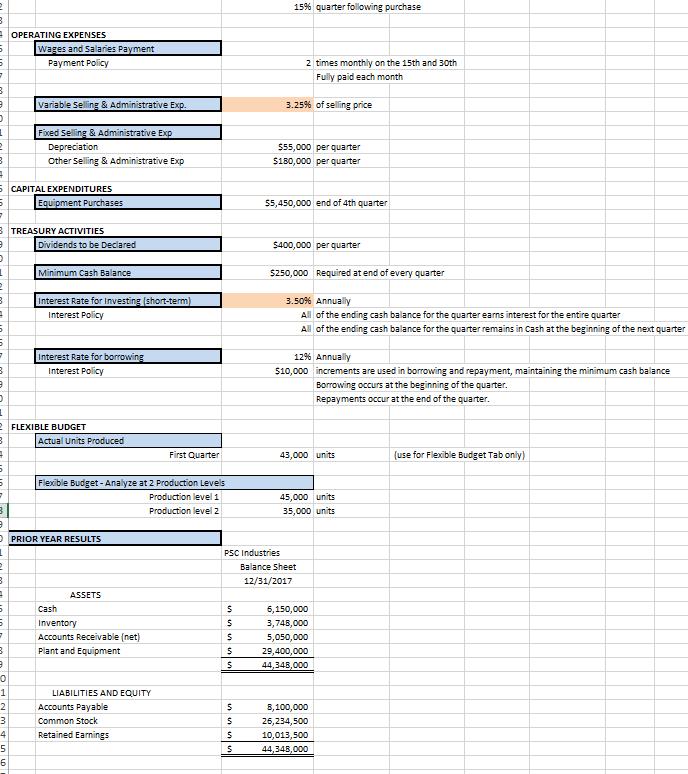
Carefully browse the Assignment Information tab for the data you need to create this year’s budgets for PSC Industries. I suggest that you print out this page with the column letters and row numbers to aid your creation & review of the budgets.
C. Budgets
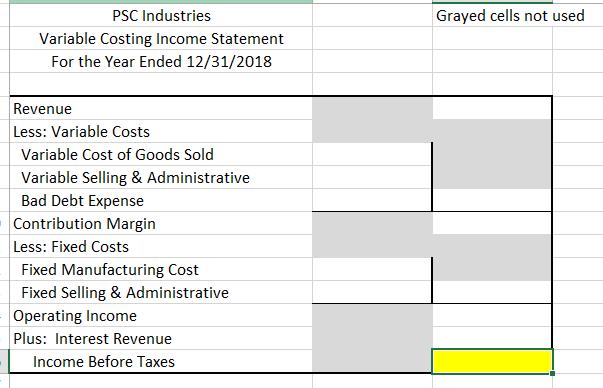
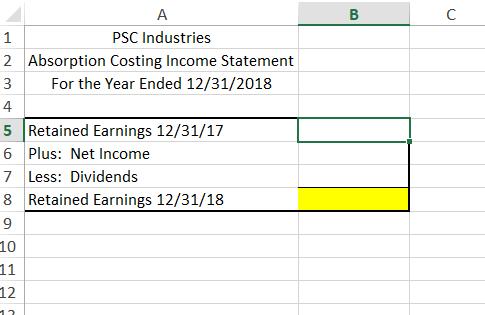
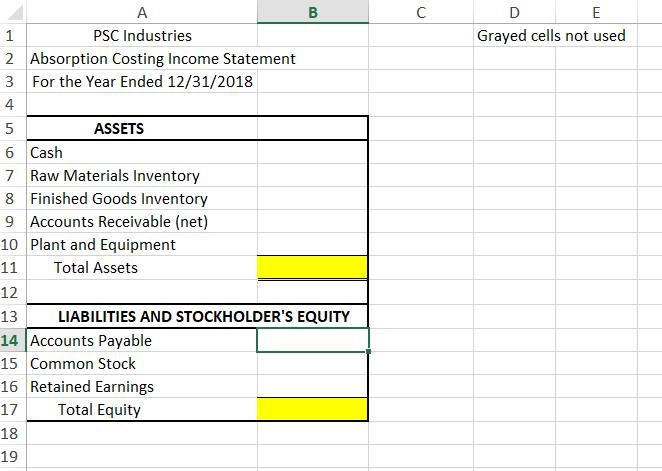
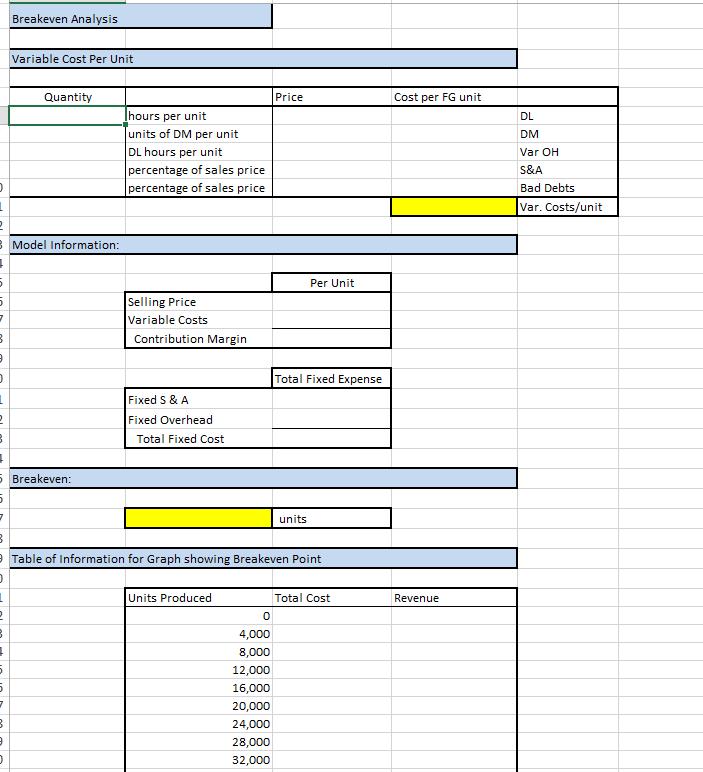
Create the following budgets / calculations on the appropriate worksheets:
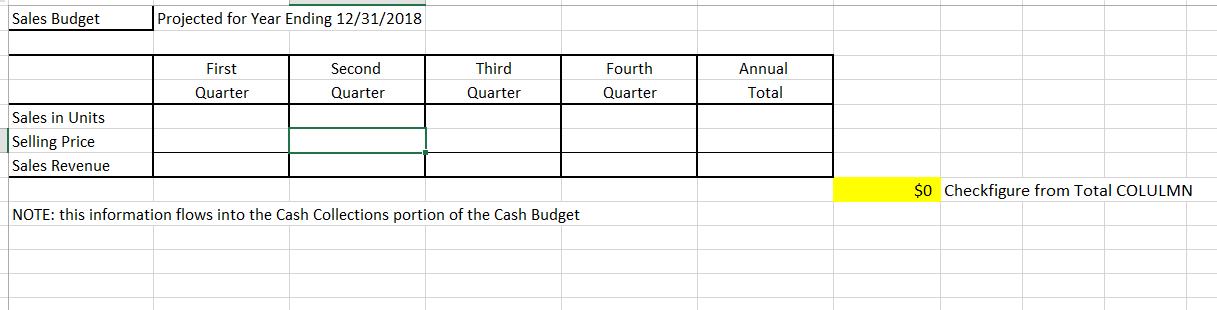
sales budget
production budget
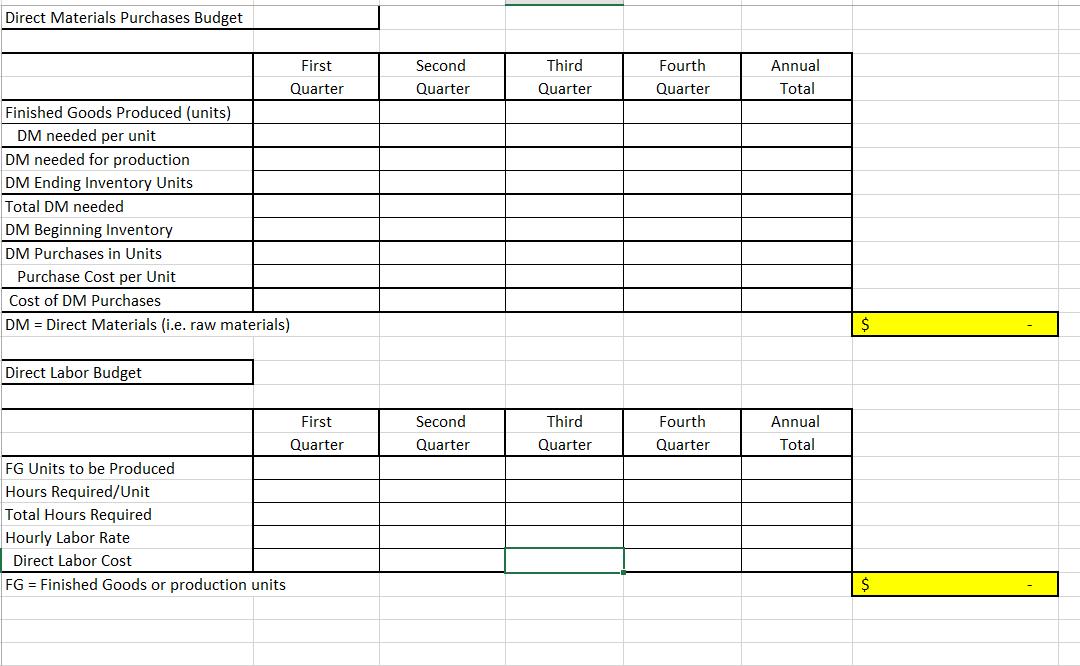
direct materials purchases budget
direct labor budget
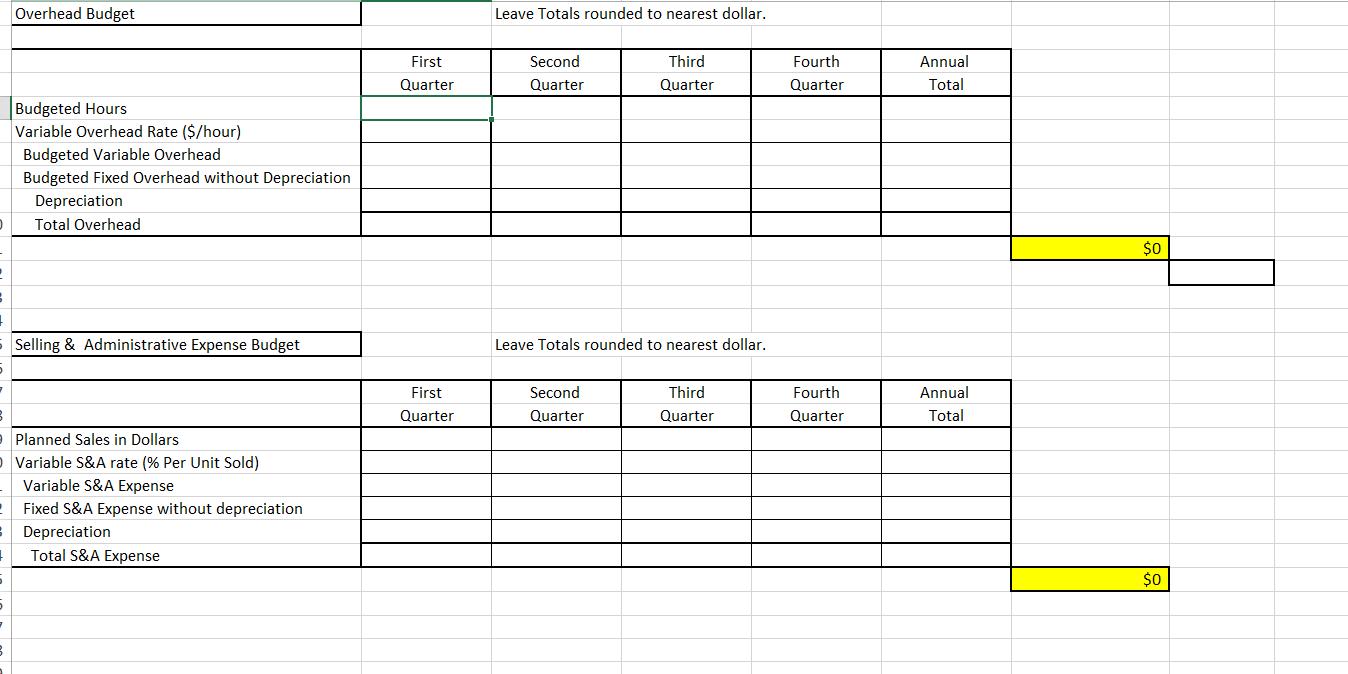
overhead budget
selling and administrative expense budget
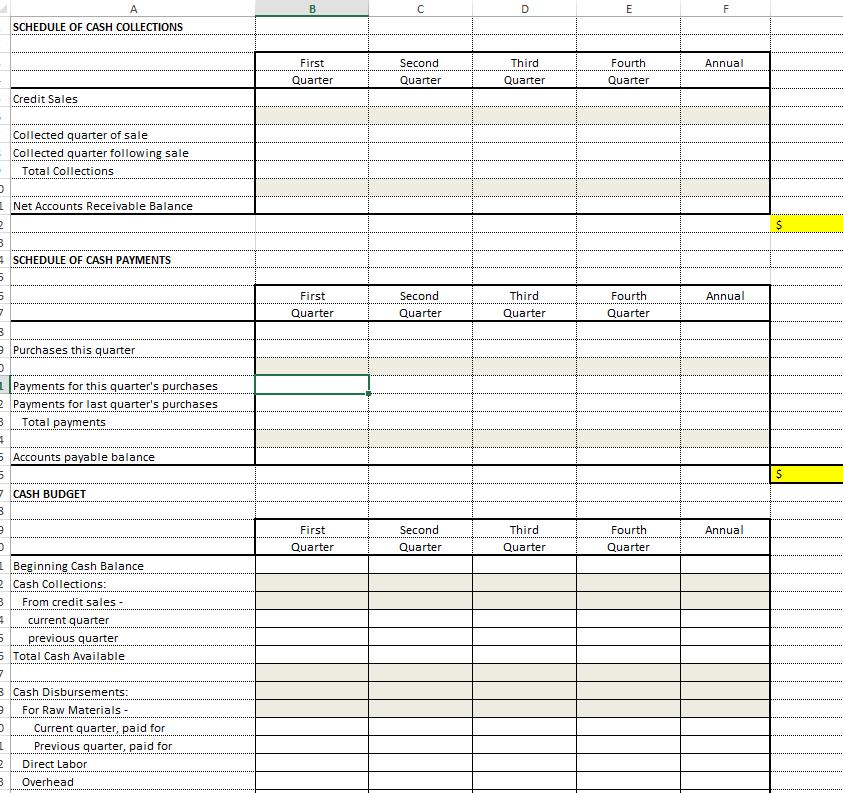
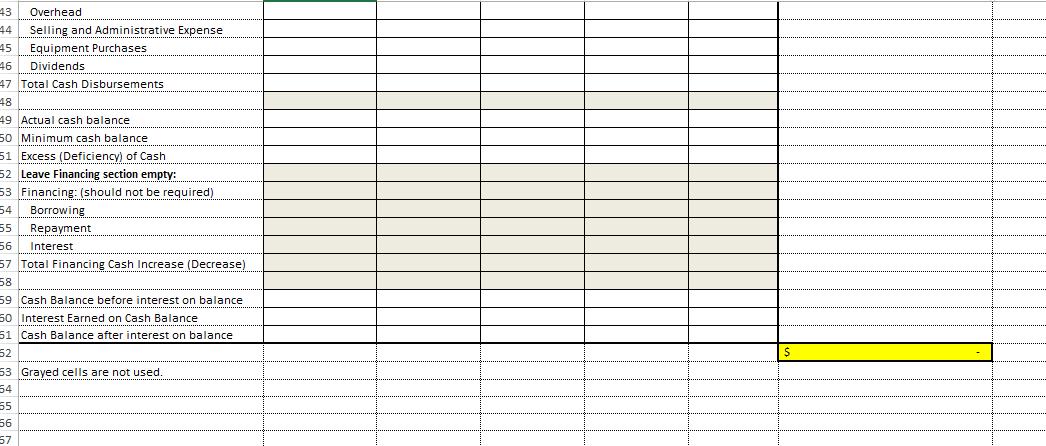
cash budget include a schedule of cash collections and payments
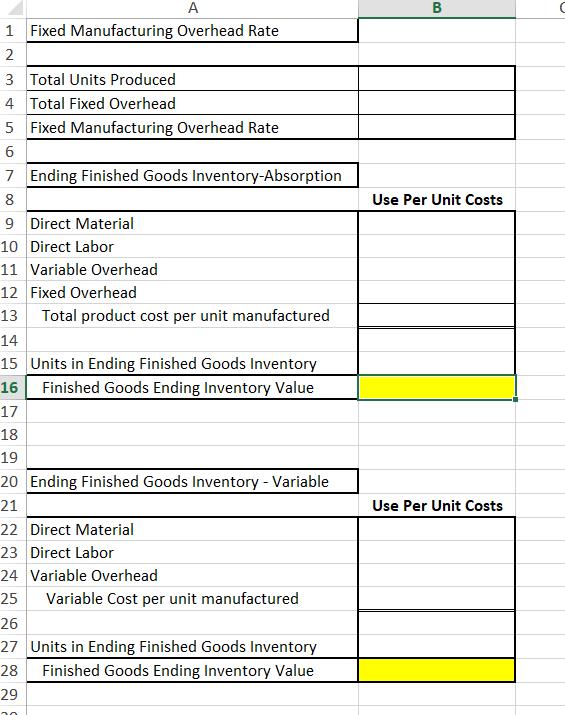
finished goods inventory calculation
part 1:
2:
 3.
3.
 4.
4.
 5.
5.
 6.
6.
7.
 8.
8.
 9.
9.
 10.
10.
 11.
11.
 12.
12.
 13.
13. 14.
14.
15.
 16.
16.
 17.
17.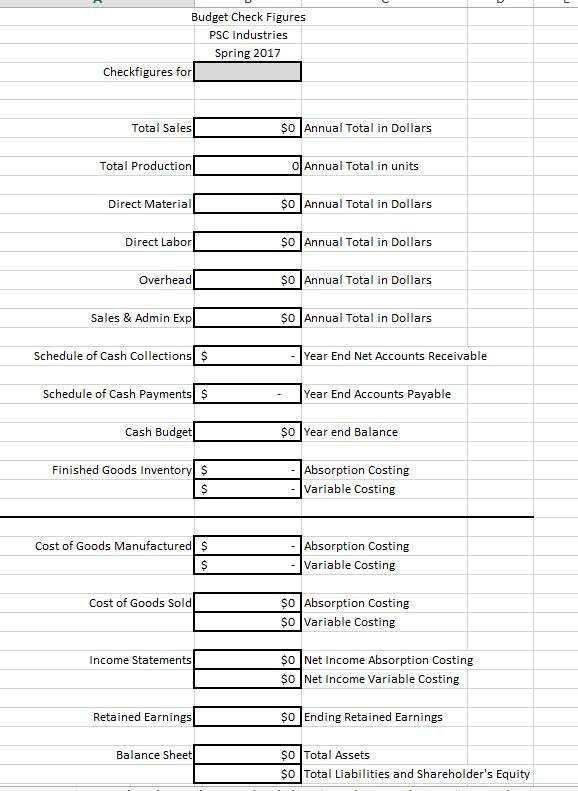
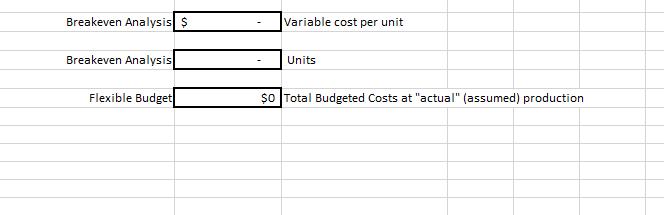
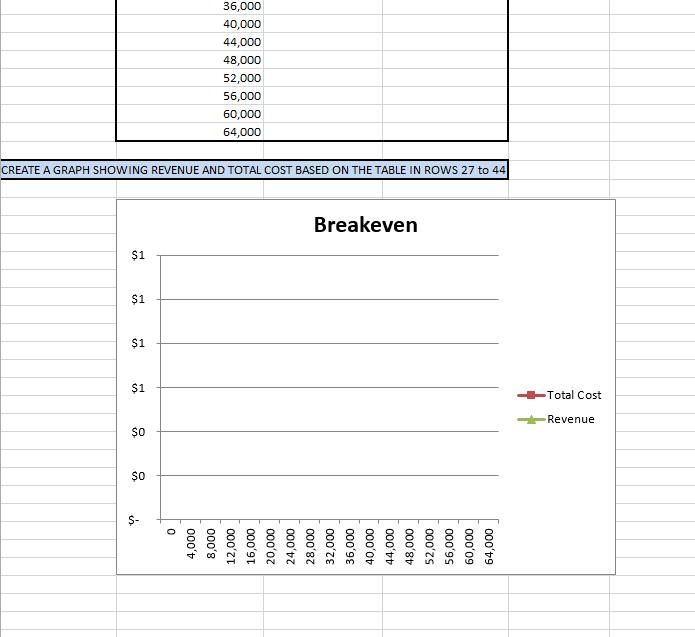
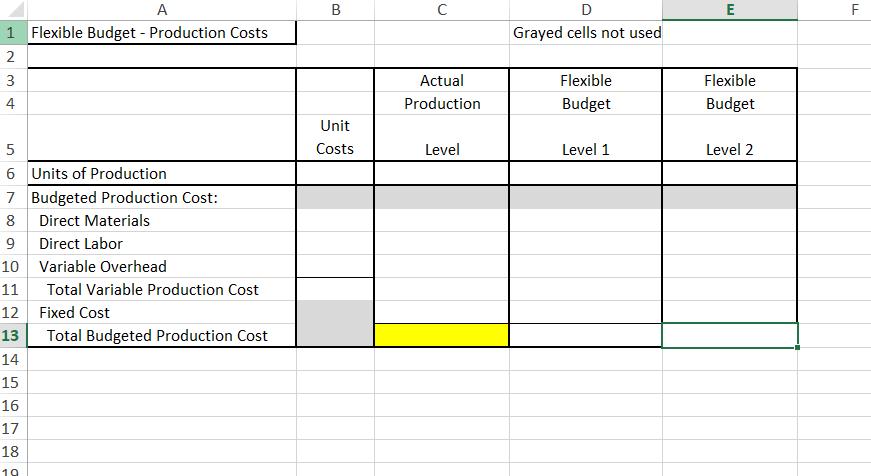
A 1 Enter your NUID number in the gray-shaded cells 2 Put one number in each cell 21 22 B C DEFGHIJ INPUT SECTION SALES Budgeted sales in units Budgeted Selling Price RECEIVABLES Receivables Collection Schedule Policy INVENTORY COSTS Direct Labor Raw Materials Variable Overhead Fixed Overhead Depreciation Other Fixed Overhead Fixed Overhead Application Rate INVENTORY ACCOUNTS Ending Finished Goods Inventory in units Raw Materials Inventory Beginning Inventory 1/1/2018 Planned Ending Inventory Policy Work In Process Inventory Beginning Inventory 1/1/2018 Planned Ending Inventory Payment for Raw Materials Payment Policy in S S S $ S vv 4th Quarter S 2017 43,000 PSC Industries Budget Project Spring 2017 91.50% quarter of sale 5.00% quarter following sale 3.50% uncollectible 100.00% $530 per production unit (Finished Good) 4th Quarter 1st Quarter 2018 38,000 4.2 hours 19.25 per direct labor hour CALCULATE FROM PRODUCTION BUDGET 9.25 per Direct Labor Hour 300,000 per quarter $955,000 per quarter 3 direct material units per finished good production unit 84.50 per raw material unit 0 Entire projected uncollectible receivables are written off each quarter 2,850 2,850 2nd Quarter 2018 34,500 1st Quarter 15,500 2nd Quarter 3rd Quarter 2018 31,000 19,000 85% quarter of purchase 15% quarter following purchase 3rd Quarter 4th Quarter 2018 43,000 19,500 4th Quarter 28,436 units 26,000 units 25% of next quarters needs for production is in ending Raw Materials Inventory 15,000 3 5 5 7 3 3 O 1 3 9 0 1 2 B 3 5 2 3 4 5 CAPITAL EXPENDITURES 6 2 5 7 3 9 D 1 2 B 4 5 5 7 3 9 1 2 B 3 5 6 7 B 9 0 1 2 3 4 OPERATING EXPENSES 5 6 Wages and Salaries Payment Payment Policy variable Selling & Administrative Exp. Fixed Selling & Administrative Exp Depreciation Other Selling & Administrative Exp Equipment Purchases TREASURY ACTIVITIES Dividends to be Declared Minimum Cash Balance Interest Rate for Investing (short-term) Interest Policy Interest Rate for borrowing Interest Policy FLEXIBLE BUDGET Actual Units Produced Flexible Budget-Analyze at 2 Production Levels Production level 1 Production level 2 PRIOR YEAR RESULTS ASSETS Cash Inventory Accounts Receivable (net) Plant and Equipment LIABILITIES AND EQUITY First Quarter Accounts Payable Common Stock Retained Earnings S S $ $ $ S S S S 15% quarter following purchase 2 times monthly on the 15th and 30th Fully paid each month 3.25% of selling price $55,000 per quarter $180,000 per quarter $5,450,000 end of 4th quarter PSC Industries $400,000 per quarter $250,000 Required at end of every quarter 3.50% Annually All of the ending cash balance for the quarter earns interest for the entire quarter All of the ending cash balance for the quarter remains in Cash at the beginning of the next quarter 12% Annually $10,000 increments are used in borrowing and repayment, maintaining the minimum cash balance Borrowing occurs at the beginning of the quarter. Repayments occur at the end of the quarter. 43,000 units 45,000 units 35,000 units Balance Sheet 12/31/2017 6,150,000 3,748,000 5,050,000 29,400,000 44,348,000 8,100,000 26,234,500 10,013,500 44,348,000 (use for Flexible Budget Tab only) Sales Budget Sales in Units Selling Price Sales Revenue Projected for Year Ending 12/31/2018 First Quarter Second Quarter Third Quarter NOTE: this information flows into the Cash Collections portion of the Cash Budget Fourth Quarter Annual Total $0 Checkfigure from Total COLULMN Sales Budget Sales in Units Selling Price Sales Revenue Projected for Year Ending 12/31/2018 First Quarter Second Quarter Third Quarter NOTE: this information flows into the Cash Collections portion of the Cash Budget Fourth Quarter Annual Total $0 Checkfigure from Total COLULMN Direct Materials Purchases Budget Finished Goods Produced (units) DM needed per unit DM needed for production DM Ending Inventory Units Total DM needed DM Beginning Inventory DM Purchases in Units Purchase Cost per Unit Cost of DM Purchases DM Direct Materials (i.e. raw materials) Direct Labor Budget FG Units to be Produced Hours Required/Unit Total Hours Required First Quarter Hourly Labor Rate Direct Labor Cost FG Finished Goods or production units First Quarter Second Quarter Second Quarter Third Quarter Third Quarter Fourth Quarter Fourth Quarter Annual Total Annual Total $ $ 0 . 3 Overhead Budget Budgeted Hours Variable Overhead Rate ($/hour) Budgeted Variable Overhead Budgeted Fixed Overhead without Depreciation Depreciation Total Overhead Selling & Administrative Expense Budget Planned Sales in Dollars Variable S&A rate (% 1 Variable S&A Expense Fixed S&A Expense without depreciation Depreciation Total S&A Expense Sold) First Quarter First Quarter Leave Totals rounded to nearest dollar. Second Quarter Third Quarter Leave Totals rounded to nearest dollar. Second Quarter Third Quarter Fourth Quarter Fourth Quarter Annual Total Annual Total $0 $0 5 D 1 Net Accounts Receivable Balance 2 7 A SCHEDULE OF CASH COLLECTIONS B 4 SCHEDULE OF CASH PAYMENTS 5 Credit Sales Collected quarter of sale Collected quarter following sale Total Collections 3 e Purchases this quarter O 1 Payments for this quarter s purchases 2 Payments for last quarter s purchases B Total payments 9 4 5 Accounts payable balance 5 0 7 CASH BUDGET B Beginning Cash Balance 2 Cash Collections: 3 From credit sales - 4 current quarter 5 previous quarter 5 Total Cash Available 7 3 Cash Disbursements: 9 For Raw Materials - 0 Current quarter, paid for 1 Previous quarter, paid for 2 Direct Labor B Overhead B First Quarter First Quarter First Quarter C Second Quarter Second Quarter Second Quarter D Third Quarter Third Quarter Third Quarter E Fourth Quarter Fourth Quarter Fourth Quarter F Annual Annual Annual $ $ 43 Overhead 44 Selling and Administrative Expense 45 Equipment Purchases 46 Dividends 47 Total Cash Disbursements 48 49 Actual cash balance 50 Minimum cash balance 51 Excess (Deficiency) of Cash 52 Leave Financing section empty: 53 Financing: (should not be required) 54 Borrowing 55 Repayment 56 Interest 57 Total Financing Cash Increase (Decrease) 58 59 Cash Balance before interest on balance 50 Interest Earned on Cash Balance 51 Cash Balance after interest on balance 52 53 Graved cells are not used. 54 55 56 57 A 1 Fixed Manufacturing Overhead Rate 2 3 Total Units Produced 4 Total Fixed Overhead 5 Fixed Manufacturing Overhead Rate 6 7 Ending Finished Goods Inventory-Absorption 8 9 Direct Material 10 Direct Labor 11 Variable Overhead 12 Fixed Overhead 13 Total product cost per unit manufactured 14 15 Units in Ending Finished Goods Inventory Finished Goods Ending Inventory Value 16 17 18 19 20 Ending Finished Goods Inventory - Variable 21 22 Direct Material 23 Direct Labor 24 Variable Overhead 25 Variable Cost per unit manufactured 26 27 Units in Ending Finished Goods Inventory Finished Goods Ending Inventory Value 28 29 B Use Per Unit Costs Use Per Unit Costs A LCost of Goods Manufactured - Absorption 2 For Year Ended 12/31/2018 3 4 Direct Materials: 5 Beginning Inventory 5 Direct Material Purchases 7 Direct Materials Available 3 Ending Inventory 9 0 Direct Labor: 1 Overhead: 2 3 4 Direct Materials Used 6 67 5 6 7 8 9 Cost of Goods Manufactured - Variable 0 For Year Ended 12/31/2018 1 2 Direct Materials Used 3 Direct Labor 4 Variable Overhead 5 Total Variable Manufacturing Costs Total Manufacturing Costs Added Plus: Beginning Work in Process Inventory Total Manufacturing Costs Less: Ending Work in Process Inventory Cost of Goods Manufactured B C Grayed cells not used A 1 Cost of Goods Sold - Absorption 2 3 Finished Goods Beginning Inventory 4 Cost of Goods Manufactured 5 Finished Goods Ending Inventory Cost of Goods Sold 5 7 3 9 Cost of Goods Sold - Variable 0 1 Finished Goods Beginning Inventory 2 Cost of Goods Manufactured 3 Finished Goods Ending Inventory 4 Cost of Goods Sold 5 B C Note: FG beginning Inventory is on Input Tab PSC Industries -Absorption Costing Income Statement For the Year Ended 12/31/2018 - S - Less: Operating Expenses Selling & Administrative Expense Bad Debt Expense 1 Operating Income 2 Plus: Interest Revenue 3 Income Before Taxes 1 4 5 5 Revenue Less: Cost of Goods Sold Gross Margin J 3 Grayed cells not used PSC Industries Variable Costing Income Statement For the Year Ended 12/31/2018 Revenue Less: Variable Costs Variable Cost of Goods Sold Variable Selling & Administrative Bad Debt Expense Contribution Margin Less: Fixed Costs Fixed Manufacturing Cost Fixed Selling & Administrative Operating Income Plus: Interest Revenue Income Before Taxes Grayed cells not used A 1 PSC Industries 2 Absorption Costing Income Statement 3 For the Year Ended 12/31/2018 3 4 4 5 Retained Earnings 12/31/17 6 Plus: Net Income 7 Less: Dividends 8 Retained Earnings 12/31/18 9 10 11 12 12 B C 1 12 A PSC Industries 2 Absorption Costing Income Statement 3 For the Year Ended 12/31/2018 4 5 6 Cash 7 Raw Materials Inventory 8 Finished Goods Inventory 9 Accounts Receivable (net) 10 Plant and Equipment 11 Total Assets 12 13 14 Accounts Payable 15 Common Stock 16 Retained Earnings 17 Total Equity 18 19 ASSETS B LIABILITIES AND STOCKHOLDER S EQUITY C E D Grayed cells not used 5 7 B D 8 Model Information: L 2 3 7 3 Breakeven Analysis 0 1 2 B Variable Cost Per Unit 5 Breakeven: 7 B 9 0 Quantity hours per unit units of DM per unit DL hours per unit percentage of sales price percentage of sales price Selling Price Variable Costs Contribution Margin Fixed S & A Fixed Overhead Total Fixed Cost Units Produced Price 0 4,000 8,000 12,000 16,000 20,000 24,000 28,000 32,000 Per Unit Total Fixed Expense units Table of Information for Graph showing Breakeven Point Total Cost Cost per FG unit Revenue DL DM Var OH S&A Bad Debts Var. Costs/unit $1 CREATE A GRAPH SHOWING REVENUE AND TOTAL COST BASED ON THE TABLE IN ROWS 27 to 44 $1 $1 $1 $O $0 36,000 40,000 is 44,000 48,000 52,000 56,000 60,000 64,000 Breakeven 0 4,000 8,000 12,000 16,000 20,000 24,000 28,000 32,000 36,000 40,000 44,000 48,000 52,000 56,000 60,000 64,000 Total Cost Revenue A 1 Flexible Budget - Production Costs 2 3 4 5 6 Units of Production 7 Budgeted Production Cost: 8 Direct Materials 9 Direct Labor 10 Variable Overhead 11 12 Fixed Cost 13 14 15 16 67 17 18 O 00 19 Total Variable Production Cost Total Budgeted Production Cost B Unit Costs C Actual Production Level D Grayed cells not used Flexible Budget Level 1 E Flexible Budget Level 2 F Budget Check Figures PSC Industries Spring 2017 Checkfigures for Total Sales Total Production Direct Material Direct Labor Overhead Sales & Admin Exp Schedule of Cash Collections $ Schedule of Cash Payments $ Cash Budget Finished Goods Inventory S $ Cost of Goods Manufactured $ $ Cost of Goods Sold Income Statements Retained Earnings Balance Sheet $0 Annual Total in Dollars Annual Total in units $0 Annual Total in Dollars $0 Annual Total in Dollars $0 Annual Total in Dollars $0 Annual Total in Dollars Year End Net Accounts Receivable Year End Accounts Payable $0 Year end Balance Absorption Costing Variable Costing Absorption Costing -Variable Costing $0 Absorption Costing $0 Variable Costing $0 Net Income Absorption Costing $0 Net Income Variable Costing $0 Ending Retained Earnings $0 Total Assets $0 Total Liabilities and Shareholder s Equity Breakeven Analysis $ Breakeven Analysis Flexible Budget Variable cost per unit Units $0 Total Budgeted Costs at actual (assumed) production A 1 Enter your NUID number in the gray-shaded cells 2 Put one number in each cell 21 22 B C DEFGHIJ INPUT SECTION SALES Budgeted sales in units Budgeted Selling Price RECEIVABLES Receivables Collection Schedule Policy INVENTORY COSTS Direct Labor Raw Materials Variable Overhead Fixed Overhead Depreciation Other Fixed Overhead Fixed Overhead Application Rate INVENTORY ACCOUNTS Ending Finished Goods Inventory in units Raw Materials Inventory Beginning Inventory 1/1/2018 Planned Ending Inventory Policy Work In Process Inventory Beginning Inventory 1/1/2018 Planned Ending Inventory Payment for Raw Materials Payment Policy in S S S $ S vv 4th Quarter S 2017 43,000 PSC Industries Budget Project Spring 2017 91.50% quarter of sale 5.00% quarter following sale 3.50% uncollectible 100.00% $530 per production unit (Finished Good) 4th Quarter 1st Quarter 2018 38,000 4.2 hours 19.25 per direct labor hour CALCULATE FROM PRODUCTION BUDGET 9.25 per Direct Labor Hour 300,000 per quarter $955,000 per quarter 3 direct material units per finished good production unit 84.50 per raw material unit 0 Entire projected uncollectible receivables are written off each quarter 2,850 2,850 2nd Quarter 2018 34,500 1st Quarter 15,500 2nd Quarter 3rd Quarter 2018 31,000 19,000 85% quarter of purchase 15% quarter following purchase 3rd Quarter 4th Quarter 2018 43,000 19,500 4th Quarter 28,436 units 26,000 units 25% of next quarters needs for production is in ending Raw Materials Inventory 15,000 3 5 5 7 3 3 O 1 3 9 0 1 2 B 3 5 2 3 4 5 CAPITAL EXPENDITURES 6 2 5 7 3 9 D 1 2 B 4 5 5 7 3 9 1 2 B 3 5 6 7 B 9 0 1 2 3 4 OPERATING EXPENSES 5 6 Wages and Salaries Payment Payment Policy variable Selling & Administrative Exp. Fixed Selling & Administrative Exp Depreciation Other Selling & Administrative Exp Equipment Purchases TREASURY ACTIVITIES Dividends to be Declared Minimum Cash Balance Interest Rate for Investing (short-term) Interest Policy Interest Rate for borrowing Interest Policy FLEXIBLE BUDGET Actual Units Produced Flexible Budget-Analyze at 2 Production Levels Production level 1 Production level 2 PRIOR YEAR RESULTS ASSETS Cash Inventory Accounts Receivable (net) Plant and Equipment LIABILITIES AND EQUITY First Quarter Accounts Payable Common Stock Retained Earnings S S $ $ $ S S S S 15% quarter following purchase 2 times monthly on the 15th and 30th Fully paid each month 3.25% of selling price $55,000 per quarter $180,000 per quarter $5,450,000 end of 4th quarter PSC Industries $400,000 per quarter $250,000 Required at end of every quarter 3.50% Annually All of the ending cash balance for the quarter earns interest for the entire quarter All of the ending cash balance for the quarter remains in Cash at the beginning of the next quarter 12% Annually $10,000 increments are used in borrowing and repayment, maintaining the minimum cash balance Borrowing occurs at the beginning of the quarter. Repayments occur at the end of the quarter. 43,000 units 45,000 units 35,000 units Balance Sheet 12/31/2017 6,150,000 3,748,000 5,050,000 29,400,000 44,348,000 8,100,000 26,234,500 10,013,500 44,348,000 (use for Flexible Budget Tab only) Sales Budget Sales in Units Selling Price Sales Revenue Projected for Year Ending 12/31/2018 First Quarter Second Quarter Third Quarter NOTE: this information flows into the Cash Collections portion of the Cash Budget Fourth Quarter Annual Total $0 Checkfigure from Total COLULMN Sales Budget Sales in Units Selling Price Sales Revenue Projected for Year Ending 12/31/2018 First Quarter Second Quarter Third Quarter NOTE: this information flows into the Cash Collections portion of the Cash Budget Fourth Quarter Annual Total $0 Checkfigure from Total COLULMN Direct Materials Purchases Budget Finished Goods Produced (units) DM needed per unit DM needed for production DM Ending Inventory Units Total DM needed DM Beginning Inventory DM Purchases in Units Purchase Cost per Unit Cost of DM Purchases DM Direct Materials (i.e. raw materials) Direct Labor Budget FG Units to be Produced Hours Required/Unit Total Hours Required First Quarter Hourly Labor Rate Direct Labor Cost FG Finished Goods or production units First Quarter Second Quarter Second Quarter Third Quarter Third Quarter Fourth Quarter Fourth Quarter Annual Total Annual Total $ $ 0 . 3 Overhead Budget Budgeted Hours Variable Overhead Rate ($/hour) Budgeted Variable Overhead Budgeted Fixed Overhead without Depreciation Depreciation Total Overhead Selling & Administrative Expense Budget Planned Sales in Dollars Variable S&A rate (% 1 Variable S&A Expense Fixed S&A Expense without depreciation Depreciation Total S&A Expense Sold) First Quarter First Quarter Leave Totals rounded to nearest dollar. Second Quarter Third Quarter Leave Totals rounded to nearest dollar. Second Quarter Third Quarter Fourth Quarter Fourth Quarter Annual Total Annual Total $0 $0 5 D 1 Net Accounts Receivable Balance 2 7 A SCHEDULE OF CASH COLLECTIONS B 4 SCHEDULE OF CASH PAYMENTS 5 Credit Sales Collected quarter of sale Collected quarter following sale Total Collections 3 e Purchases this quarter O 1 Payments for this quarter s purchases 2 Payments for last quarter s purchases B Total payments 9 4 5 Accounts payable balance 5 0 7 CASH BUDGET B Beginning Cash Balance 2 Cash Collections: 3 From credit sales - 4 current quarter 5 previous quarter 5 Total Cash Available 7 3 Cash Disbursements: 9 For Raw Materials - 0 Current quarter, paid for 1 Previous quarter, paid for 2 Direct Labor B Overhead B First Quarter First Quarter First Quarter C Second Quarter Second Quarter Second Quarter D Third Quarter Third Quarter Third Quarter E Fourth Quarter Fourth Quarter Fourth Quarter F Annual Annual Annual $ $ 43 Overhead 44 Selling and Administrative Expense 45 Equipment Purchases 46 Dividends 47 Total Cash Disbursements 48 49 Actual cash balance 50 Minimum cash balance 51 Excess (Deficiency) of Cash 52 Leave Financing section empty: 53 Financing: (should not be required) 54 Borrowing 55 Repayment 56 Interest 57 Total Financing Cash Increase (Decrease) 58 59 Cash Balance before interest on balance 50 Interest Earned on Cash Balance 51 Cash Balance after interest on balance 52 53 Graved cells are not used. 54 55 56 57 A 1 Fixed Manufacturing Overhead Rate 2 3 Total Units Produced 4 Total Fixed Overhead 5 Fixed Manufacturing Overhead Rate 6 7 Ending Finished Goods Inventory-Absorption 8 9 Direct Material 10 Direct Labor 11 Variable Overhead 12 Fixed Overhead 13 Total product cost per unit manufactured 14 15 Units in Ending Finished Goods Inventory Finished Goods Ending Inventory Value 16 17 18 19 20 Ending Finished Goods Inventory - Variable 21 22 Direct Material 23 Direct Labor 24 Variable Overhead 25 Variable Cost per unit manufactured 26 27 Units in Ending Finished Goods Inventory Finished Goods Ending Inventory Value 28 29 B Use Per Unit Costs Use Per Unit Costs A LCost of Goods Manufactured - Absorption 2 For Year Ended 12/31/2018 3 4 Direct Materials: 5 Beginning Inventory 5 Direct Material Purchases 7 Direct Materials Available 3 Ending Inventory 9 0 Direct Labor: 1 Overhead: 2 3 4 Direct Materials Used 6 67 5 6 7 8 9 Cost of Goods Manufactured - Variable 0 For Year Ended 12/31/2018 1 2 Direct Materials Used 3 Direct Labor 4 Variable Overhead 5 Total Variable Manufacturing Costs Total Manufacturing Costs Added Plus: Beginning Work in Process Inventory Total Manufacturing Costs Less: Ending Work in Process Inventory Cost of Goods Manufactured B C Grayed cells not used A 1 Cost of Goods Sold - Absorption 2 3 Finished Goods Beginning Inventory 4 Cost of Goods Manufactured 5 Finished Goods Ending Inventory Cost of Goods Sold 5 7 3 9 Cost of Goods Sold - Variable 0 1 Finished Goods Beginning Inventory 2 Cost of Goods Manufactured 3 Finished Goods Ending Inventory 4 Cost of Goods Sold 5 B C Note: FG beginning Inventory is on Input Tab PSC Industries -Absorption Costing Income Statement For the Year Ended 12/31/2018 - S - Less: Operating Expenses Selling & Administrative Expense Bad Debt Expense 1 Operating Income 2 Plus: Interest Revenue 3 Income Before Taxes 1 4 5 5 Revenue Less: Cost of Goods Sold Gross Margin J 3 Grayed cells not used PSC Industries Variable Costing Income Statement For the Year Ended 12/31/2018 Revenue Less: Variable Costs Variable Cost of Goods Sold Variable Selling & Administrative Bad Debt Expense Contribution Margin Less: Fixed Costs Fixed Manufacturing Cost Fixed Selling & Administrative Operating Income Plus: Interest Revenue Income Before Taxes Grayed cells not used A 1 PSC Industries 2 Absorption Costing Income Statement 3 For the Year Ended 12/31/2018 3 4 4 5 Retained Earnings 12/31/17 6 Plus: Net Income 7 Less: Dividends 8 Retained Earnings 12/31/18 9 10 11 12 12 B C 1 12 A PSC Industries 2 Absorption Costing Income Statement 3 For the Year Ended 12/31/2018 4 5 6 Cash 7 Raw Materials Inventory 8 Finished Goods Inventory 9 Accounts Receivable (net) 10 Plant and Equipment 11 Total Assets 12 13 14 Accounts Payable 15 Common Stock 16 Retained Earnings 17 Total Equity 18 19 ASSETS B LIABILITIES AND STOCKHOLDER S EQUITY C E D Grayed cells not used 5 7 B D 8 Model Information: L 2 3 7 3 Breakeven Analysis 0 1 2 B Variable Cost Per Unit 5 Breakeven: 7 B 9 0 Quantity hours per unit units of DM per unit DL hours per unit percentage of sales price percentage of sales price Selling Price Variable Costs Contribution Margin Fixed S & A Fixed Overhead Total Fixed Cost Units Produced Price 0 4,000 8,000 12,000 16,000 20,000 24,000 28,000 32,000 Per Unit Total Fixed Expense units Table of Information for Graph showing Breakeven Point Total Cost Cost per FG unit Revenue DL DM Var OH S&A Bad Debts Var. Costs/unit $1 CREATE A GRAPH SHOWING REVENUE AND TOTAL COST BASED ON THE TABLE IN ROWS 27 to 44 $1 $1 $1 $O $0 36,000 40,000 is 44,000 48,000 52,000 56,000 60,000 64,000 Breakeven 0 4,000 8,000 12,000 16,000 20,000 24,000 28,000 32,000 36,000 40,000 44,000 48,000 52,000 56,000 60,000 64,000 Total Cost Revenue A 1 Flexible Budget - Production Costs 2 3 4 5 6 Units of Production 7 Budgeted Production Cost: 8 Direct Materials 9 Direct Labor 10 Variable Overhead 11 12 Fixed Cost 13 14 15 16 67 17 18 O 00 19 Total Variable Production Cost Total Budgeted Production Cost B Unit Costs C Actual Production Level D Grayed cells not used Flexible Budget Level 1 E Flexible Budget Level 2 F Budget Check Figures PSC Industries Spring 2017 Checkfigures for Total Sales Total Production Direct Material Direct Labor Overhead Sales & Admin Exp Schedule of Cash Collections $ Schedule of Cash Payments $ Cash Budget Finished Goods Inventory S $ Cost of Goods Manufactured $ $ Cost of Goods Sold Income Statements Retained Earnings Balance Sheet $0 Annual Total in Dollars Annual Total in units $0 Annual Total in Dollars $0 Annual Total in Dollars $0 Annual Total in Dollars $0 Annual Total in Dollars Year End Net Accounts Receivable Year End Accounts Payable $0 Year end Balance Absorption Costing Variable Costing Absorption Costing -Variable Costing $0 Absorption Costing $0 Variable Costing $0 Net Income Absorption Costing $0 Net Income Variable Costing $0 Ending Retained Earnings $0 Total Assets $0 Total Liabilities and Shareholder s Equity Breakeven Analysis $ Breakeven Analysis Flexible Budget Variable cost per unit Units $0 Total Budgeted Costs at actual (assumed) production
Expert Answer:


Income Tax Fundamentals 2013
ISBN: 9781285586618
31st Edition
Authors: Gerald E. Whittenburg, Martha Altus Buller, Steven L Gill
Students also viewed these accounting questions
-
What is employee #1 taxable FUTA wages for quarter 3? What is employee #1 taxable FUTA wages for quarter 4 ? What is employee #7 taxable FUTA wages for quarter 2? What is employee #7 taxable FUTA...
-
Suppose that you are the owner of the Original Italian Pizza restaurant chain and would like to predict the sales of your specialty, deep-dish pizza. You have gathered data on the monthly sales of...
-
A 1 defects size B D E 88888888888888888888888888 2 21 3 24 4 16 5 12 6 15 7 5 8 28 9 20 10 31 11 25 12 20 13 24 14 16 15 19 16 10 17 17 18 13 19 22 20 18 21 39 22 30 23 24 24 16 25 19 26 17 27 15...
-
Find the total heat loss from a room in units (1 unit = 1 kWh); the U-values and surface areas of the different elements are given in the Table 1. The inside and outside air temperatures are 10 C and...
-
Which is learning approach: The behavioral approach or Banduras social learning theory do you find more appropriate for people? Explain in detail!!
-
The accounting records of Iberia Corporation reveal the following: Compute cash flows from operating activities by the indirect method. Use the format of the operating activities section of Exhibit...
-
Michigan Machining Company (MMC) produces three productspistons, valves, and camsfor the heavy equipment industry. MMC has a very simple production process and product line and uses a single...
-
Refer to the data in Exercise 6-31. Compute the individual product costs per unit assuming that Tiger Furnishings uses direct labor costs to allocate overhead to the products.
-
2)(50 puan) f(x) = sin (x) ve g(x) = cos (x) olmak zere (a) y = f(x) ve y = g(x) fonksiyonlarnn x E [-2, 2] iin artan ve azalan olduu aralklar belirleyiniz. Yerel ekstremum noktalarnn apsislerini ve...
-
Baer Belly Bikinis, Inc. (BBB) is a small business located in Santa Monica, California. It sells swimwear and related products to specialty stores throughout the United States. It also sells its...
-
Prepare and deliver a 5 -10 minute presentation on the findings of your points of view research paper. To record your presentation, you should create a PowerPoint with a voiceover. The PowerPoint...
-
A turbine is supplied with steam at a pressure of 30 bar and a temperature of 400C. The steam then expands isentropically to a pressure of 0.08 bar. Find the dryness fraction at the end of expansion...
-
Write a C program that asks user to input float radius and calculates the area in a separate function to display the output below after checking if area's float value exceeds 1000 or not. Sample...
-
850. A certain area has the following properties: I. = 40 in.', I, = 100 in.", Pry= 40 in. Determine the values of the maximum and minimum moments of inertia, and also the angle that the axis of...
-
Question 2 Two spherical beads (charged equally, with each one weighing 9.50 g) are put 3.70 cm away from each other. If they are let go and begin to accelerate at 123 m/s, what would be the...
-
Cheetah Company manufactures custom-designed skins (covers) for iPods and other portable MP3 devices. Variable costs are $8.40 per custom skin, the price is $12, and fixed costs are $94,320....
-
Wodonga Off-road manufactures 4wd nudge bars. As part of the production process, the Steel Fabrication Department supplies steel to the Assembly Department. The Assembly Department requires 10 metres...
-
U.S. households have become smaller over the years. The following table from the 2010 GSS contains information on the number of people currently aged 18 years or older living in a respondent's...
-
In 2012, Gale and Cathy Alexander hosted an exchange student, Axel Muller, for 9 months. Axel was part of International Student Exchange Programs (a qualified organization). Axel attended tenth grade...
-
Patty Bayan is a single taxpayer living at 543 Space Drive, Houston, TX 77099. Her Social Security number is 466-33-1234. For 2012, Patty has no dependents, and her W-2 from her job at a local...
-
Teresa is a civil engineer who uses her automobile for business. Teresa drove her automobile a total of 21,732 miles during 2012, of which 95 percent was business mileage. The actual cost of...
-
What accounting procedures must be completed before the partnership liquidation process begins?
-
Scott Badger and Maxine Giesen are partners in a business. On December 31 of the current year, the partners equities are Scott, \($60,000.00\) and Maxine, \($90,000.00.\) The net income for the year...
-
Maria Delgado and Oren Kelso are partners in a business. Statement paper, page 15 of a general journal, and a portion of the partnership's completed work sheet for the year ended December 31 of the...

Study smarter with the SolutionInn App