

As you move into your career, you will have a 401K and investments that requires knowledge...
Fantastic news! We've Found the answer you've been seeking!
Question:
Transcribed Image Text:
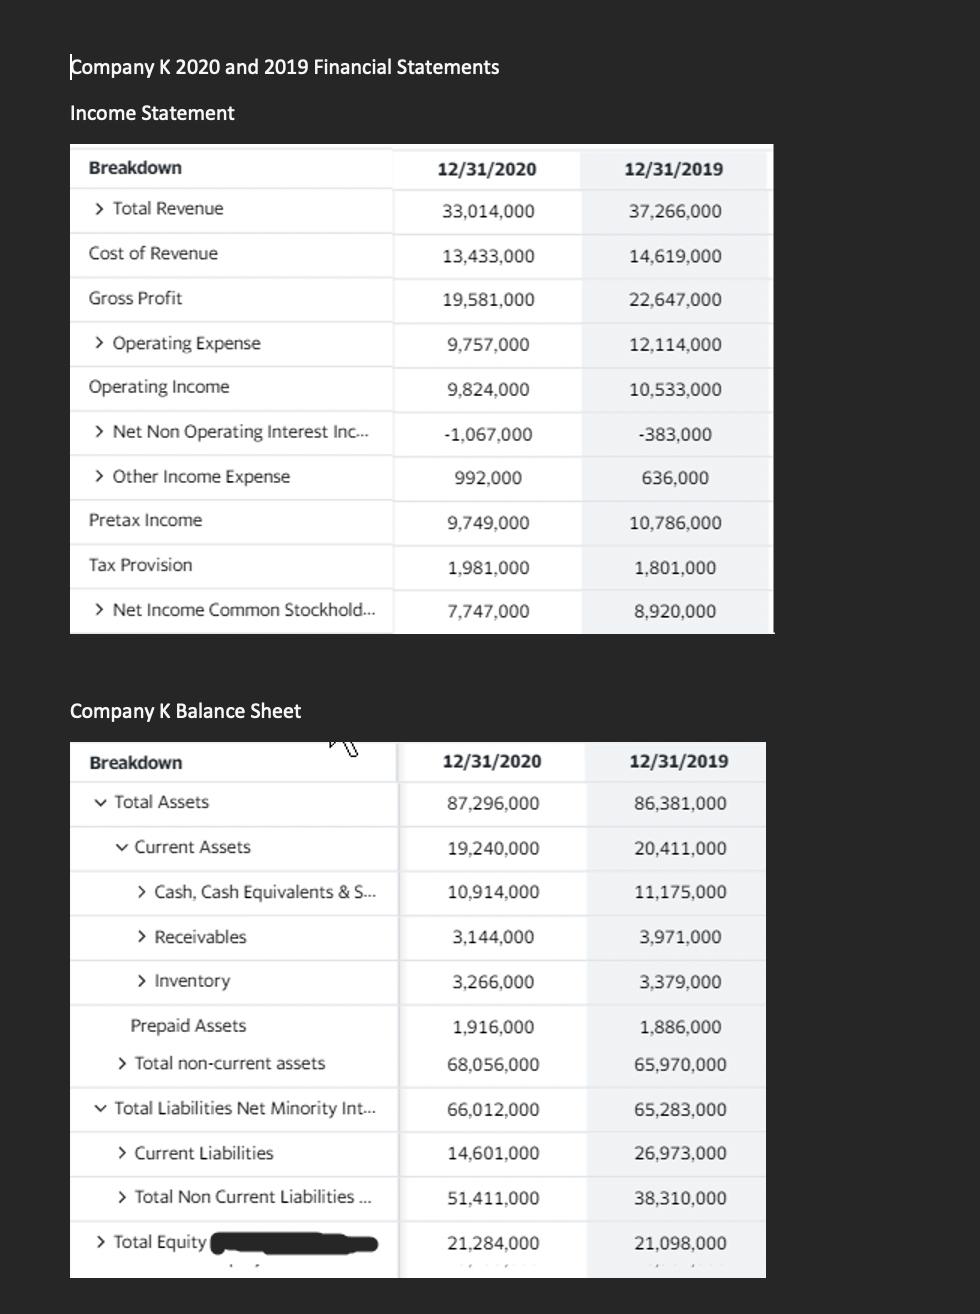
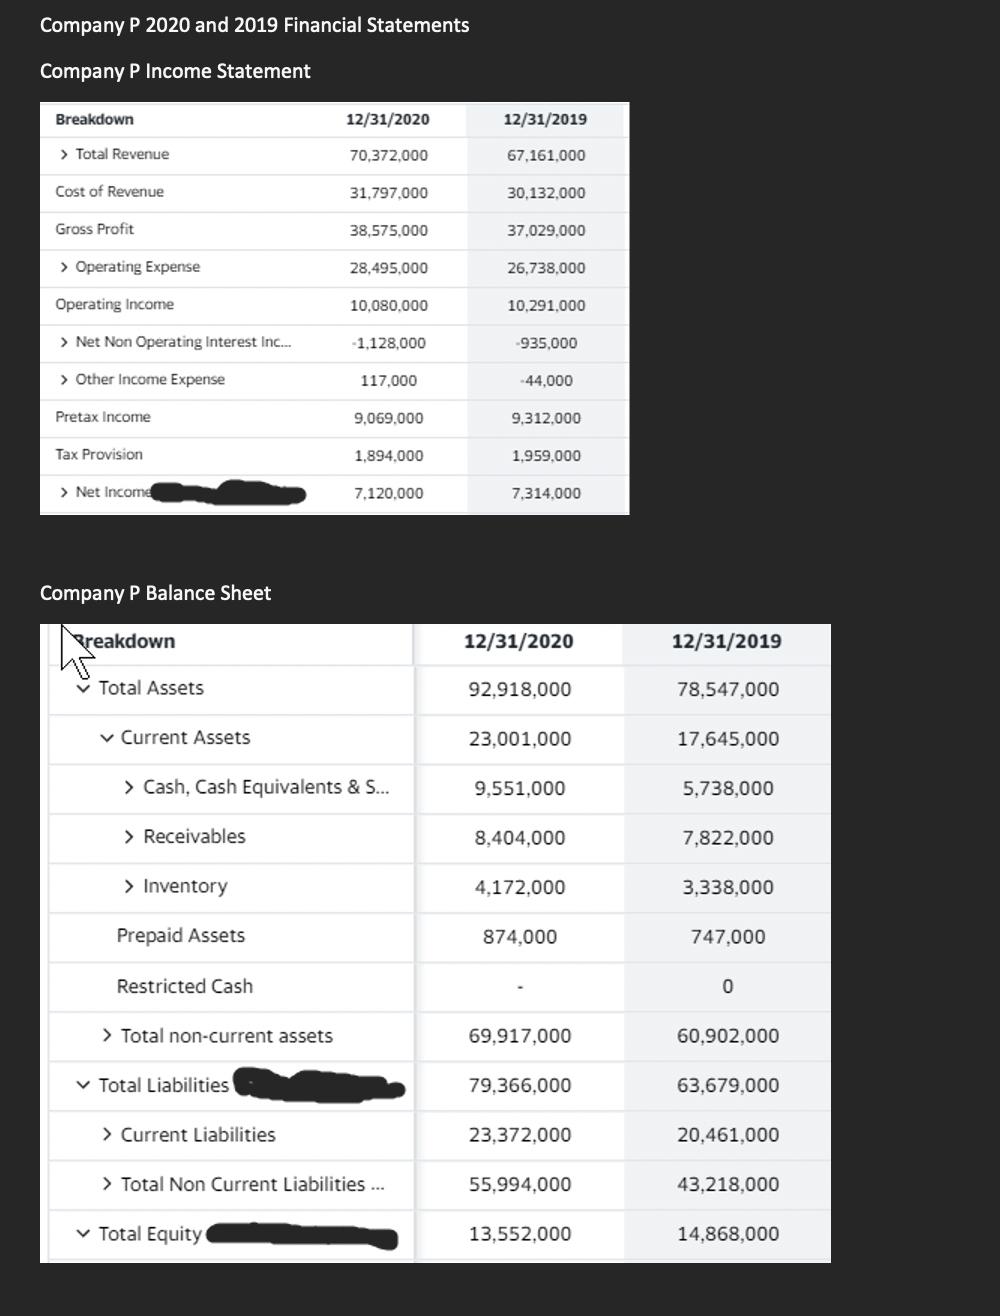
As you move into your career, you will have a 401K and investments that requires knowledge of investing and analyzing financial statements. For this assignment, you will analyze two competitor companies; Company P and Company K using the tools learned in Week 11 module. Instructions: Following the requirements below, please complete a report showing your findings. The report must be completed in Word or Excel. Handwritten copies will not be accepted! Requirements: 1. For Company P and Company K please complete the following: a. Perform Horizontal Analysis for each line item on Company P and Company K Income Statement. 30 points b. Perform Vertical Analysis for 2020 Income Statement for Company P and Company K. It is not necessary to complete Vertical Analysis for 2019. 20 points c. After completing requirements (a) and (b) please answer the following questions. 15 points i. Which company had the higher increase in total revenue from 2019 to 2020? ii. Which company had the higher increase in net income from 2019 to 2020? points. iii. Cost of Revenue (COGS) is what percentage of total revenue for Company K? iv. Cost of Revenue (COGS) is what percentage of total revenue for Company P? 2. Ratios. The following Ratios MUST BE CALCULATED for Company P and Company K for the year 2020. Please show the formula. a. Current Ratio. 10 points b. Inventory Turn-over. 10 points c. Gross Profit Percentage. 10 points d. After completing requirement a, b and c (above) please answer the following questions. i. Based on the Ratios for each company 1. Which company had the higher Gross Profit Percentage? 5 points. 2. How many days does Company P sell through their inventory? 5 points. 3. How many days does Company K sell through their inventory? 5 points. 4. Based on the answers in questions 2 and 3, which company is selling through their inventory quicker? 5 points. ii. Which company has the "best" current ratio? (Please refer to your notes) 5 points. Company K 2020 and 2019 Financial Statements Income Statement Breakdown > Total Revenue Cost of Revenue Gross Profit > Operating Expense Operating Income > Net Non Operating Interest Inc... > Other Income Expense Pretax Income Tax Provision > Net Income Common Stockhold... Company K Balance Sheet Breakdown ✓ Total Assets ✓ Current Assets > Cash, Cash Equivalents & S... > Receivables > Inventory Prepaid Assets > Total non-current assets ✓ Total Liabilities Net Minority Int... > Current Liabilities > Total Non Current Liabilities... >Total Equity 12/31/2020 33,014,000 13,433,000 19,581,000 9,757,000 9,824,000 -1,067,000 992,000 9,749,000 1,981,000 7,747,000 12/31/2020 87,296,000 19,240,000 10,914,000 3,144,000 3,266,000 1,916,000 68,056,000 66,012,000 14,601,000 51,411,000 21,284,000 12/31/2019 37,266,000 14,619,000 22,647,000 12,114,000 10,533,000 -383,000 636,000 10,786,000 1,801,000 8,920,000 12/31/2019 86,381,000 20,411,000 11,175,000 3,971,000 3,379,000 1,886,000 65,970,000 65,283,000 26,973,000 38,310,000 21,098,000 Company P 2020 and 2019 Financial Statements Company P Income Statement Breakdown > Total Revenue Cost of Revenue Gross Profit > Operating Expense Operating Income > Net Non Operating Interest Inc... > Other Income Expense Pretax Income Tax Provision > Net Income Company P Balance Sheet reakdown Total Assets ✓ Current Assets > Receivables > Inventory Prepaid Assets Restricted Cash > Total non-current assets ✓ Total Liabilities > Current Liabilities 12/31/2020 70,372,000 ✓ Total Equity 31,797,000 38,575,000 > Cash, Cash Equivalents & S... 28,495,000 10,080,000 -1,128.000 117,000 9,069,000 1,894,000 7,120,000 > Total Non Current Liabilities... 12/31/2019 67,161,000 30,132,000 37,029,000 26,738,000 10,291,000 -935,000 -44,000 9,312,000 1,959,000 7,314,000 12/31/2020 92,918,000 23,001,000 9,551,000 8,404,000 4,172,000 874,000 69,917,000 79,366,000 23,372,000 55,994,000 13,552,000 12/31/2019 78,547,000 17,645,000 5,738,000 7,822,000 3,338,000 747,000 0 60,902,000 63,679,000 20,461,000 43,218,000 14,868,000 As you move into your career, you will have a 401K and investments that requires knowledge of investing and analyzing financial statements. For this assignment, you will analyze two competitor companies; Company P and Company K using the tools learned in Week 11 module. Instructions: Following the requirements below, please complete a report showing your findings. The report must be completed in Word or Excel. Handwritten copies will not be accepted! Requirements: 1. For Company P and Company K please complete the following: a. Perform Horizontal Analysis for each line item on Company P and Company K Income Statement. 30 points b. Perform Vertical Analysis for 2020 Income Statement for Company P and Company K. It is not necessary to complete Vertical Analysis for 2019. 20 points c. After completing requirements (a) and (b) please answer the following questions. 15 points i. Which company had the higher increase in total revenue from 2019 to 2020? ii. Which company had the higher increase in net income from 2019 to 2020? points. iii. Cost of Revenue (COGS) is what percentage of total revenue for Company K? iv. Cost of Revenue (COGS) is what percentage of total revenue for Company P? 2. Ratios. The following Ratios MUST BE CALCULATED for Company P and Company K for the year 2020. Please show the formula. a. Current Ratio. 10 points b. Inventory Turn-over. 10 points c. Gross Profit Percentage. 10 points d. After completing requirement a, b and c (above) please answer the following questions. i. Based on the Ratios for each company 1. Which company had the higher Gross Profit Percentage? 5 points. 2. How many days does Company P sell through their inventory? 5 points. 3. How many days does Company K sell through their inventory? 5 points. 4. Based on the answers in questions 2 and 3, which company is selling through their inventory quicker? 5 points. ii. Which company has the "best" current ratio? (Please refer to your notes) 5 points. Company K 2020 and 2019 Financial Statements Income Statement Breakdown > Total Revenue Cost of Revenue Gross Profit > Operating Expense Operating Income > Net Non Operating Interest Inc... > Other Income Expense Pretax Income Tax Provision > Net Income Common Stockhold... Company K Balance Sheet Breakdown ✓ Total Assets ✓ Current Assets > Cash, Cash Equivalents & S... > Receivables > Inventory Prepaid Assets > Total non-current assets ✓ Total Liabilities Net Minority Int... > Current Liabilities > Total Non Current Liabilities... >Total Equity 12/31/2020 33,014,000 13,433,000 19,581,000 9,757,000 9,824,000 -1,067,000 992,000 9,749,000 1,981,000 7,747,000 12/31/2020 87,296,000 19,240,000 10,914,000 3,144,000 3,266,000 1,916,000 68,056,000 66,012,000 14,601,000 51,411,000 21,284,000 12/31/2019 37,266,000 14,619,000 22,647,000 12,114,000 10,533,000 -383,000 636,000 10,786,000 1,801,000 8,920,000 12/31/2019 86,381,000 20,411,000 11,175,000 3,971,000 3,379,000 1,886,000 65,970,000 65,283,000 26,973,000 38,310,000 21,098,000 Company P 2020 and 2019 Financial Statements Company P Income Statement Breakdown > Total Revenue Cost of Revenue Gross Profit > Operating Expense Operating Income > Net Non Operating Interest Inc... > Other Income Expense Pretax Income Tax Provision > Net Income Company P Balance Sheet reakdown Total Assets ✓ Current Assets > Receivables > Inventory Prepaid Assets Restricted Cash > Total non-current assets ✓ Total Liabilities > Current Liabilities 12/31/2020 70,372,000 ✓ Total Equity 31,797,000 38,575,000 > Cash, Cash Equivalents & S... 28,495,000 10,080,000 -1,128.000 117,000 9,069,000 1,894,000 7,120,000 > Total Non Current Liabilities... 12/31/2019 67,161,000 30,132,000 37,029,000 26,738,000 10,291,000 -935,000 -44,000 9,312,000 1,959,000 7,314,000 12/31/2020 92,918,000 23,001,000 9,551,000 8,404,000 4,172,000 874,000 69,917,000 79,366,000 23,372,000 55,994,000 13,552,000 12/31/2019 78,547,000 17,645,000 5,738,000 7,822,000 3,338,000 747,000 0 60,902,000 63,679,000 20,461,000 43,218,000 14,868,000
Expert Answer:
Answer rating: 100% (QA)
Horizontal Analysis Company P 12312020 12312019 Total Revenue 70372000 67161000 Percentage Change 48 Cost of Revenue 31797000 30132000 Percentage Change 56 Gross Profit 38575000 37029000 Percentage Ch... View the full answer

Related Book For 

Managing Information Technology
ISBN: 978-0132146326
7th Edition
Authors: Carol Brown, Daniel DeHayes, Jeffrey Hoffer, Wainright Marti
Posted Date:
Students also viewed these finance questions
-
It is sometimes necessary to prepare isotopically labeled samples of organic substances for probing biological transformations and reaction mechanisms. Various sources of the radioactive mass-14...
-
It is not necessary to postulate the impossibility of accelerating an object to speed c. It follows as a consequence of the relativistic form of energy. Explain.
-
In petroleum processing plants, it is often necessary to pump highly viscous liquids such as asphalt through pipes. In order to keep pumping costs within reason, the pipelines are electrically heated...
-
A total weighted score of in an External Factor Evaluation (EFE) Matrix indicates that an organization is responding in an outstanding way to existing opportunities and threats in its industry. Oa....
-
Analyze the attached data and develop a model that predicts math scores from other scores. Use regression analysis in excel and summarize what the different statistics of the summary output mean.
-
Rainwater flows through the galvanized iron downspout shown in Fig. P8.106 at a rate of \(0.006 \mathrm{~m}^{3} / \mathrm{s}\). Determine the size of the downspout cross section if it is a rectangle...
-
Propane is pyrolyzed by the following two independent gaseous reactions: \[ \begin{aligned} & \mathrm{C}_{3} \mathrm{H}_{8} ightarrow \mathrm{C}_{3} \mathrm{H}_{6}+\mathrm{H}_{2} \\ & \mathrm{C}_{3}...
-
The U.S. Department of Transportation (DOT) is planning to build a new interstate to run from Detroit, Michigan, to Charleston, South Carolina. Several different routes have been proposed. They are...
-
c. Consider Q=B C, Q2=B C, q = C C, and x=5.0 cm in the figure of right triangle: I. Draw the Free body diagram of electric forces at point of interest (q location) on your working paper by using F...
-
Solve the structures in Figures P5-16 through P5-18 by using substructuring. Figure P5-16 (Substructure the truss at nodes 3 and 4) Figure P5-17 (Substructure the beam at node 3) Figure P5-18...
-
Write a short paper on Pak-US Relation in the Post 911 Era 2001-2020). n
-
5. Grace chooses a camel to ride on a carousel. The camel is located 9m from the centre of the carousel. If the carousel turns through an angle of determine the length of the are travelled by the...
-
How do ecological interactions, such as predation, competition, and mutualism, influence population dynamics and community structure in terrestrial and aquatic ecosystems ?
-
What are the molecular mechanisms underlying the process of cellular differentiation in multicellular organisms ?
-
If u(x) = x + 3 and v(x) = x - 9. For which value(s) of x is y = u(x) undefined?
-
How do cells communicate through gap junctions and adherens junctions? What roles do cadherins and integrins play in maintaining tissue structure and cell adhesion ?
-
Prepare the valuation entries in the general journal and partnership. You do not need to show any entries regarding the valuation of goodwill. Total assets EQUITY AND LIABILITIES Capital & Reserves...
-
Starr Co. had sales revenue of $540,000 in 2014. Other items recorded during the year were: Cost of goods sold ..................................................... $330,000 Salaries and wages...
-
What is meant by the term multichannel capability?
-
1. What are the IT support needs for patient referrals to a specialist or another medical facility, and does this differ for routine versus provided by an MMC versus emergency care? 2. Define network...
-
In this chapter, payroll and order entry were used as examples of transaction processing systems. Another example with which all of us are somewhat familiar is the check-processing system employed by...
-
The following frequency distribution presents the amounts, in dollars, spent for Valentines Day gifts in a survey of 123 U.S. adults. a. Approximate the mean amount spent on Valentines Day gifts. b....
-
The personal income per capita of a state is the total income of all adults in the state, divided by the number of adults. The following table presents the personal income per capita (in thousands of...
-
The following frequency distribution presents the number of U.S. adults (in thousands) ages 25 to 74 who have earned a Bachelors degree in a recent year. a. Approximate the mean age. b. If the...

Study smarter with the SolutionInn App