

The data in the following table represent individual observations on molecular weight taken hourly from a chemical
Question:
The data in the following table represent individual observations on molecular weight taken hourly from a chemical process.
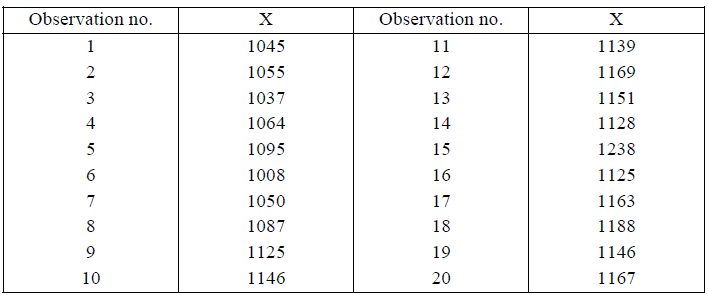
a)?Set up a tabular CUSUM for the mean of this process. Design the CUSUM chart using the standardized values h = 4.77 and k = 0.5. Interpret this chart.b)?Is the estimate of ? used in part (a) of this problem reasonable?c)?Set up an EWMA control chart using ? = 0.2 and L = 3 for this process. Interpret theresults.
A machine is used to fill cans with an energy drink. A single sample can is selected every hour and the weight of the can is obtained. Since the filling process is automated, it has very stable variability, and long-term experience indicates that ? = 0.05 oz. The individual observations for 24 hours of operation are shown in the following table.
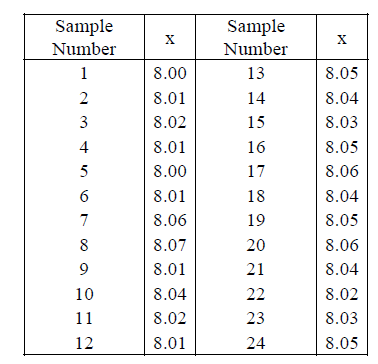
a. Assuming that the process target is 8.02 oz, set up a tabular CUSUM chart for this process. Design the chart using the standardized values ? = 4.77 and ? = 0.5. Give the formulas you would use to calculate the upper and lower CUSUMs. Also, use Excel to plot the relevant charts.
b. Does the value of ? = 0.05 seem reasonable for this process?
c. Rework part (a) using the standardized CUSUM and parameters of ? = 8.01 and ? = 0.25. Compare the results with those obtained previously in part (a)
Expert Answer:
Design the CUSUM Chart corare Cumulative Value NonZero at i C Max 0 x o K C c ... View the full answer


