Answered step by step
Verified Expert Solution
Question
1 Approved Answer
Ask a home buyer to describe their dream house, and they probably won't begin with the height of the basement ceiling or the proximity

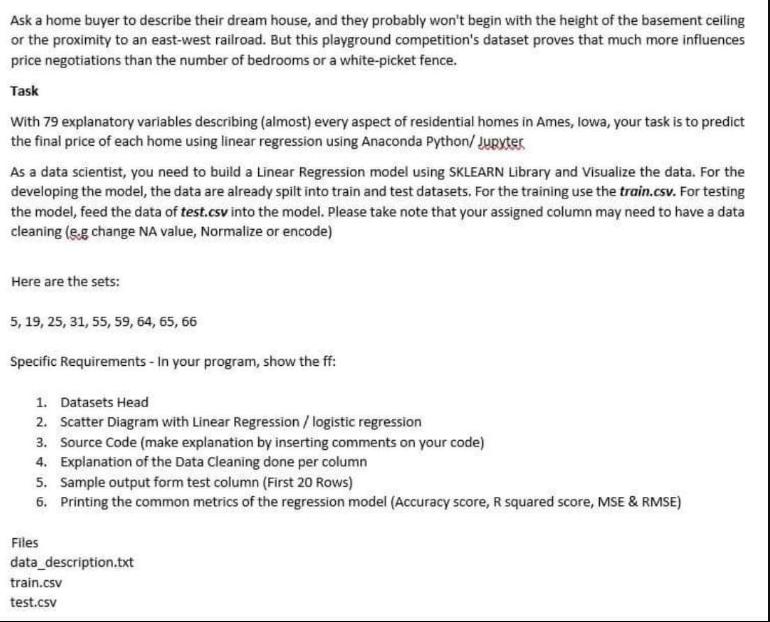
Ask a home buyer to describe their dream house, and they probably won't begin with the height of the basement ceiling or the proximity to an east-west railroad. But this playground competition's dataset proves that much more influences price negotiations than the number of bedrooms or a white-picket fence. Task With 79 explanatory variables describing (almost) every aspect of residential homes in Ames, lowa, your task is to predict the final price of each home using linear regression using Anaconda Python/Juryter As a data scientist, you need to build a Linear Regression model using SKLEARN Library and Visualize the data. For the developing the model, the data are already spilt into train and test datasets. For the training use the train.csv. For testing the model, feed the data of test.csv into the model. Please take note that your assigned column may need to have a data cleaning (e.g change NA value, Normalize or encode) Here are the sets: 5, 19, 25, 31, 55, 59, 64, 65, 66 Specific Requirements - In your program, show the ff: 1. Datasets Head 2. Scatter Diagram with Linear Regression / logistic regression 3. Source Code (make explanation by inserting comments on your code) 4. Explanation of the Data Cleaning done per column 5. Sample output form test column (First 20 Rows) 6. Printing the common metrics of the regression model (Accuracy score, R squared score, MSE & RMSE) Files data_description.txt train.csv test.csv Ask a home buyer to describe their dream house, and they probably won't begin with the height of the basement ceiling or the proximity to an east-west railroad. But this playground competition's dataset proves that much more influences price negotiations than the number of bedrooms or a white-picket fence. Task With 79 explanatory variables describing (almost) every aspect of residential homes in Ames, lowa, your task is to predict the final price of each home using linear regression using Anaconda Python/Juryter As a data scientist, you need to build a Linear Regression model using SKLEARN Library and Visualize the data. For the developing the model, the data are already spilt into train and test datasets. For the training use the train.csv. For testing the model, feed the data of test.csv into the model. Please take note that your assigned column may need to have a data cleaning (e.g change NA value, Normalize or encode) Here are the sets: 5, 19, 25, 31, 55, 59, 64, 65, 66 Specific Requirements - In your program, show the ff: 1. Datasets Head 2. Scatter Diagram with Linear Regression / logistic regression 3. Source Code (make explanation by inserting comments on your code) 4. Explanation of the Data Cleaning done per column 5. Sample output form test column (First 20 Rows) 6. Printing the common metrics of the regression model (Accuracy score, R squared score, MSE & RMSE) Files data description.txt train.csv test.csv
Step by Step Solution
★★★★★
3.42 Rating (168 Votes )
There are 3 Steps involved in it
Step: 1
Lets break down the task into steps and work on each one 1 Load the Data and Explore Well begin by loading the necessary libraries and examining the datasets to understand the structure and features p...
Get Instant Access to Expert-Tailored Solutions
See step-by-step solutions with expert insights and AI powered tools for academic success
Step: 2

Step: 3

Ace Your Homework with AI
Get the answers you need in no time with our AI-driven, step-by-step assistance
Get Started


