

Assume that thermometer readings are normally distributed with a mean of 0C and a standard deviation...
Fantastic news! We've Found the answer you've been seeking!
Question:
Transcribed Image Text:
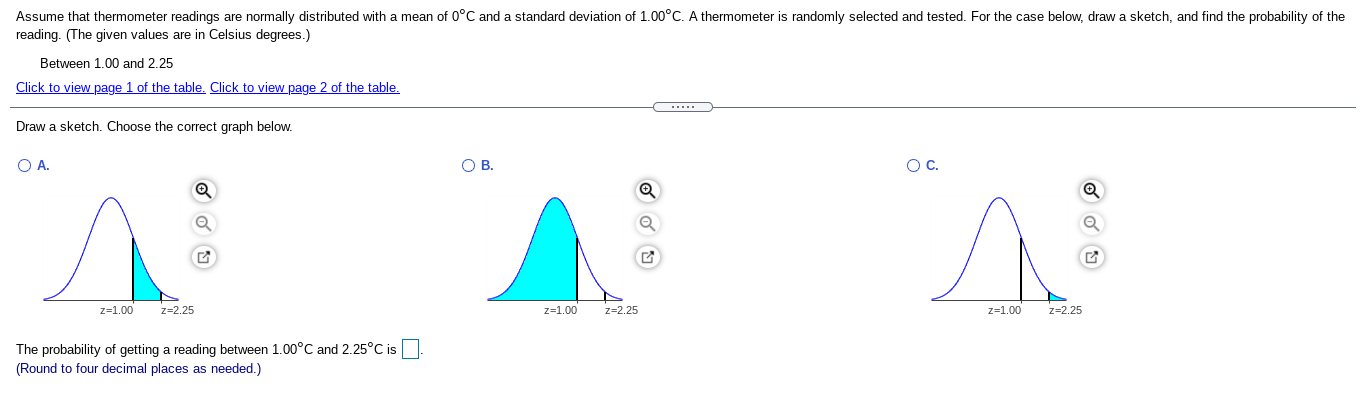
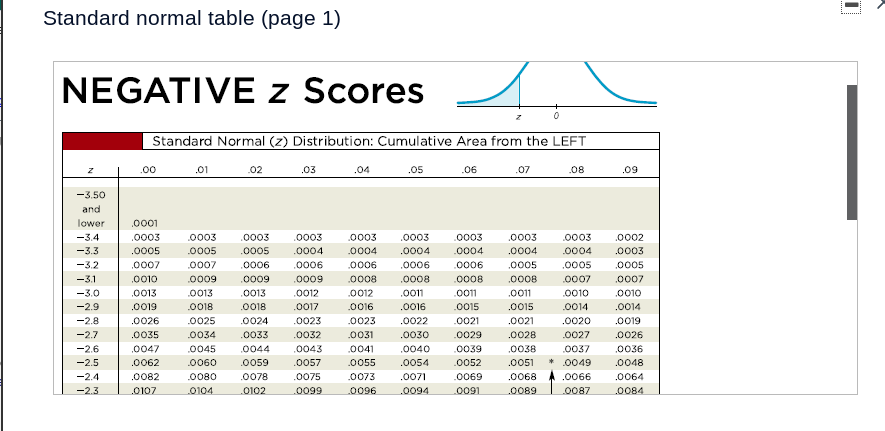
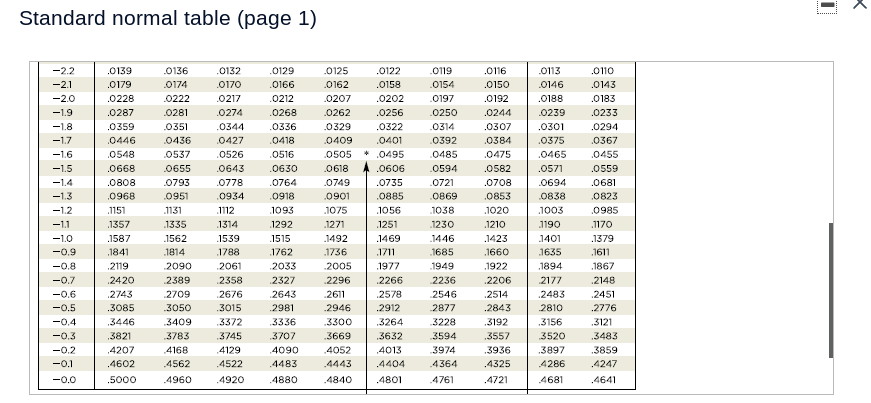
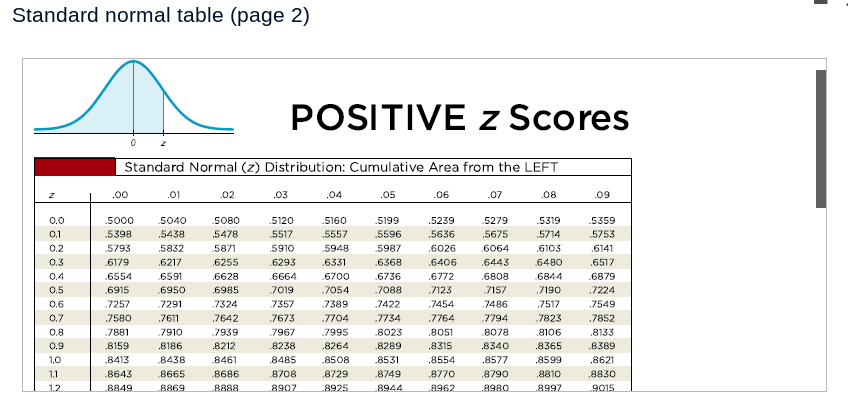
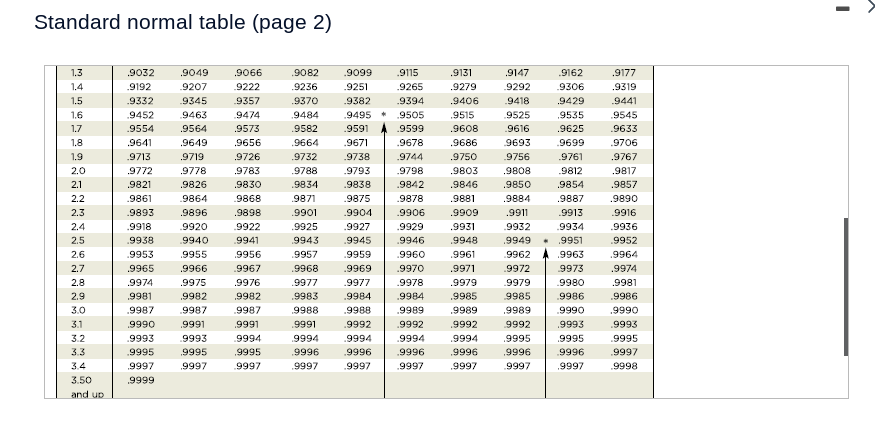
Assume that thermometer readings are normally distributed with a mean of 0C and a standard deviation of 1.00C. A thermometer is randomly selected and tested. For the case below, draw a sketch, and find the probability of the reading. (The given values are in Celsius degrees.) Between 1.00 and 2.25 Click to view page 1 of the table. Click to view page 2 of the table. Draw a sketch. Choose the correct graph below. A. z=1.00 z=2.25 The probability of getting a reading between 1.00C and 2.25C is (Round to four decimal places as needed.) . C. Q z=1.00 z=2.25 G ^ z=1.00 z=2.25 G Standard normal table (page 1) NEGATIVE Z Scores Standard Normal (z) Distribution: Cumulative Area from the LEFT z .00 .01 .02 .03 .04 .05 .06 .07 .08 .09 -3.50 and lower .0001 -3.4 .0003 .0003 .0003 .0003 -3.3 .0005 .0005 .0005 .0004 .0003 .0004 .0003 .0003 .0003 .0003 .0002 .0004 .0004 .0004 .0004 .0003 -3.2 .0007 .0007 .0006 .0006 .0006 .0006 .0006 .0005 .0005 .0005 -3.1 .0010 .0009 .0009 .0009 .0008 .0008 .0008 .0008 .0007 .0007 -3.0 .0013 .0013 .0013 .0012 .0012 .0011 .0011 .0011 .0010 .0010 -2.9 .0019 .0018 .0018 .0017 .0016 .0016 .0015 .0015 .0014 .0014 -2.8 .0026 .0025 .0024 .0023 .0023 .0022 .0021 .0021 .0020 .0019 -2.7 .0035 .0034 .0033 .0032 .0031 .0030 .0029 .0028 .0027 .0026 -2.6 .0047 .0045 .0044 .0043 .0041 .0040 .0039 .0038 .0037 .0036 -2.5 .0062 .0060 .0059 .0057 .0055 .0054 .0052 .0051 * .0049 .0048 -2.4 .0082 .0080 .0078 .0075 .0073 .0071 .0069 .0068 .0066 .0064 -2.3 0107 0104 .0102 .0099 0096 .0094 .0091 .0089 .0087 .0084 Standard normal table (page 1) I x -2.2 .0139 .0136 .0132 .0129 .0125 .0122 .0119 .0116 .0113 .0110 -2.1 .0179 .0174 .0170 .0166 .0162 .0158 0154 .0150 0146 .0143 -2.0 .0228 .0222 .0217 .0212 .0207 .0202 .0197 .0192 .0188 .0183 -1.9 .0287 .0281 .0274 .0268 .0262 .0256 .0250 .0244 .0239 .0233 -1.8 .0359 .0351 .0344 .0336 .0329 .0322 .0314 .0307 .0301 .0294 -1.7 .0446 .0436 .0427 .0418 .0409 .0401 .0392 .0384 .0375 .0367 -1.6 .0548 .0537 .0526 .0516 .0505 * .0495 .0485 .0475 .0465 .0455 -1.5 .0668 .0655 .0643 .0630 .0618 .0606 .0594 .0582 .0571 .0559 -1.4 .0808 .0793 .0778 .0764 .0749 .0735 .0721 .0708 .0694 .0681 -1.3 .0968 .0951 .0934 .0918 .0901 .0885 .0869 .0853 .0838 .0823 -1.2 1151 1131 1112 1093 .1075 1056 1038 1020 1003 .0985 -1.1 .1357 1335 1314 1292 .1271 1251 .1230 1210 1190 .1170 -1.0 .1587 .1562 1539 1515 1492 .1469 1446 1423 1401 1379 -0.9 1841 1814 1788 1762 .1736 1711 1685 .1660 1635 .1611 -0.8 .2119 2090 .2061 .2033 2005 1977 1949 .1922 1894 .1867 -0.7 2420 2389 .2358 .2327 .2296 .2266 2236 .2206 2177 .2148 -0.6 .2743 2709 .2676 .2643 2611 2578 2546 .2514 .2483 .2451 -0.5 .3085 .3050 3015 .2981 .2946 .2912 2877 .2843 2810 .2776 -0.4 .3446 3409 .3372 .3336 .3300 .3264 3228 .3192 .3156 .3121 -0.3 .3821 .3783 .3745 .3707 .3669 .3632 3594 .3557 3520 .3483 -0.2 .4207 4168 .4129 4090 .4052 .4013 3974 .3936 .3897 .3859 -0.1 .4602 .4562 .4522 .4483 .4443 .4404 .4364 .4325 4286 .4247 -0.0 .5000 .4960 .4920 .4880 .4840 .4801 .4761 .4721 4681 .4641 Standard normal table (page 2) POSITIVE z Scores Standard Normal (z) Distribution: Cumulative Area from the LEFT N .00 .01 .02 .03 .04 .05 .06 .07 .08 .09 0.0 .5000 5040 5080 .5120 .5160 .5199 .5239 5279 .5319 .5359 0.1 = .5398 .5438 .5478 .5517 .5557 .5596 .5636 .5675 .5714 .5753 0.2 .5793 .5832 .5871 5910 .5948 .5987 .6026 .6064 .6103 .6141 0.3 .6179 .6217 .6255 .6293 .6331 .6368 .6406 .6443 .6480 .6517 0.4 .6554 .6591 .6628 .6664 .6700 .6736 .6772 .6808 .6844 .6879 0.5 .6915 .6950 .6985 .7019 .7054 .7088 .7123 .7157 .7190 .7224 0.6 .7257 .7291 .7324 .7357 .7389 .7422 .7454 .7486 .7517 .7549 0.7 .7580 .7611 .7642 .7673 .7704 .7734 .7764 .7794 .7823 .7852 0.8 .7881 7910 .7939 .7967 .7995 .8023 .8051 .8078 .8106 .8133 0.9 .8159 .8186 .8212 .8238 .8264 .8289 .8315 .8340 .8365 .8389 1.0 .8413 8438 8461 .8485 .8508 .8531 .8554 .8577 .8599 .8621 1.1 .8643 .8665 .8686 .8708 .8729 .8749 .8770 .8790 .8810 .8830 1.2 8849 8869 8888 8907 8925 8944 .8962 8980 .8997 9015 Standard normal table (page 2) MASSTR222222222223 3 3 3 3 NNNN 1.3 .9032 .9049 .9066 .9082 .9099 .9115 .9131 .9147 .9162 .9177 1.4 .9192 .9207 .9222 .9236 .9251 .9265 .9279 .9292 .9306 .9319 1.5 .9332 9345 .9357 .9370 .9382 .9394 .9406 .9418 .9429 .9441 1.6 .9452 9463 .9474 9484 .9495 .9505 .9515 9525 .9535 .9545 1.7 .9554 .9564 .9573 .9582 .9591 .9599 .9608 .9616 .9625 .9633 1.8 .9641 .9649 .9656 .9664 .9671 .9678 .9686 9693 .9699 .9706 1.9 .9713 .9719 .9726 .9732 .9738 .9744 .9750 .9756 .9761 .9767 2.0 .9772 .9778 .9783 .9788 .9793 .9798 .9803 .9808 .9812 .9817 2.1 .9821 .9826 .9830 .9834 .9838 .9842 .9846 .9850 .9854 .9857 .9861 .9864 .9868 .9871 .9875 .9878 .9881 .9884 .9887 .9890 .9893 .9896 .9898 .9901 .9904 .9906 .9909 .9911 .9913 .9916 2.4 .9918 .9920 .9922 .9925 .9927 .9929 .9931 .9932 .9934 .9936 2.5 .9938 .9940 .9941 9943 .9945 .9946 .9948 .9949 .9951 .9952 2.6 .9953 .9955 .9956 .9957 .9959 .9960 .9961 .9962 .9963 .9964 2.7 .9965 .9966 .9967 .9968 .9969 .9970 .9971 .9972 9973 .9974 2.8 .9974 .9975 .9976 .9977 .9977 .9978 .9979 9979 .9980 .9981 2.9 .9981 .9982 .9982 .9983 .9984 .9984 .9985 9985 .9986 .9986 3.0 .9987 .9987 .9987 .9988 .9988 .9989 .9989 .9989 .9990 .9990 3.1 .9990 .9991 .9991 .9991 .9992 .9992 .9992 9992 .9993 .9993 3.2 .9993 .9993 .9994 .9994 .9994 .9994 .9994 .9995 .9995 .9995 3.3 .9995 .9995 .9995 .9996 .9996 .9996 .9996 .9996 .9996 .9997 3.4 9997 .9997 .9997 .9997 .9997 .9997 .9997 .9997 .9997 .9998 3.50 .9999 and up Assume that thermometer readings are normally distributed with a mean of 0C and a standard deviation of 1.00C. A thermometer is randomly selected and tested. For the case below, draw a sketch, and find the probability of the reading. (The given values are in Celsius degrees.) Between 1.00 and 2.25 Click to view page 1 of the table. Click to view page 2 of the table. Draw a sketch. Choose the correct graph below. A. z=1.00 z=2.25 The probability of getting a reading between 1.00C and 2.25C is (Round to four decimal places as needed.) . C. Q z=1.00 z=2.25 G ^ z=1.00 z=2.25 G Standard normal table (page 1) NEGATIVE Z Scores Standard Normal (z) Distribution: Cumulative Area from the LEFT z .00 .01 .02 .03 .04 .05 .06 .07 .08 .09 -3.50 and lower .0001 -3.4 .0003 .0003 .0003 .0003 -3.3 .0005 .0005 .0005 .0004 .0003 .0004 .0003 .0003 .0003 .0003 .0002 .0004 .0004 .0004 .0004 .0003 -3.2 .0007 .0007 .0006 .0006 .0006 .0006 .0006 .0005 .0005 .0005 -3.1 .0010 .0009 .0009 .0009 .0008 .0008 .0008 .0008 .0007 .0007 -3.0 .0013 .0013 .0013 .0012 .0012 .0011 .0011 .0011 .0010 .0010 -2.9 .0019 .0018 .0018 .0017 .0016 .0016 .0015 .0015 .0014 .0014 -2.8 .0026 .0025 .0024 .0023 .0023 .0022 .0021 .0021 .0020 .0019 -2.7 .0035 .0034 .0033 .0032 .0031 .0030 .0029 .0028 .0027 .0026 -2.6 .0047 .0045 .0044 .0043 .0041 .0040 .0039 .0038 .0037 .0036 -2.5 .0062 .0060 .0059 .0057 .0055 .0054 .0052 .0051 * .0049 .0048 -2.4 .0082 .0080 .0078 .0075 .0073 .0071 .0069 .0068 .0066 .0064 -2.3 0107 0104 .0102 .0099 0096 .0094 .0091 .0089 .0087 .0084 Standard normal table (page 1) I x -2.2 .0139 .0136 .0132 .0129 .0125 .0122 .0119 .0116 .0113 .0110 -2.1 .0179 .0174 .0170 .0166 .0162 .0158 0154 .0150 0146 .0143 -2.0 .0228 .0222 .0217 .0212 .0207 .0202 .0197 .0192 .0188 .0183 -1.9 .0287 .0281 .0274 .0268 .0262 .0256 .0250 .0244 .0239 .0233 -1.8 .0359 .0351 .0344 .0336 .0329 .0322 .0314 .0307 .0301 .0294 -1.7 .0446 .0436 .0427 .0418 .0409 .0401 .0392 .0384 .0375 .0367 -1.6 .0548 .0537 .0526 .0516 .0505 * .0495 .0485 .0475 .0465 .0455 -1.5 .0668 .0655 .0643 .0630 .0618 .0606 .0594 .0582 .0571 .0559 -1.4 .0808 .0793 .0778 .0764 .0749 .0735 .0721 .0708 .0694 .0681 -1.3 .0968 .0951 .0934 .0918 .0901 .0885 .0869 .0853 .0838 .0823 -1.2 1151 1131 1112 1093 .1075 1056 1038 1020 1003 .0985 -1.1 .1357 1335 1314 1292 .1271 1251 .1230 1210 1190 .1170 -1.0 .1587 .1562 1539 1515 1492 .1469 1446 1423 1401 1379 -0.9 1841 1814 1788 1762 .1736 1711 1685 .1660 1635 .1611 -0.8 .2119 2090 .2061 .2033 2005 1977 1949 .1922 1894 .1867 -0.7 2420 2389 .2358 .2327 .2296 .2266 2236 .2206 2177 .2148 -0.6 .2743 2709 .2676 .2643 2611 2578 2546 .2514 .2483 .2451 -0.5 .3085 .3050 3015 .2981 .2946 .2912 2877 .2843 2810 .2776 -0.4 .3446 3409 .3372 .3336 .3300 .3264 3228 .3192 .3156 .3121 -0.3 .3821 .3783 .3745 .3707 .3669 .3632 3594 .3557 3520 .3483 -0.2 .4207 4168 .4129 4090 .4052 .4013 3974 .3936 .3897 .3859 -0.1 .4602 .4562 .4522 .4483 .4443 .4404 .4364 .4325 4286 .4247 -0.0 .5000 .4960 .4920 .4880 .4840 .4801 .4761 .4721 4681 .4641 Standard normal table (page 2) POSITIVE z Scores Standard Normal (z) Distribution: Cumulative Area from the LEFT N .00 .01 .02 .03 .04 .05 .06 .07 .08 .09 0.0 .5000 5040 5080 .5120 .5160 .5199 .5239 5279 .5319 .5359 0.1 = .5398 .5438 .5478 .5517 .5557 .5596 .5636 .5675 .5714 .5753 0.2 .5793 .5832 .5871 5910 .5948 .5987 .6026 .6064 .6103 .6141 0.3 .6179 .6217 .6255 .6293 .6331 .6368 .6406 .6443 .6480 .6517 0.4 .6554 .6591 .6628 .6664 .6700 .6736 .6772 .6808 .6844 .6879 0.5 .6915 .6950 .6985 .7019 .7054 .7088 .7123 .7157 .7190 .7224 0.6 .7257 .7291 .7324 .7357 .7389 .7422 .7454 .7486 .7517 .7549 0.7 .7580 .7611 .7642 .7673 .7704 .7734 .7764 .7794 .7823 .7852 0.8 .7881 7910 .7939 .7967 .7995 .8023 .8051 .8078 .8106 .8133 0.9 .8159 .8186 .8212 .8238 .8264 .8289 .8315 .8340 .8365 .8389 1.0 .8413 8438 8461 .8485 .8508 .8531 .8554 .8577 .8599 .8621 1.1 .8643 .8665 .8686 .8708 .8729 .8749 .8770 .8790 .8810 .8830 1.2 8849 8869 8888 8907 8925 8944 .8962 8980 .8997 9015 Standard normal table (page 2) MASSTR222222222223 3 3 3 3 NNNN 1.3 .9032 .9049 .9066 .9082 .9099 .9115 .9131 .9147 .9162 .9177 1.4 .9192 .9207 .9222 .9236 .9251 .9265 .9279 .9292 .9306 .9319 1.5 .9332 9345 .9357 .9370 .9382 .9394 .9406 .9418 .9429 .9441 1.6 .9452 9463 .9474 9484 .9495 .9505 .9515 9525 .9535 .9545 1.7 .9554 .9564 .9573 .9582 .9591 .9599 .9608 .9616 .9625 .9633 1.8 .9641 .9649 .9656 .9664 .9671 .9678 .9686 9693 .9699 .9706 1.9 .9713 .9719 .9726 .9732 .9738 .9744 .9750 .9756 .9761 .9767 2.0 .9772 .9778 .9783 .9788 .9793 .9798 .9803 .9808 .9812 .9817 2.1 .9821 .9826 .9830 .9834 .9838 .9842 .9846 .9850 .9854 .9857 .9861 .9864 .9868 .9871 .9875 .9878 .9881 .9884 .9887 .9890 .9893 .9896 .9898 .9901 .9904 .9906 .9909 .9911 .9913 .9916 2.4 .9918 .9920 .9922 .9925 .9927 .9929 .9931 .9932 .9934 .9936 2.5 .9938 .9940 .9941 9943 .9945 .9946 .9948 .9949 .9951 .9952 2.6 .9953 .9955 .9956 .9957 .9959 .9960 .9961 .9962 .9963 .9964 2.7 .9965 .9966 .9967 .9968 .9969 .9970 .9971 .9972 9973 .9974 2.8 .9974 .9975 .9976 .9977 .9977 .9978 .9979 9979 .9980 .9981 2.9 .9981 .9982 .9982 .9983 .9984 .9984 .9985 9985 .9986 .9986 3.0 .9987 .9987 .9987 .9988 .9988 .9989 .9989 .9989 .9990 .9990 3.1 .9990 .9991 .9991 .9991 .9992 .9992 .9992 9992 .9993 .9993 3.2 .9993 .9993 .9994 .9994 .9994 .9994 .9994 .9995 .9995 .9995 3.3 .9995 .9995 .9995 .9996 .9996 .9996 .9996 .9996 .9996 .9997 3.4 9997 .9997 .9997 .9997 .9997 .9997 .9997 .9997 .9997 .9998 3.50 .9999 and up
Expert Answer:

Related Book For 

Posted Date:
Students also viewed these mathematics questions
-
Between - 1.00 and - 0.50 Assume that thermometer readings are normally distributed with a mean of 0C and a standard deviation of 1.00C. A thermometer is randomly selected and tested. In each case,...
-
Between - 3.00 and Assume that thermometer readings are normally distributed with a mean of 0C and a standard deviation of 1.00C. A thermometer is randomly selected and tested. In each case, draw a...
-
37) Because of inability to pay its debts, the Lou Gi Manufacturing Company has been forced into bankruptcy as of April 1, 20x7. The balance sheet on the date shows: Assets Cash Accounts Receivable...
-
Grewers Automotive Products Ltd. has requested that you determine whether the company's ability to pay its current liabilities and long-term debt has improved or deteriorated during 2014. To answer...
-
A long, closed cylindrical tank contains a diatomic gas that is maintained at a uniform temperature that can be varied. When you measure the speed of sound v in the gas as a function of the...
-
Compute the \(t\) value (do it manually, argh!) and write a conclusion as to whether there was a change in a group of families' satisfaction level (the higher the score, the more satisfied) with...
-
Connie Young, an architect, opened an office on October 1, 2019. During the month, she completed the following transactions connected with her professional practice: a. Transferred cash from a...
-
Explain the relationship between backup scheduling and achieving recovery point objectives (RPO) and recovery time objectives (RTO) in disaster recovery planning. How can backup scheduling policies...
-
1. Consider the problem of returning change to a customer requiring the smallest number of coins. a. Show that the greedy algorithm given below returns the smallest number of coins for the coin set...
-
Consider the following class definitions: class A: def ( self , par = 2 : print ( " / b a r ( ) " , end = " ) print ( par ) if par is not None else print ( 2 ) par = 2 class B ( A ) : def ( self ,...
-
Terms of Engagement3:32 minutes https://www.youtube.com/watch?v=O5-kI67mSAE Berrett-Koehler Publisherss Change Authors series focuses on four principles: widening the circle of involvement,...
-
LeadersAngle Gene Deszca Organisational Change14:59 minutes https://www.youtube.com/watch?v=n9lzudH-uJI Evaluate yourself on the core competencies mentioned in the video. What do you think that you...
-
Calculate the break-even level of output.
-
Determine an investment's payback period.
-
Compute rates of return.
-
Circling Ball Part A A ball of mass m is attached to a string of length L. It is being swung in a vertical circle with enough speed so that the string remains taut throughout the ball's motion....
-
Prove the following D,(cos x) = - sin x (Hint: Apply the identity cos(A + B) = cos A cos B sin A sin B)
-
If four of the test subjects are randomly selected without replacement, find the probability that they all had incorrect test results (either false positive or false negative). Is such an event...
-
Suppose that the results in the table were obtained by mailing a survey to 10,000 executives and recording the 1733 responses that were returned. What is this type of sampling called? Is this type of...
-
The following table lists (in thousands) the numbers of male and female higher education students for different years. (Projections are from the U.S. National Center for Education Statistics.)...
-
Derive Eqs. (13.113b) and (13.116b) for the Mathieu equation. Equation 13.113b and 13.116b:- a 11 + E 62 - 8 + (13.113b)
-
a. Nonlinearity in mass b. Nonlinearity in damping c. Linear equation d. Nonlinearity in spring \(\ddot{x}+c \dot{x}+k x=a x^{3}\)
-
The equation of motion of a simple pendulum subject to viscous damping can be expressed as \[\ddot{\theta}+c \dot{\theta}+\sin \theta=0\] If the initial conditions are \(\theta(0)=\theta_{0}\) and...

Study smarter with the SolutionInn App