

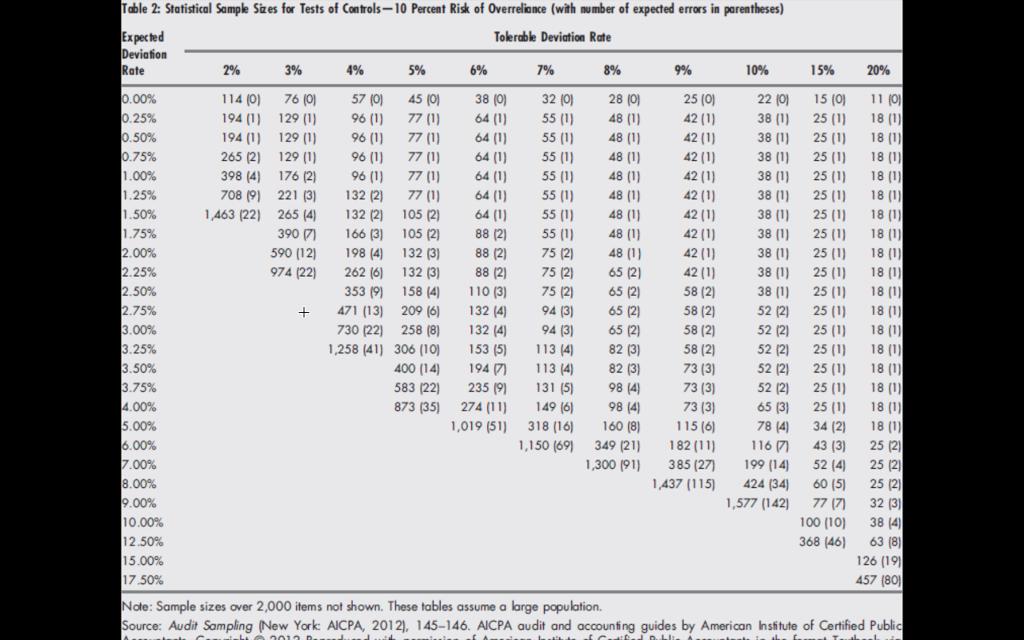
Tables 1 and 2 are used to aid the auditor in interpreting the results of control tests.
Question:
Tables 1 and 2 are used to aid the auditor in interpreting the results of control tests. Assume the tolerable deviation rate is 12%. For each item in the partially table below, enter the upper limit of deviations for that item. For those situations when no deviations are detected in the sample, the upper limit of deviations may be greater than zero. This is because the sample size is very low; so there is a strong possibility that even though the auditor detected no deviations in the sample of 20 items, there exist deviations that the auditor failed to detect.
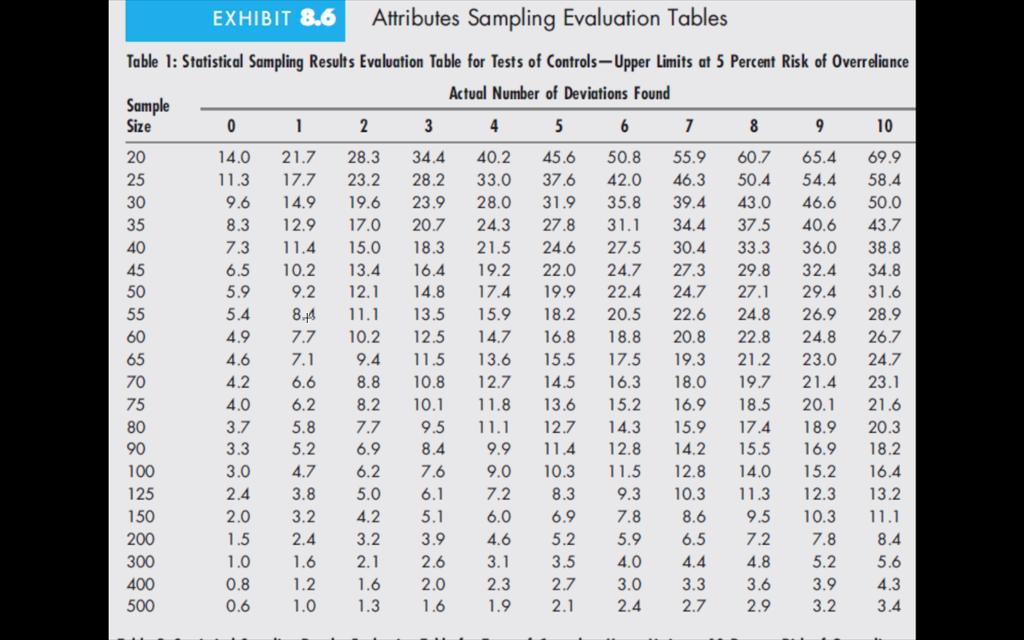
Sampling risk | Sample Size | Number of Deviations | Upper Limit of Deviations |
5% | 20 | 0 | % |
5% | 75 | 5 | % |
5% | 150 | 10 | % |
10% | 20 | 0 | % |
10% | 75 | 5 | % |
10% | 150 | 10 | % |
Expert Answer:
The results of attributes sampling at the tolerable deviation rate of 12 sho... View the full answer


Financial Accounting Information For Decisions
ISBN: 978-0324672701
6th Edition
Authors: Robert w Ingram, Thomas L Albright
