

The graph below depicts a firm with market power. In the graph, MC represents the firm's marginal
Fantastic news! We've Found the answer you've been seeking!
Question:
The graph below depicts a firm with market power. In the graph, MC represents the firm's marginal costs, ATC represents the average total costs, D represents demand, and MR represents marginal revenue.
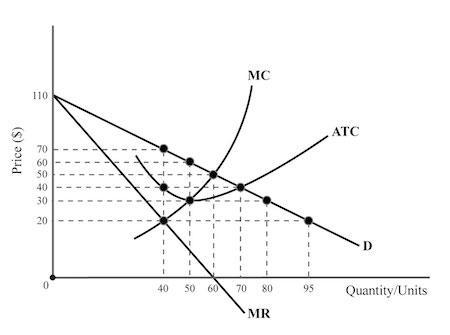
- At 60 units of output, how much would this profit-maximizing monopolist charge?
- How many units would it produce to maximize total revenue rather than total profit?
- What is the maximum quantity this firm can produce without incurring economic losses?
- Calculate the firm's profit at the profit-maximizing output and price.
- Why is this firm's marginal revenue curve below its demand curve? Explain.
Expert Answer:
Unfortunately without additional information about the monopolists cost structure we cannot definitively answer all the questions However we can provi... View the full answer

Related Book For 

Posted Date:
