

Attached is a list containing 22 of the most prevalent brands in the fashion industry in...
Fantastic news! We've Found the answer you've been seeking!
Question:
Transcribed Image Text:
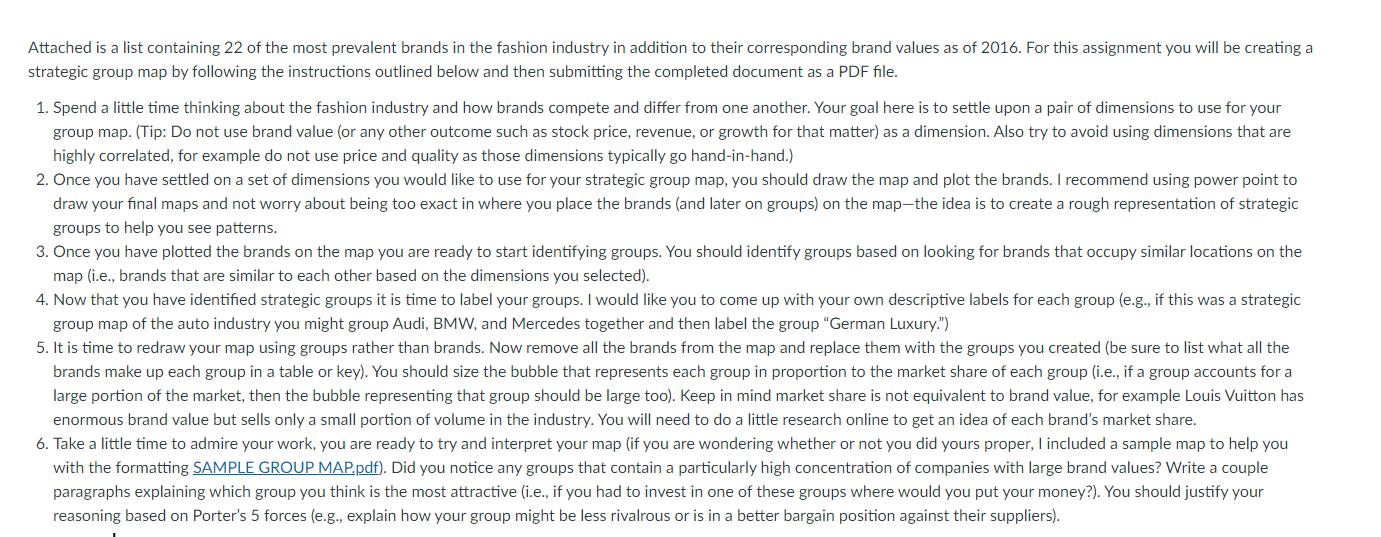
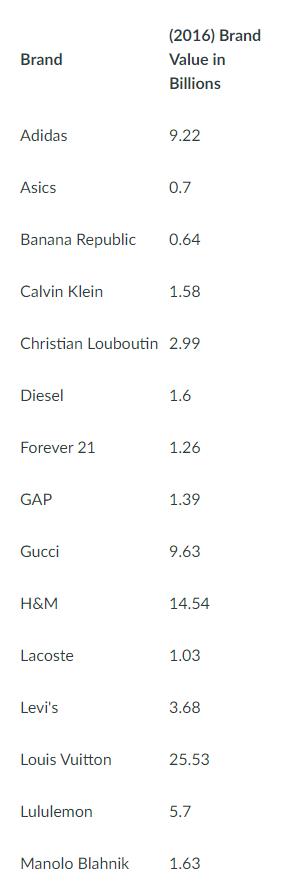
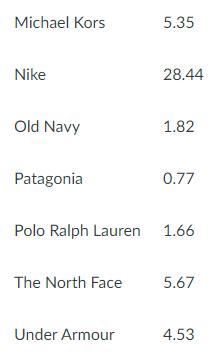
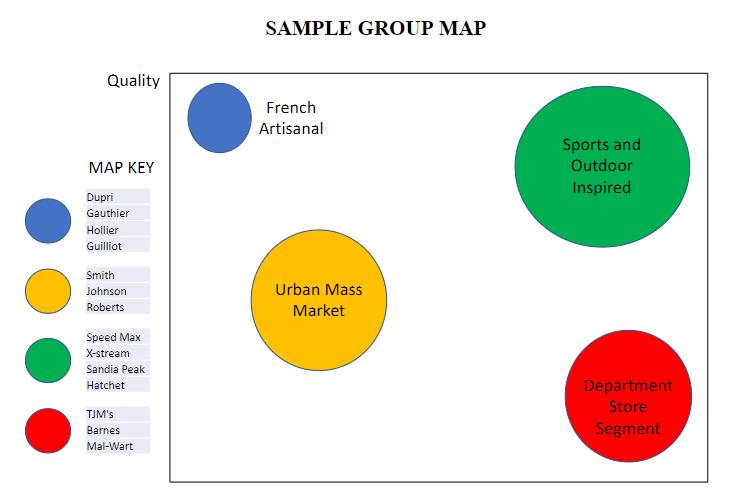
Attached is a list containing 22 of the most prevalent brands in the fashion industry in addition to their corresponding brand values as of 2016. For this assignment you will be creating a strategic group map by following the instructions outlined below and then submitting the completed document as a PDF file. 1. Spend a little time thinking about the fashion industry and how brands compete and differ from one another. Your goal here is to settle upon a pair of dimensions to use for your group map. (Tip: Do not use brand value (or any other outcome such as stock price, revenue, or growth for that matter) as a dimension. Also try to avoid using dimensions that are highly correlated, for example do not use price and quality as those dimensions typically go hand-in-hand.) 2. Once you have settled on a set of dimensions you would like to use for your strategic group map, you should draw the map and plot the brands. I recommend using power point to draw your final maps and not worry about being too exact in where you place the brands (and later on groups) on the map-the idea is to create a rough representation of strategic groups to help you see patterns. 3. Once you have plotted the brands on the map you are ready to start identifying groups. You should identify groups based on looking for brands that occupy similar locations on the map (i.e., brands that are similar to each other based on the dimensions you selected). 4. Now that you have identified strategic groups it is time to label your groups. I would like you to come up with your own descriptive labels for each group (e.g., if this was a strategic group map of the auto industry you might group Audi, BMW, and Mercedes together and then label the group "German Luxury.") 5. It is time to redraw your map using groups rather than brands. Now remove all the brands from the map and replace them with the groups you created (be sure to list what all the brands make up each group in a table or key). You should size the bubble that represents each group in proportion to the market share of each group (i.e., if a group accounts for a large portion of the market, then the bubble representing that group should be large too). Keep in mind market share is not equivalent to brand value, for example Louis Vuitton has enormous brand value but sells only a small portion of volume in the industry. You will need to do a little research online to get an idea of each brand's market share. 6. Take a little time to admire your work, you are ready to try and interpret your map (if you are wondering whether or not you did yours proper, I included a sample map to help you with the formatting SAMPLE GROUP MAP.pdf). Did you notice any groups that contain a particularly high concentration of companies with large brand values? Write a couple paragraphs explaining which group you think is the most attractive (i.e., if you had to invest in one of these groups where would you put your money?). You should justify your reasoning based on Porter's 5 forces (e.g., explain how your group might be less rivalrous or is in a better bargain position against their suppliers). Brand Adidas Asics Banana Republic Calvin Klein Diesel Forever 21 GAP Gucci Christian Louboutin 2.99 H&M Lacoste Levi's Louis Vuitton Lululemon (2016) Brand Value in Billions Manolo Blahnik 9.22 0.7 0.64 1.58 1.6 1.26 1.39 9.63 14.54 1.03 3.68 25.53 5.7 1.63 Michael Kors Nike Old Navy Patagonia The North Face 5.35 Under Armour 28.44 1.82 Polo Ralph Lauren 1.66 0.77 5.67 4.53 Quality MAP KEY Dupri Gauthier Hollier Guilliot Smith Johnson Roberts Speed Max X-stream Sandia Peak Hatchet TJM's Barnes Mal-Wart SAMPLE GROUP MAP French Artisanal Urban Mass Market Sports and Outdoor Inspired Department Store Segment Attached is a list containing 22 of the most prevalent brands in the fashion industry in addition to their corresponding brand values as of 2016. For this assignment you will be creating a strategic group map by following the instructions outlined below and then submitting the completed document as a PDF file. 1. Spend a little time thinking about the fashion industry and how brands compete and differ from one another. Your goal here is to settle upon a pair of dimensions to use for your group map. (Tip: Do not use brand value (or any other outcome such as stock price, revenue, or growth for that matter) as a dimension. Also try to avoid using dimensions that are highly correlated, for example do not use price and quality as those dimensions typically go hand-in-hand.) 2. Once you have settled on a set of dimensions you would like to use for your strategic group map, you should draw the map and plot the brands. I recommend using power point to draw your final maps and not worry about being too exact in where you place the brands (and later on groups) on the map-the idea is to create a rough representation of strategic groups to help you see patterns. 3. Once you have plotted the brands on the map you are ready to start identifying groups. You should identify groups based on looking for brands that occupy similar locations on the map (i.e., brands that are similar to each other based on the dimensions you selected). 4. Now that you have identified strategic groups it is time to label your groups. I would like you to come up with your own descriptive labels for each group (e.g., if this was a strategic group map of the auto industry you might group Audi, BMW, and Mercedes together and then label the group "German Luxury.") 5. It is time to redraw your map using groups rather than brands. Now remove all the brands from the map and replace them with the groups you created (be sure to list what all the brands make up each group in a table or key). You should size the bubble that represents each group in proportion to the market share of each group (i.e., if a group accounts for a large portion of the market, then the bubble representing that group should be large too). Keep in mind market share is not equivalent to brand value, for example Louis Vuitton has enormous brand value but sells only a small portion of volume in the industry. You will need to do a little research online to get an idea of each brand's market share. 6. Take a little time to admire your work, you are ready to try and interpret your map (if you are wondering whether or not you did yours proper, I included a sample map to help you with the formatting SAMPLE GROUP MAP.pdf). Did you notice any groups that contain a particularly high concentration of companies with large brand values? Write a couple paragraphs explaining which group you think is the most attractive (i.e., if you had to invest in one of these groups where would you put your money?). You should justify your reasoning based on Porter's 5 forces (e.g., explain how your group might be less rivalrous or is in a better bargain position against their suppliers). Brand Adidas Asics Banana Republic Calvin Klein Diesel Forever 21 GAP Gucci Christian Louboutin 2.99 H&M Lacoste Levi's Louis Vuitton Lululemon (2016) Brand Value in Billions Manolo Blahnik 9.22 0.7 0.64 1.58 1.6 1.26 1.39 9.63 14.54 1.03 3.68 25.53 5.7 1.63 Michael Kors Nike Old Navy Patagonia The North Face 5.35 Under Armour 28.44 1.82 Polo Ralph Lauren 1.66 0.77 5.67 4.53 Quality MAP KEY Dupri Gauthier Hollier Guilliot Smith Johnson Roberts Speed Max X-stream Sandia Peak Hatchet TJM's Barnes Mal-Wart SAMPLE GROUP MAP French Artisanal Urban Mass Market Sports and Outdoor Inspired Department Store Segment
Expert Answer:

Related Book For 
Management Accounting
ISBN: 9780730369387
4th Edition
Authors: Leslie G. Eldenburg, Albie Brooks, Judy Oliver, Gillian Vesty, Rodney Dormer, Vijaya Murthy, Nick Pawsey
Posted Date:
Students also viewed these general management questions
-
Planning is one of the most important management functions in any business. A front office managers first step in planning should involve determine the departments goals. Planning also includes...
-
List three specific parts of the Case Guide, Objectives and Strategy Section (See below) that you had the most difficulty understanding. Describe your current understanding of these parts. Provide...
-
This assignment reviews object-oriented programming concepts such as classes, methods, constructors, accessor methods, and access modifiers. It makes use of an array of objects as a class data...
-
On January 2, 2016, Allen Company purchased a machine for $70,000. This machine has a five-year useful life, a residual value of $10,000, and it is depreciated using the straight-line method for...
-
Exercise 1.3 showed samples of tensile strength data, one for specimens that were exposed to an aging process and one in which there was no aging of the specimens. Calculate the sample variance as...
-
You have been asked whether your organization should expand from selling its products only in North America to selling its products in Europe as well. What information would you want to collect? Who...
-
Compare the capital costs and the levelized costs of operation for a \(1000 \mathrm{MW}\) nuclear power plant and a 1000 MW PV system constructed in the Mojave desert in California. The PV system is...
-
Major Funds. The Town of Trenton has recently implemented GAAP reporting and is attempting to determine which of the following special revenue funds should be classified as major funds and therefore...
-
least ONE naar by Sunday 11:59 nm. All peer responses must be between Vat would be an example of a legal issue in e-communication? How can you avoid legal issues involving e-communication? Prompt 2-...
-
1. Alcoa was listed in Table 13-2 as a company that has a relatively high beta (a measure of stock price volatility). Alcoa produces aluminum and aluminum products. Go to its website at...
-
Q.No.6. What traits and skills can help to explain the successful strategic leadership by Ghosn? (Marks 05) Answer:
-
What is the problems with selecting a jury pool that reflects our racially diverse populations? What are two ways to improve jury selection to ensure that a criminal defendant has a jury that can be...
-
Discuss what is a INTERPOL Red Notice and what can be done by a person who is subject to a Red Notice. Discuss what, if anything, the World Bank does with respect to transnational corruption. What...
-
1. Identify which civil procedure rule(s) control venue and jurisdiction in TEXAS. Compare and contrast your state's rules to those of the Federal Rules for Civil Procedure on these two matters. 2....
-
what is your understanding of the 4th amendment? can police officer ask the driver and the occupants of a vehicle to exit of the car? what is your understanding of consent search? references:...
-
Explain the difference between an "international receivable" and an "international assignment". Under the United Nations Convention on the Assignment of Receivables in International trade, how is the...
-
Write an equation for below statement Let x be the unknown number. seven less than twice a number is 12 .
-
A woman at a point A on the shore of a circular lake with radius 2 mi wants to arrive at the point C diametrically opposite on the other side of the lake in the shortest possible A time. She can walk...
-
Sarah Tesar is the lead partner of a medium-sized accounting firm. The eight partners share in an annual bonus pool. The characteristics of the bonus pool system include: The bonus pool size each...
-
SmallScale Publishing has just commenced business and will sell only one title, New to Business. Market analysis has indicated that sales for the next 6 months should be 5 000 copies. The accountant...
-
The Enviro division of Solar Sun produces solar panels, 20 per cent of which are sold to the Energy Plus division of Solar Sun and the remainder to outside customers. Solar Sun treats its divisions...
-
Define the correlation coefficient, \(ho_{X Y}\).
-
True or False. The autocorrelation function \(R\left(t_{1}, t_{2} ight)\) is the same as \(E\left[x\left(t_{1} ight) x\left(t_{2} ight) ight]\).
-
If \(x\) and \(y\) are statistically independent, then \(E[x y]=E[x] E[y]\). That is, the expected value of the product \(x y\) is equal to the product of the separate mean values. If \(z=x+y\),...

Study smarter with the SolutionInn App