

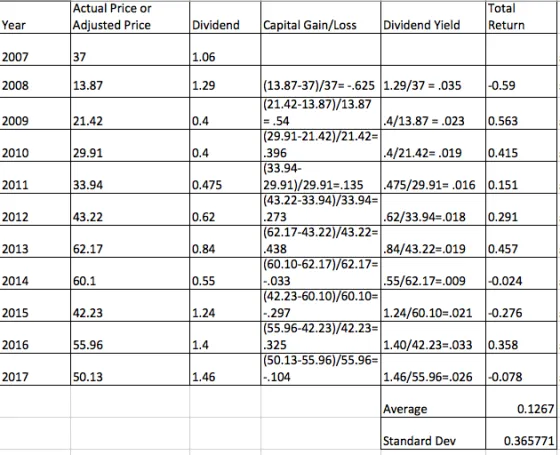
Based on the below chart, what is the total risk of this company? The average return and
Fantastic news! We've Found the answer you've been seeking!
Question:
Based on the below chart, what is the total risk of this company? The average return and standard deviation for the S&P500 are around 10% and 18% respectively for the same period. Did your company outperform or underperform the S&P 500 index? Isyour company's stock riskier than the S&P 500 index?
Expert Answer:
Answer To calculate the total risk of the company you can use the standard deviation of the tota... View the full answer

Related Book For 

Business Statistics In Practice
ISBN: 9780073401836
6th Edition
Authors: Bruce Bowerman, Richard O'Connell
Posted Date:
