

Based on the given tables, draw a complete REA diagram, 2.1 Creating an REA Diagram based...
Fantastic news! We've Found the answer you've been seeking!
Question:
Transcribed Image Text:
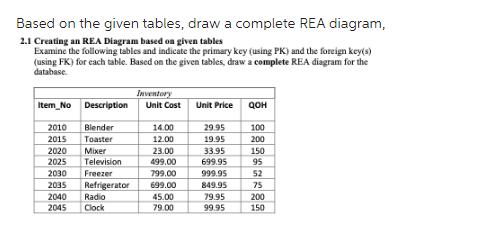
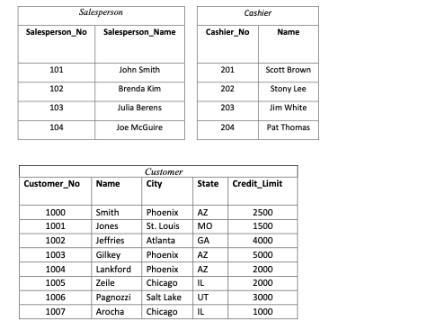
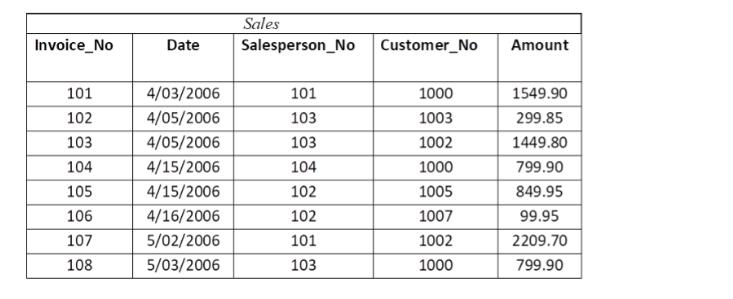
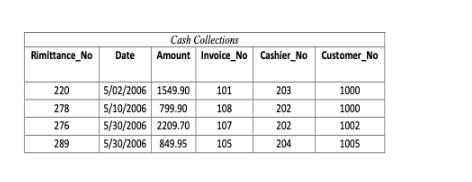
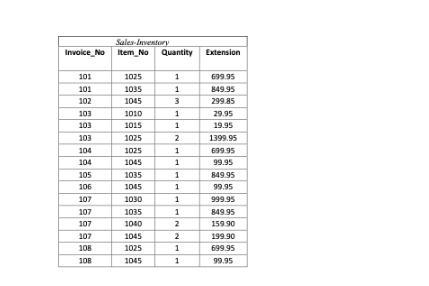
Based on the given tables, draw a complete REA diagram, 2.1 Creating an REA Diagram based on given tables Examine the following tables and indicate the primary key (using PK) and the foreign key(s) (using FK) for each table. Based on the given tables, draw a complete REA diagram for the database. Item No Description 2010 Blender 2015 Toaster 2020 Mixer 2025 Television 2030 Freezer 2035 Refrigerator 2040 Radio 2045 Clock Inventory Unit Cost 14.00 12.00 23.00 499,00 799.00 699.00 45.00 79.00 Unit Price 29.95 19.95 33.95 699.95 999.95 849.95 79.95 99.95 QOH 100 200 150 95 52 75 200 150 == Salesperson No Salesperson Name 101 102 103 104 Salesperson Customer No 1000 1001 1002 1003 1004 1005 1006 1007 John Smith Brenda Kim Julia Berens Joe McGuire Name Customer City Smith Jones Jeffries Gilkey Lankford Zeile Pagnozzi Arocha Chicago Phoenix AZ St. Louis MO GA AZ AZ Atlanta Phoenix Phoenix Chicago Cashier No 201 202 203 IL Salt Lake UT IL Cashier 204 State Credit Limit Scott Brown Stony Lee Jim White Pat Thomas 2500 1500 4000 Name 5000 2000 2000 3000 1000 Invoice_No 101 102 103 104 105 106 107 108 Sales Date Salesperson No Customer_No 4/03/2006 4/05/2006 4/05/2006 4/15/2006 4/15/2006 4/16/2006 5/02/2006 5/03/2006 101 103 103 104 102 102 101 103 1000 1003 1002 1000 1005 1007 1002 1000 Amount 1549.90 299.85 1449.80 799.90 849.95 99.95 2209.70 799.90 Rimittance_No Date 220 278 276 289 Cash Collections Amount Invoice No Cashier_No Customer_No 5/02/2006 1549.90 101 5/10/2006 799.90 108 5/30/2006 2209.70 107 5/30/2006 849.95 105 203 202 202 204 1000 1000 1002 1005 Invoice_No 101 101 102 103 103 103 104 104 105 106 107 107 107 107 108 108 Sales Inventory Item No Quantity Extension 1025 1035 1045 1010 1015 1025 1025 1045 1035 1045 1030 1035 1040 1045 1025 1045 1 1 3 1 1 2 1 1 1 1 1 1 2 2 1 1 699.95 849.95 299.85 29.95 19.95 1399.95 699.95 99.95 849.95 99.95 999.95 849.95 159.90 199.90 699.95 99.95 Based on the given tables, draw a complete REA diagram, 2.1 Creating an REA Diagram based on given tables Examine the following tables and indicate the primary key (using PK) and the foreign key(s) (using FK) for each table. Based on the given tables, draw a complete REA diagram for the database. Item No Description 2010 Blender 2015 Toaster 2020 Mixer 2025 Television 2030 Freezer 2035 Refrigerator 2040 Radio 2045 Clock Inventory Unit Cost 14.00 12.00 23.00 499,00 799.00 699.00 45.00 79.00 Unit Price 29.95 19.95 33.95 699.95 999.95 849.95 79.95 99.95 QOH 100 200 150 95 52 75 200 150 == Salesperson No Salesperson Name 101 102 103 104 Salesperson Customer No 1000 1001 1002 1003 1004 1005 1006 1007 John Smith Brenda Kim Julia Berens Joe McGuire Name Customer City Smith Jones Jeffries Gilkey Lankford Zeile Pagnozzi Arocha Chicago Phoenix AZ St. Louis MO GA AZ AZ Atlanta Phoenix Phoenix Chicago Cashier No 201 202 203 IL Salt Lake UT IL Cashier 204 State Credit Limit Scott Brown Stony Lee Jim White Pat Thomas 2500 1500 4000 Name 5000 2000 2000 3000 1000 Invoice_No 101 102 103 104 105 106 107 108 Sales Date Salesperson No Customer_No 4/03/2006 4/05/2006 4/05/2006 4/15/2006 4/15/2006 4/16/2006 5/02/2006 5/03/2006 101 103 103 104 102 102 101 103 1000 1003 1002 1000 1005 1007 1002 1000 Amount 1549.90 299.85 1449.80 799.90 849.95 99.95 2209.70 799.90 Rimittance_No Date 220 278 276 289 Cash Collections Amount Invoice No Cashier_No Customer_No 5/02/2006 1549.90 101 5/10/2006 799.90 108 5/30/2006 2209.70 107 5/30/2006 849.95 105 203 202 202 204 1000 1000 1002 1005 Invoice_No 101 101 102 103 103 103 104 104 105 106 107 107 107 107 108 108 Sales Inventory Item No Quantity Extension 1025 1035 1045 1010 1015 1025 1025 1045 1035 1045 1030 1035 1040 1045 1025 1045 1 1 3 1 1 2 1 1 1 1 1 1 2 2 1 1 699.95 849.95 299.85 29.95 19.95 1399.95 699.95 99.95 849.95 99.95 999.95 849.95 159.90 199.90 699.95 99.95 Based on the given tables, draw a complete REA diagram, 2.1 Creating an REA Diagram based on given tables Examine the following tables and indicate the primary key (using PK) and the foreign key(s) (using FK) for each table. Based on the given tables, draw a complete REA diagram for the database. Item No Description 2010 Blender 2015 Toaster 2020 Mixer 2025 Television 2030 Freezer 2035 Refrigerator 2040 Radio 2045 Clock Inventory Unit Cost 14.00 12.00 23.00 499,00 799.00 699.00 45.00 79.00 Unit Price 29.95 19.95 33.95 699.95 999.95 849.95 79.95 99.95 QOH 100 200 150 95 52 75 200 150 == Salesperson No Salesperson Name 101 102 103 104 Salesperson Customer No 1000 1001 1002 1003 1004 1005 1006 1007 John Smith Brenda Kim Julia Berens Joe McGuire Name Customer City Smith Jones Jeffries Gilkey Lankford Zeile Pagnozzi Arocha Chicago Phoenix AZ St. Louis MO GA AZ AZ Atlanta Phoenix Phoenix Chicago Cashier No 201 202 203 IL Salt Lake UT IL Cashier 204 State Credit Limit Scott Brown Stony Lee Jim White Pat Thomas 2500 1500 4000 Name 5000 2000 2000 3000 1000 Invoice_No 101 102 103 104 105 106 107 108 Sales Date Salesperson No Customer_No 4/03/2006 4/05/2006 4/05/2006 4/15/2006 4/15/2006 4/16/2006 5/02/2006 5/03/2006 101 103 103 104 102 102 101 103 1000 1003 1002 1000 1005 1007 1002 1000 Amount 1549.90 299.85 1449.80 799.90 849.95 99.95 2209.70 799.90 Rimittance_No Date 220 278 276 289 Cash Collections Amount Invoice No Cashier_No Customer_No 5/02/2006 1549.90 101 5/10/2006 799.90 108 5/30/2006 2209.70 107 5/30/2006 849.95 105 203 202 202 204 1000 1000 1002 1005 Invoice_No 101 101 102 103 103 103 104 104 105 106 107 107 107 107 108 108 Sales Inventory Item No Quantity Extension 1025 1035 1045 1010 1015 1025 1025 1045 1035 1045 1030 1035 1040 1045 1025 1045 1 1 3 1 1 2 1 1 1 1 1 1 2 2 1 1 699.95 849.95 299.85 29.95 19.95 1399.95 699.95 99.95 849.95 99.95 999.95 849.95 159.90 199.90 699.95 99.95 Based on the given tables, draw a complete REA diagram, 2.1 Creating an REA Diagram based on given tables Examine the following tables and indicate the primary key (using PK) and the foreign key(s) (using FK) for each table. Based on the given tables, draw a complete REA diagram for the database. Item No Description 2010 Blender 2015 Toaster 2020 Mixer 2025 Television 2030 Freezer 2035 Refrigerator 2040 Radio 2045 Clock Inventory Unit Cost 14.00 12.00 23.00 499,00 799.00 699.00 45.00 79.00 Unit Price 29.95 19.95 33.95 699.95 999.95 849.95 79.95 99.95 QOH 100 200 150 95 52 75 200 150 == Salesperson No Salesperson Name 101 102 103 104 Salesperson Customer No 1000 1001 1002 1003 1004 1005 1006 1007 John Smith Brenda Kim Julia Berens Joe McGuire Name Customer City Smith Jones Jeffries Gilkey Lankford Zeile Pagnozzi Arocha Chicago Phoenix AZ St. Louis MO GA AZ AZ Atlanta Phoenix Phoenix Chicago Cashier No 201 202 203 IL Salt Lake UT IL Cashier 204 State Credit Limit Scott Brown Stony Lee Jim White Pat Thomas 2500 1500 4000 Name 5000 2000 2000 3000 1000 Invoice_No 101 102 103 104 105 106 107 108 Sales Date Salesperson No Customer_No 4/03/2006 4/05/2006 4/05/2006 4/15/2006 4/15/2006 4/16/2006 5/02/2006 5/03/2006 101 103 103 104 102 102 101 103 1000 1003 1002 1000 1005 1007 1002 1000 Amount 1549.90 299.85 1449.80 799.90 849.95 99.95 2209.70 799.90 Rimittance_No Date 220 278 276 289 Cash Collections Amount Invoice No Cashier_No Customer_No 5/02/2006 1549.90 101 5/10/2006 799.90 108 5/30/2006 2209.70 107 5/30/2006 849.95 105 203 202 202 204 1000 1000 1002 1005 Invoice_No 101 101 102 103 103 103 104 104 105 106 107 107 107 107 108 108 Sales Inventory Item No Quantity Extension 1025 1035 1045 1010 1015 1025 1025 1045 1035 1045 1030 1035 1040 1045 1025 1045 1 1 3 1 1 2 1 1 1 1 1 1 2 2 1 1 699.95 849.95 299.85 29.95 19.95 1399.95 699.95 99.95 849.95 99.95 999.95 849.95 159.90 199.90 699.95 99.95
Expert Answer:
Answer rating: 100% (QA)
REA Diagram for the Given Tables Entities Economic Agent Customer Salesperson Economic Resource Inve... View the full answer

Related Book For 
Posted Date:
Students also viewed these accounting questions
-
Based on the given data, what formula(s) can we use to calculate the portfolio statistics? What are the results? This is based on an equal weighted portfolio of five stocks. Name of the Stock Average...
-
Please fill in the table based on the given MS spectrum. MS Data Molecular Formula IHD M+ (m/z) Base Peak (m/z) Lost Fragments/ Other Peaks (m/z)
-
Determine the F-test statistic based on the given summary statistics. Population Sample Size Sample Mean Sample Variance 48 10 40 42 31 10 25 3 10 44
-
Explain why merchants accepted gold receipts as a means of payment even though the receipts were issued by gold-smiths, not the government. What risk did goldsmiths introduce into the payments system...
-
With the recent changes in the tax law definition of a dependent, it is interesting to compare how the United States definition of a dependent differs throughout the world. Go to the Australian...
-
In Table 4.8, we report WestJet's sustainable growth rate as 13.62%. a. What would the sustainable growth rate be if Westjet's payout ratio increased to 70%? b. What would the sustainable growth rate...
-
What are the two purposes of taking a deposition?
-
Ruby-Star Incorporated is considering two different vendors for one of its top-selling products which has an average weekly demand of 50 units and is valued at $75 per unit. Inbound shipments from...
-
Question 1 (30 points) A 3D infinite quantum well is a very simple model for an atom. Suppose that two cubic 3D infinite quantum wells, with cube dimension L, are joined to form one parallelepiped...
-
This year Robert had the following income and losses from four passive activities: Activity 1. $(20,000) Activity 2... (10,000) Activity 3. (5,000) Activity 4. 33,000 Activity 4 had $10,000 of...
-
a) Define an interface called 'Function' using Java's Generic Types. The interface should have two methods. The first method is compute(), which takes input of type A and produces output (as...
-
Donald Trump says hell bring home jobs lost to China and Mexico. It is possible but costly. American consumers would face higher prices and those on low incomes would suffer most because they spend a...
-
Outline the factors that may contribute to digital business failure (including IT projects failure).
-
U.S. coal production in 2016 is 17 percent down on that of 2015. Almost all coal use in the United States is for electricity generation and the price of coal for power plants fell from $2.27 per...
-
Explain approaches for assessing the return on investment of social media marketing.
-
Which specific actions are required for you to build traffic, gain customer response, gain sales and fulfil them, if appropriate, and foster e-CRM?
-
Select the statement that is correct in describing the steps involved in a partnership liquidation. Select answer from the options below Noncash assets must be sold after the creditors have been...
-
(a) What do data breach notification laws require? (b) Why has this caused companies to think more about security?
-
Your organization is planning to implement an ERP system. Some managers in the organization favor the big bang approach. Others are advocating a phased-in approach. The CEO has asked you, as project...
-
A procurement agent for a large metropolitan building authority threatens to blacklist a building contractor if he does not make a financial payment to the agent. If the contractor does not...
-
What is an access control list?
-
Explain the limitations that auditors face when they perform the attest function.
-
Indicate whether you think the following third-party groups would normally represent a (1) primary beneficiary, (2) foreseen party, or (3) foreseeable party. Give reasons for your answers. a. A...
-
Use and Dispose Company was organized to manufacture and sell inexpensive golf clubs that can be used during the golf round and then thrown away at the end of the round. In order to keep the business...

Study smarter with the SolutionInn App