

Question
Bed Bath & Beyond Inc. is in 'Home Furniture, Furnishings, And Equipment Stores industry. Calculate following financial ratios for years 2016, 2017, 2018, and
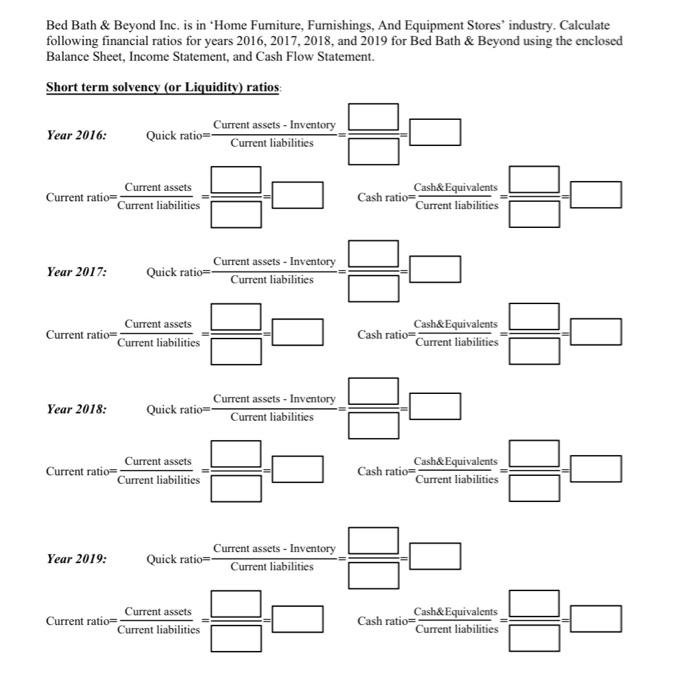
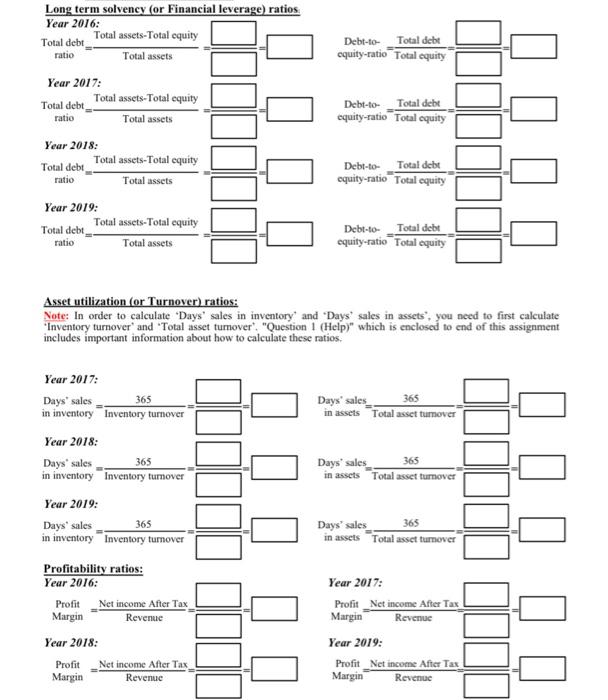
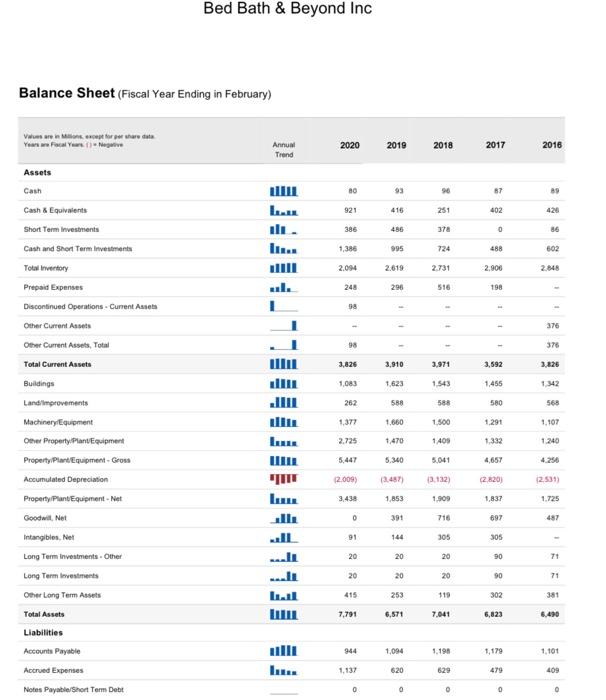
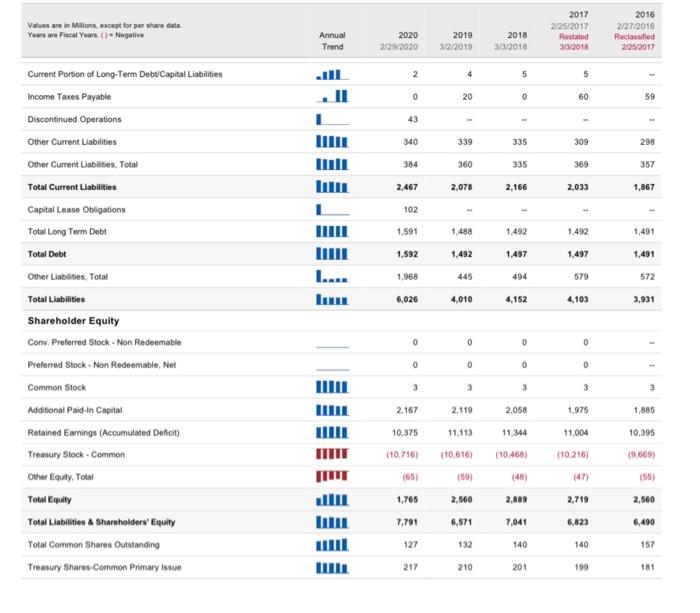
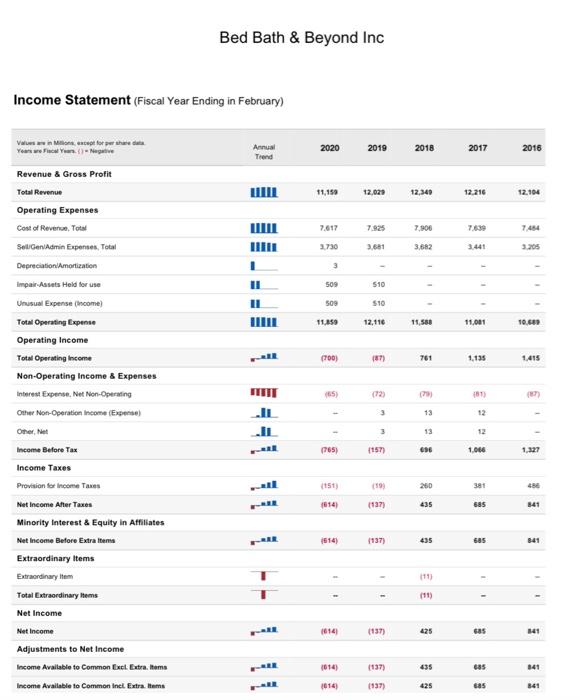
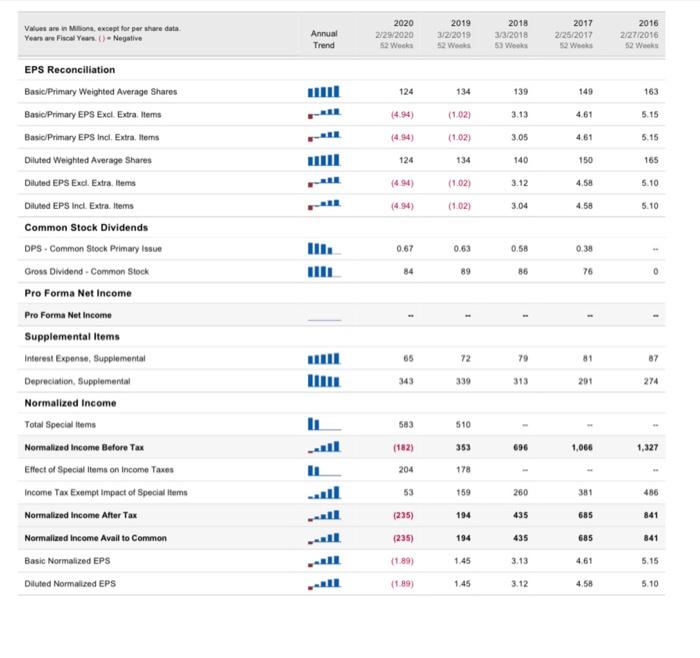
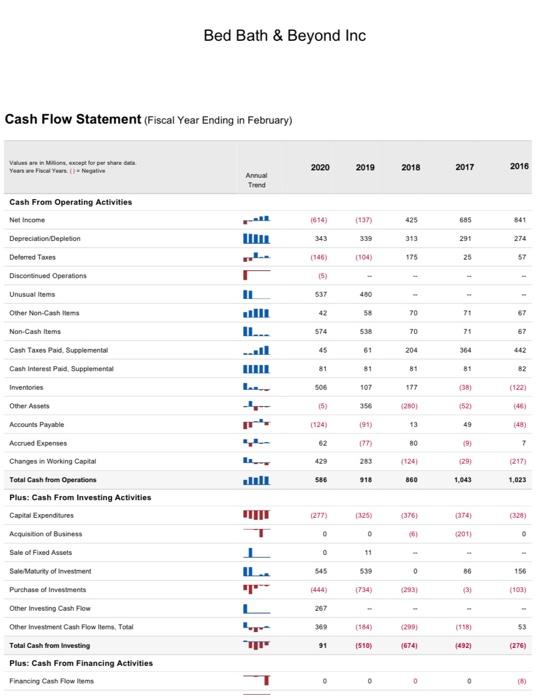
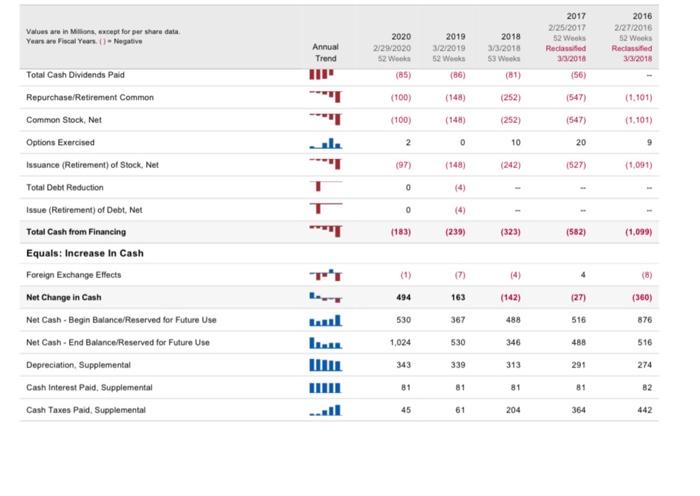
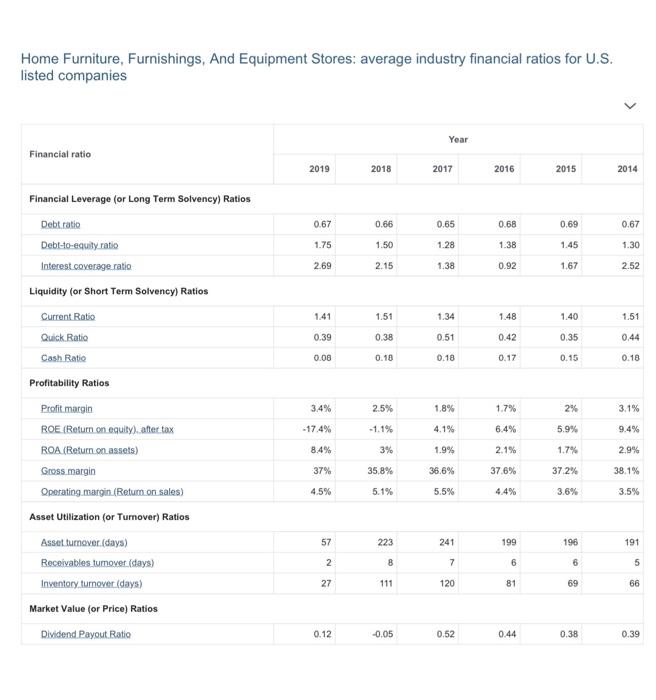
Bed Bath & Beyond Inc. is in 'Home Furniture, Furnishings, And Equipment Stores industry. Calculate following financial ratios for years 2016, 2017, 2018, and 2019 for Bed Bath & Beyond using the enclosed Balance Sheet, Income Statement, and Cash Flow Statement. Short term solvency (or Liquidity) ratios: Year 2016: Current ratio Year 2017: Year 2018: Current ratio= Year 2019: Current assets Current liabilities Current ratio= Current assets Current liabilities Quick ratio==- Current assets Current liabilities Current ratio= Quick ratio=- Current assets - Inventory Current liabilities Quick ratio= Current assets Current liabilities Current assets - Inventory Current liabilities Quick ration- Current assets - Inventory Current liabilities Current assets - Inventory Current liabilities Cash& Equivalents Current liabilities Cash ratio= Cash& Equivalents Current liabilities Cash ratio= Cash& Equivalents Current liabilities Cash ratio= Cash& Equivalents Current liabilities Cash ratio=; Long term solvency (or Financial leverage) ratios. Year 2016: Total debt ratio Total assets-Total equity Total assets Year 2017: Total debt ratio Total assets-Total equity Total assets Year 2018: Total debt ratio Total assets-Total equity Total assets Year 2019: Total debt ratio Total assets-Total equity Total assets Year 2017: Days' sales 365 in inventory Inventory turnover Year 2018: Days' sales 365 in inventory Inventory turnover Year 2019: Days' sales 365 in inventory Inventory turnover Asset utilization (or Turnover) ratios: Note: In order to calculate 'Days' sales in inventory' and 'Days' sales in assets, you need to first calculate Inventory turnover" and "Total asset turnover", "Question 1 (Help)" which is enclosed to end of this assignment includes important information about how to calculate these ratios. Profitability ratios: Year 2016: Profit Net income After Tax Margin Revenue Year 2018: Debt-to- Total debt equity-ratio Total equity Profit Net income After Tax Margin Revenue Debt-to- Total debt equity-ratio Total equity Debt-to- Total debt equity-ratio Total equity Debt-to- Total debt equity-ratio Total equity 365 Days' sales_ in assets Total asset turnover Days' sales 365 in assets Total asset turnover Days' sales 365 in assets Total asset turnover Year 2017: Profit _Net income After Tax Margin Revenue Year 2019: Profit Net income After Tax Margin Revenue Q1) For each of the following financial ratios, discuss its trend over time "in the industry" and "in Bed Bath & Beyond in comparison to the industry" during 2016-2019 time period. For each ration discuss the direction of change and whether it denotes an improvement or worsening. (industry average financial ratios are enclosed). Quick ratio: (0.5 points for each ratio) Trend in industry: Trend in Bed Bath & Beyond in comparison to the industry: Debt-to-equity ratio: Trend in industry: Trend in Bed Bath & Beyond in comparison to the industry: Days' sales in inventory: Trend in industry: Trend in Bed Bath & Beyond in comparison to the industry: Profit Margin: Trend in industry: Trend in Bed Bath & Beyond in comparison to the industry: Q2) Each of the four ratios you discussed in Q1 provides insight about a specific aspect of Bed Bath & Beyond's financial situation. (For example, Quick ratio provides insight about threat of short term solvency, and Days' sales in inventory provides insight about company's effectiveness in asset utilization, and so on.) Combine and relate your discussions of all four ratios (do not consider any other ratio) to provide a holistic analysis of financial condition of Bed Bath & Beyond. Your holistic financial analysis must include a discussion followed by a list of Bed Bath & Beyond's major financial concern(s) or strong point(s) and a finally a conclusion about the company's overall financial condition.(1.2 points) Balance Sheet (Fiscal Year Ending in February) Values are in Millions except for per share data Years are Focal Years) Negative Assets Cash Cash & Equivalents Short Term Investments Cash and Short Term Investments Total Inventory Prepaid Expenses Discontinued Operations - Current Assets Other Current Assets Other Current Assets, Total Total Current Assets Buildings Land improvements Machinery Equipment Other Property Plant Equipment Property Plant Equipment- Gross Accumulated Depreciation Property Plant Equipment - Net Goodwill, Net Bed Bath & Beyond Inc Intangibles, Net Long Term Investments - Other Long Term Investments Other Long Term Assets Total Assets Liabilities Accounts Payable Accrued Expenses Notes Payable/Short Term Debt Annual Trend LILL l. ul. I alli all ..... 2020 80 921 386 1,386 2.094 248 98 98 3,826 1,083 262 1,377 2,725 5,447 (2.009) 3,438 0 91 20 20 415 7,791 944 1,137 0 2019 93 416 486 995 2.619 296 ** 1 3,910 1,623 588 1.660 1,470 5,340 (3,487) 1,853 391 144 20 20 253 6,571 1,094 620 0 2018 8 90 251 378 724 2,731 516 11 3,971 1,543 588 1,500 1,409 5,041 (3,132) 1,909 716 305 20 20 119 7,041 1.198 629 0 2017 87 402 0 488 2,906 198 3,592 1,455 580 1,291 1,332 4,657 (2,820) 1,837 697 305 90 90 302 6,823 1,179 479 0 2016 89 426 86 602 2,848 376 376 1,342 568 1.107 1,240 (2.531) 1.725 487 71 71 381 6,490 1,101 409 0 Values are in Millions, except for per share data Years are Fiscal Years. ()- Negative Current Portion of Long-Term Debt Capital Liabilities Income Taxes Payable Discontinued Operations Other Current Liabilities Other Current Liabilities, Total Total Current Liabilities Capital Lease Obligations Total Long Term Debt Total Debt Other Liabilities, Total Total Liabilities Shareholder Equity Conv. Preferred Stock - Non Redeemable Preferred Stock - Non Redeemable, Net Common Stock Additional Paid-In Capital Retained Earnings (Accumulated Deficit) Treasury Stock - Common Other Equity, Total Total Equity Total Liabilities & Shareholders' Equity Total Common Shares Outstanding Treasury Shares-Common Primary Issue Annual Trend Jill 2020 2019 2/29/2020 3/2/2019 2 0 43 340 384 2,467 102 1,591 1,592 1,968 6,026 0 0 3 2,167 10,375 (10,716) (65) 1,765 7,791 127 217 4 20 339 360 2,078 1,488 1,492 445 4,010 0 0 3 2,119 11,113 (59) 2,560 6,571 132 2018 3/3/2018 210 5 0 335 335 2,166 1,492 1,497 2,058 11,344 (10,616) (10,468) 494 4,152 0 3 (48) 2,889 7,041 140 201 2017 2/25/2017 Restated 3/3/2016 5 60 w 309 369 2,033 1,492 1,497 579 4,103 0 0 3 1,975 11,004 (10,216) (47) 2,719 6,823 140 199 2016 2/27/2016 Reclassified 2/25/2017 59 298 357 1,867 1,491 1,491 572 3,931 E 3 1,885 10,395 (9,669) (55) 2,560 6,490 157 181 Income Statement (Fiscal Year Ending in February) Values are in Millions, except for per share data Years are Fiscal Years()-Negative Revenue & Gross Profit Total Revenue Operating Expenses Cost of Revenue, Total Sell/Gen/Admin Expenses, Total Depreciation/Amortization Impair-Assets Held for use Unusual Expense (Income) Total Operating Expense Operating Income Total Operating Income Non-Operating Income & Expenses Interest Expense, Net Non-Operating Other Non-Operation Income (Expense) Other, Net Income Before Tax Income Taxes Provision for Income Taxes Net Income After Taxes Minority Interest & Equity in Affiliates Net Income Before Extra Items Extraordinary Items Extraordinary Item Bed Bath & Beyond Inc Total Extraordinary Items Net Income Net Income Adjustments to Net Income Income Available to Common Excl. Extra. Items Income Available to Common Incl. Extra.Items Annual Trend I II II IL JL FAL ALE FARE 2020 11,159 7,617 3,730 3 509 509 11,859 (700) (85) (765) (151) (614) (614) (614) (014) (014) 2019 12,029 7.925 3,681 510 $10 12,116 (87) (72) 3 3 (157) (19) (137) (137) 11 (137) (137) (137) 2018 12,349 7,906 3,682 11,588 761 (79) 13 13 696 260 435 435 425 435 425 2017 12,216 7,639 3,441 11,001 1,135 (81) 12 1,066 381 685 685 11 685 685 685 2016 12.104 3,205 I 10.689 1,415 (87) 1,327 486 841 841 11 841 841 Values are in Millions, except for per share data. Years are Fiscal Years. ()- Negative EPS Reconciliation Basic/Primary Weighted Average Shares Basic/Primary EPS Excl. Extra. Items Basic/Primary EPS Incl. Extra, Items Diluted Weighted Average Shares Diluted EPS Excl. Extra. Items Diluted EPS Incl. Extra. Items Common Stock Dividends DPS-Common Stock Primary Issue Gross Dividend - Common Stock Pro Forma Net Income Pro Forma Net Income Supplemental Items Interest Expense, Supplemental Depreciation, Supplemental Normalized Income Total Special Items Normalized Income Before Tax Effect of Special Items on Income Taxes Income Tax Exempt Impact of Special Items Normalized Income After Tax Normalized Income Avail to Common Basic Normalized EPS Diluted Normalized EPS Annual Trend FUL 2020 2/29/2020 52 Works 124 (4.94) (4.94) 124 (4.94) (4.94) 0.67 84 1 65 343 583 (182) 204 53 (235) (235) (1.89) (1.89) 2019 3/2/2019 52 Weeks 134 (1.02) (1.02) 134 (1.02) (1.02) 0.63 89 1 72 339 510 353 178 159 194 194 1.45 1.45 2018 3/3/2018 53 Weeks 139 3.13 3.05 140 3.12 3.04 0.58 86 1 79 313 696 260 435 435 3.13 3.12 2017 2/25/2017 52 Weeks 149 4.61 4.61 150 4.58 4.58 0.38 76 1 81 201 4 1,066 381 685 685 4.61 4.58 2016 2/27/2016 52 Weeks 163 5.15 5.15 165 5.10 5.10 1 87 274 1,327 1 486 841 841 5.15 5.10 Cash Flow Statement (Fiscal Year Ending in February) Values are in Mons, except for per share data Years are Fiscal Years (Negative Cash From Operating Activities Net Income Depreciation Depletion Deferred Taxes Discontinued Operations Unusual Items Other Non-Cashles Non-Cash Items Cash Taxes Paid. Supplemental Cash Interest Paid Supplemental Inventories Other Assets Accounts Payable Accrued Expenses Changes in Working Capital Total Cash from Operations Plus: Cash From Investing Activities Capital Expenditures Acquisition of Business Sale of Fixed Assets Sale Maturity of Investment Purchase of Investments Other Investing Cash Flow Other Investment Cash Flow Items, Total Bed Bath & Beyond Inc Total Cash from Investing Plus: Cash From Financing Activities Financing Cash Flow Items Annual Trend all r 44 T 1 L 4 2020 (614) 343 (146) (5) 537 42 574 45 81 506 (5) (124) 62 429 586 (277) 0 0 545 267 369 91 O 0 2019 (137) 339 (104) 480 58 538 81 107 356 (91) (77) 283 918 0 11 539 (734) (510) O 2018 425 313 175 70 70 204 81 177 (280) 13 80 860 (376) (6) 0 (293) (299) (674) 0 2017 685 291 25 71 71 364 81 (38) (52) 49 (9) (29) 1,043 (374) (201) 86 (3) (492) 0 2016 274 57 - 67 67 442 82 (122) (46) (48) 7 (217) 1,023 0 156 (103) 53 (276) (8) Values are in Millions, except for per share data Years are Fiscal Years. ()- Negative Total Cash Dividends Paid Repurchase/Retirement Common Common Stock, Net Options Exercised Issuance (Retirement) of Stock, Net Total Debt Reduction Issue (Retirement) of Debt, Net Total Cash from Financing Equals: Increase In Cash Foreign Exchange Effects Net Change in Cash Net Cash - Begin Balance/Reserved for Future Use Net Cash-End Balance/Reserved for Future Use Depreciation, Supplemental Cash Interest Paid, Supplemental Cash Taxes Paid, Supplemental Annual Trend ... nul II 2020 2/29/2020 52 Wooks (85) (100) (100) 2 (97) 0 0 (183) 494 530 1,024 343 81 45 2019 3/2/2019 52 Weeks (86) (148) (148) 0 (148) (4) (4) (239) 163 367 530 339 81 61 2018 3/3/2018 53 Weeks (252) (252) 10 (242) 1 1 (323) (142) 488 346 313 81 204 2017 2/25/2017 52 Weeks Reclassifed 3/3/2018 (56) (547) (547) 20 (527) (582) 4 (27) 516 488 291 81 364 2016 2/27/2016 52 Weeks Reclassified 3/3/2018 (1,101) (1,101) 9 (1,091) (1,099) (8) (360) 876 516 274 82 442 Home Furniture, Furnishings, And Equipment Stores: average industry financial ratios for U.S. listed companies Financial ratio Financial Leverage (or Long Term Solvency) Ratios Debt ratio Debt-to-equity ratio Interest coverage ratio Liquidity (or Short Term Solvency) Ratios Current Ratio Quick Ratio Cash Ratio Profitability Ratios Profit margin ROE (Return on equity), after tax ROA (Return on assets) Gross margin Operating margin (Retum on sales) Asset Utilization (or Turnover) Ratios Asset turnover. (days) Receivables turnover (days) Inventory turnover (days) Market Value (or Price) Ratios Dividend Payout Ratio 2019 0.67 1.75 2.69 1.41 0.39 0.08 3.4% -17.4% 8.4% 37% 4.5% 57 2 27 0.12 2018 0.66 1.50 2.15 1.51 0.38 0.18 2.5% -1.1% 3% 35.8% 5.1% 223 8 111 -0.05 Year 2017 0.65 1.28 1.38 1.34 0.51 0.18 1.8% 4.1% 1.9% 36.6% 5.5% 241 7 120 0.52 2016 0.68 1.38 0.92 1.48 0.42 0.17 1.7% 6.4% 2.1% 37.6% 4.4% 199 6 81 0.44 2015 0.69 1.45 1.67 1.40 0.35 0.15 2% 5.9% 1.7% 37,2% 3.6% 196 6 69 0.38 2014 0.67 1.30 2.52 1.51 0.44 0.18 3.1% 9.4% 2.9% 38.1% 3.5% 191 5 66 0.39
Step by Step Solution
3.39 Rating (115 Votes )
There are 3 Steps involved in it
Step: 1
StepbyStep Explanation Lets calculate the requested financial ratios for Bed Bath Beyond Inc for the years 2016 2017 2018 and 2019 based on the provided financial statements Shortterm Solvency Liquidi...
Get Instant Access with AI-Powered Solutions
See step-by-step solutions with expert insights and AI powered tools for academic success
Step: 2

Step: 3
Ace Your Homework with AI
Get the answers you need in no time with our AI-driven, step-by-step assistance
Get Started
Basic Business Statistics Concepts And Applications
Authors: Mark L. Berenson, David M. Levine, Timothy C. Krehbiel
12th Edition
132168383, 978-0132168380