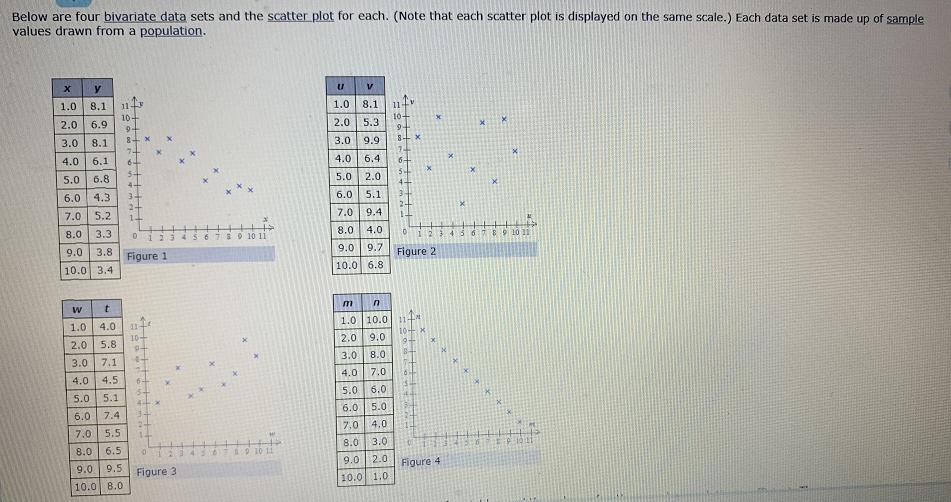
Below are four bivariate data sets and the scatter plot for each. (Note that each scatter...
Fantastic news! We've Found the answer you've been seeking!
Question:
Transcribed Image Text:
Below are four bivariate data sets and the scatter plot for each. (Note that each scatter plot is displayed on the same scale.) Each data set is made up of sample values drawn from a population. y V 1.0 8.1 11 1.0 8.1 2.0 6.9 10+ 10- 9- 2.0 | 5.3 3.0 8.1 8- 3.0 9.9 4.0 6.1 6- 4.0 6.4 64 54 5.0 6.8 5.0 2.0 6.0 4.3 34 2+ 6.0 5.1 3 24 7.0 5.2 7.0 9.4 8.0 3.3 S010 11 8.0 4.0 6.089 1031 9.0 3.8 9.0 9.7 Figure 1 Figure 2 10.0 3.4 10.0 6.8 m 11 10- 1.0 10.0 14 10 1.0 4.0 2.0 5.8 2.0 9.0 3.0 7.1 3.0 8.0 4.0 4.5 64 4.0 7.0 5.0 5.1 5.0 6.0 6.0 6.0 5.0 7.4 7.0 5.5 7,0 4,0 8.0 | 6.5 8.0 3.0 9.0 9.5 9.0 2.0 Figure 4 Figure 3 10.0 8.0 10.0 1.0 oloo oO Ooo Oo O CORRELATION AND SIMPLE LINEAR REGRESSION Emmanuel v Linear relationship and the sample correlation coefficient 1.0 10.0 11 1.0 4.0 11 10 x 10+ 2.0 9.0 2.0 5.8 9- 3.0 8- 3.0 7.1 7+ 6- 5- 4.0 7.0 4.0 4.5 5+ 4 x 5.0 6.0 5.0 5.1 Aa 6.0 5.0 3+ 6.0 7.4 2- 7.0 4.0 7.0 5.5 +++ 5 6 78 9 10 11 8.0 3.0 8.0 6.5 1 2 34 1 2 3 4 5678 9 10 11 9.0 2.0 9.0 9.5 Figure 4 Figure 3 10.0 1.0 10.0 8.0 Answer the following questions about the relationships between pairs of variables and the values of r, the sample correlation coefficient. The same response may be the correct answer for more than one question. 1. Which data set has an apparent positive, but not perfect, linear relationship between its two variables? Choose one 2. For which data set is the sample correlation coefficient r equal to 1? Choose one 3. For which data set is the sample correlation coefficient r closest to 0? Choose one 4. Which data set indicates the strongest positive linear relationship between its two variables? Choose one Explanation Check 2020 McGraw-Hill Education, All Rights Reserved. Terms of Use Privacy | Accessibility here to search, 21 |三 Below are four bivariate data sets and the scatter plot for each. (Note that each scatter plot is displayed on the same scale.) Each data set is made up of sample values drawn from a population. y V 1.0 8.1 11 1.0 8.1 2.0 6.9 10+ 10- 9- 2.0 | 5.3 3.0 8.1 8- 3.0 9.9 4.0 6.1 6- 4.0 6.4 64 54 5.0 6.8 5.0 2.0 6.0 4.3 34 2+ 6.0 5.1 3 24 7.0 5.2 7.0 9.4 8.0 3.3 S010 11 8.0 4.0 6.089 1031 9.0 3.8 9.0 9.7 Figure 1 Figure 2 10.0 3.4 10.0 6.8 m 11 10- 1.0 10.0 14 10 1.0 4.0 2.0 5.8 2.0 9.0 3.0 7.1 3.0 8.0 4.0 4.5 64 4.0 7.0 5.0 5.1 5.0 6.0 6.0 6.0 5.0 7.4 7.0 5.5 7,0 4,0 8.0 | 6.5 8.0 3.0 9.0 9.5 9.0 2.0 Figure 4 Figure 3 10.0 8.0 10.0 1.0 oloo oO Ooo Oo O CORRELATION AND SIMPLE LINEAR REGRESSION Emmanuel v Linear relationship and the sample correlation coefficient 1.0 10.0 11 1.0 4.0 11 10 x 10+ 2.0 9.0 2.0 5.8 9- 3.0 8- 3.0 7.1 7+ 6- 5- 4.0 7.0 4.0 4.5 5+ 4 x 5.0 6.0 5.0 5.1 Aa 6.0 5.0 3+ 6.0 7.4 2- 7.0 4.0 7.0 5.5 +++ 5 6 78 9 10 11 8.0 3.0 8.0 6.5 1 2 34 1 2 3 4 5678 9 10 11 9.0 2.0 9.0 9.5 Figure 4 Figure 3 10.0 1.0 10.0 8.0 Answer the following questions about the relationships between pairs of variables and the values of r, the sample correlation coefficient. The same response may be the correct answer for more than one question. 1. Which data set has an apparent positive, but not perfect, linear relationship between its two variables? Choose one 2. For which data set is the sample correlation coefficient r equal to 1? Choose one 3. For which data set is the sample correlation coefficient r closest to 0? Choose one 4. Which data set indicates the strongest positive linear relationship between its two variables? Choose one Explanation Check 2020 McGraw-Hill Education, All Rights Reserved. Terms of Use Privacy | Accessibility here to search, 21 |三
Expert Answer:
Related Book For
Elementary Statistics Picturing the World
ISBN: 978-0321911216
6th edition
Authors: Ron Larson, Betsy Farber
Posted Date:
Students also viewed these mathematics questions
-
Below are four bivariate data sets and the scatter plot for each. (Note that each scatter plot is displayed on the same scale.) Each data set is made up of sample values drawn from a population. 1.0...
-
A random sample is drawn from a population with = 12. The sample mean is 30. (a) Compute a 95% confidence interval for based on a sample of size 49. What is the value of the margin of error? (b)...
-
Below are four bivariate data sets and the scatter plot for each. (Note that each scatter plot is displayed on the same scale.) Each data set is made up of sample values drawn from a population. V...
-
Elizabeth Is a nurse, and she just administered 1.8 milliliters of medication to one of her patients. Elizabeth knows that the amount of medication remaining in the patient's body wi decrease by a...
-
What is one persons ham is another persons poison. What does this mean?
-
What effect does being a member of the courtroom workgroup have on the way assistant prosecutors perform their jobs?
-
A thin-walled tube with a diameter of \(12 \mathrm{~mm}\) and length of \(25 \mathrm{~m}\) is used to carry exhaust gas from a smoke stack to the laboratory in a nearby building for analysis. The gas...
-
What is meant by the term identity theft? What can happen to a person who is the victim of identity theft?
-
How would you define consumer buying behavior? Draw the model of consumer behavior and explain the factors affecting consumer buying behavior with example.
-
The G. Saussy Manufacturing company is putting out four new electronic components. Each of Saussy's four plants has the capacity to add one more product to its current line of electronic parts. The...
-
Howare cloud computing and virtualization interconnected? explain in detail.
-
Off-the-job training is imparted outside of the work environment. True False
-
Decentralization results in effective Supervision Coordination Faster operation None of the above
-
Mentoring is focused on which of the following? Development of attitudes Tutoring Job instructional technique Understudy
-
Discuss the impact of IT on organizational structure.
-
The staffing function is said to be a ___________ activity. Persuasive Continuous All of the above None of the above
-
Mary is ordering flowers to send to her mom for Mother's Day. Each flower she orders costs $2 each and she also has to pay a $4 delivery fee. If Mary's total bill is $18, how many flowers will Mary's...
-
According during to the IRS, individuals filing federal income tax returns prior to March 31 received an average refund of $1,088 in 2018. Consider the population of "last-minute" filers who mail...
-
The contingency table shows a random sample of urban, suburban, and rural libraries by the speed of their Internet access. In the table, mbps represents megabits per second. At = 0.01, can you...
-
In a survey of 200 males ages 18 to 24, 39% were enrolled in college. In a survey of 220 females ages 18 to 24, 45% were enrolled in college. At = 0.05, can you support the claim that the proportion...
-
In a recent year, the ACT scores for the reading portion of the test were normally distributed, with a mean of 21.3 and a standard deviation of 6.2. Find the probability that a randomly selected high...
-
The payments set out in Table 9.9 have been made during the year in relation to a non-current asset bought at the beginning of the year. What cost figure should be used as the basis for the...
-
Outline three different depreciation methods and appraise them in the context of the definition and objectives of depreciation.
-
The following actual and estimated figures are available. Based on these figures, evaluate the following. a. Calculate annual depreciation under the straight-line method. b. Calculate the...
Study smarter with the SolutionInn App