

Bombas Company Case Study (Week 10) The article describing this case is attached; a synopsis of...
Fantastic news! We've Found the answer you've been seeking!
Question:
Transcribed Image Text:
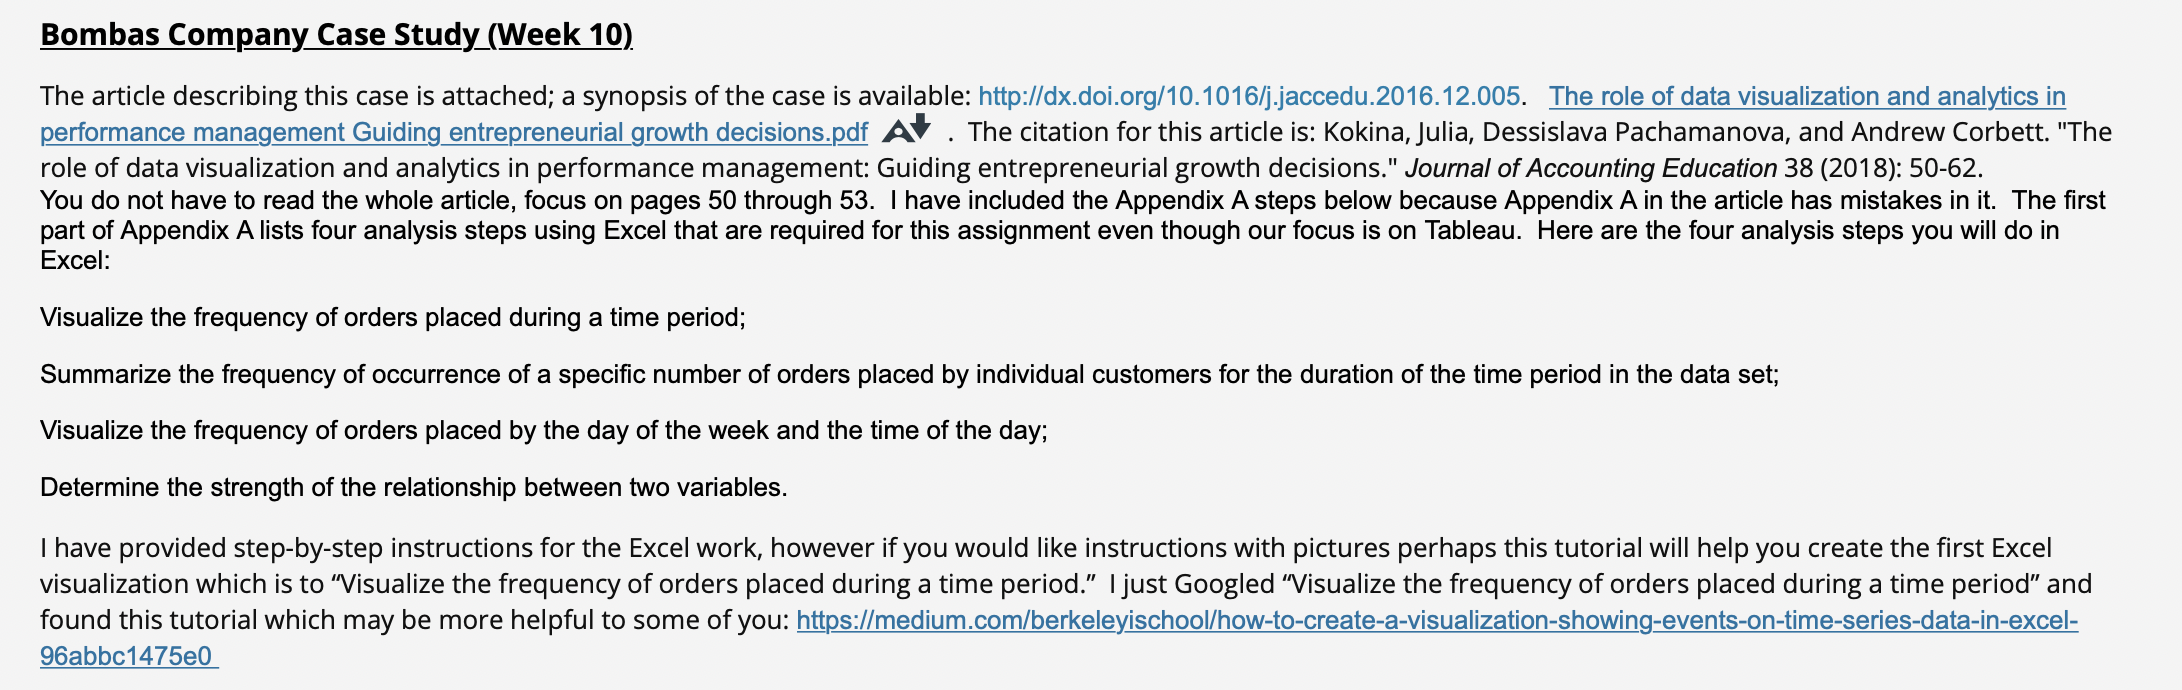
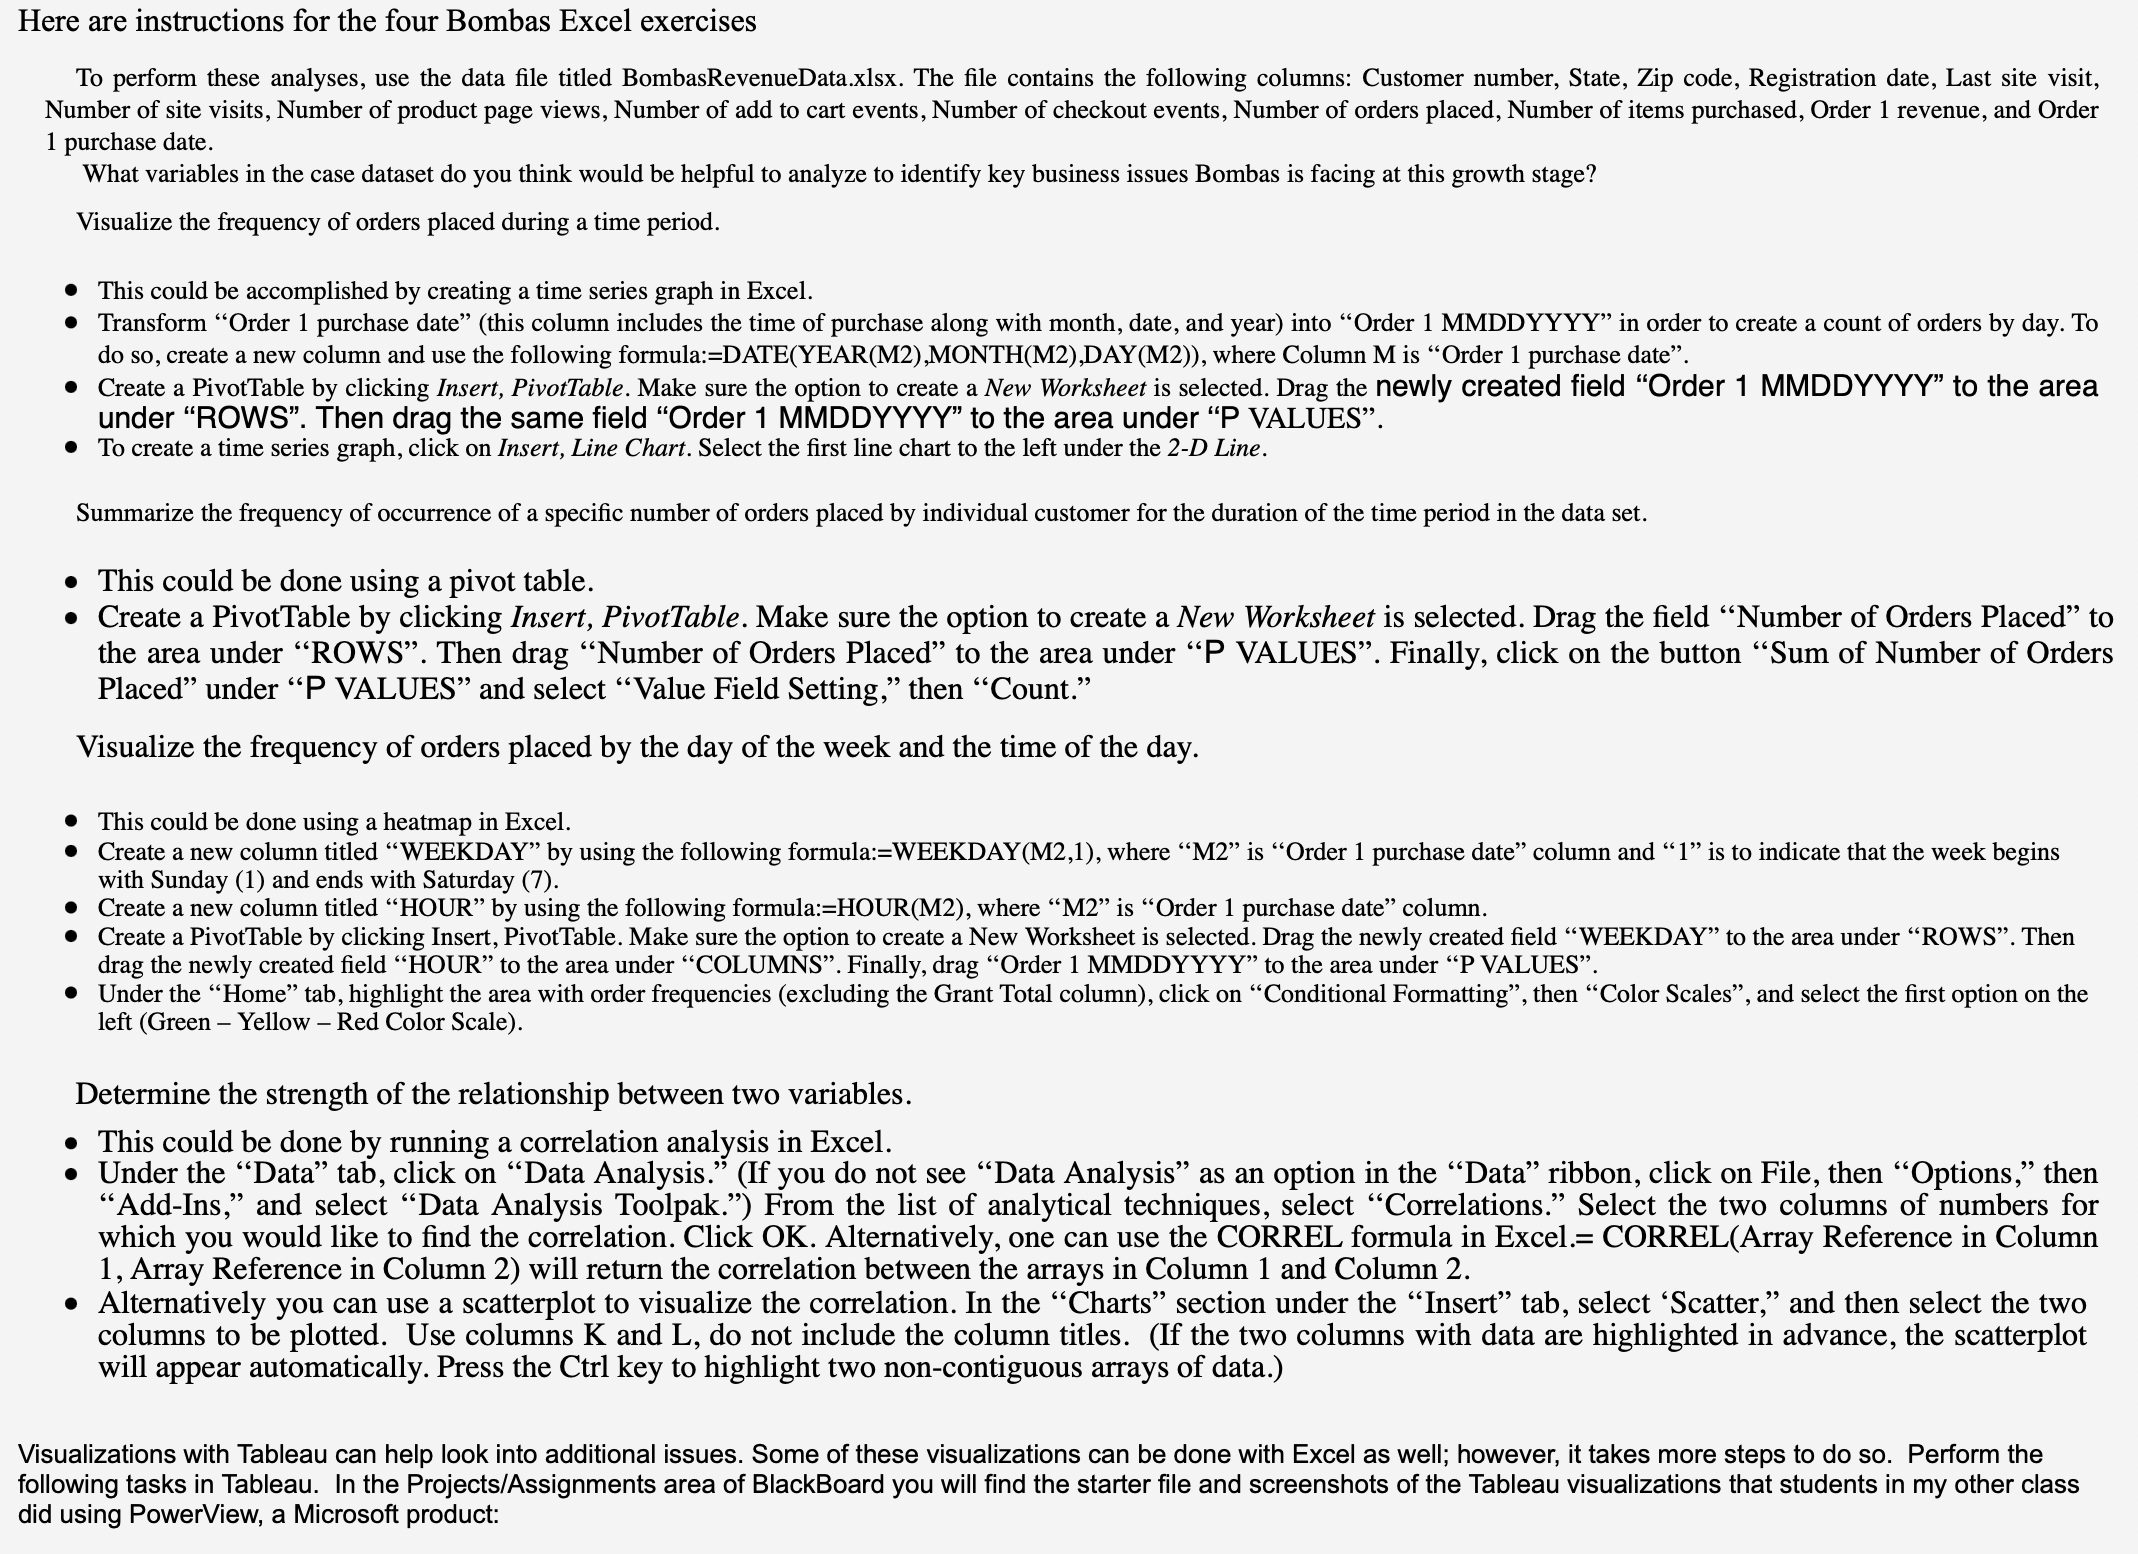
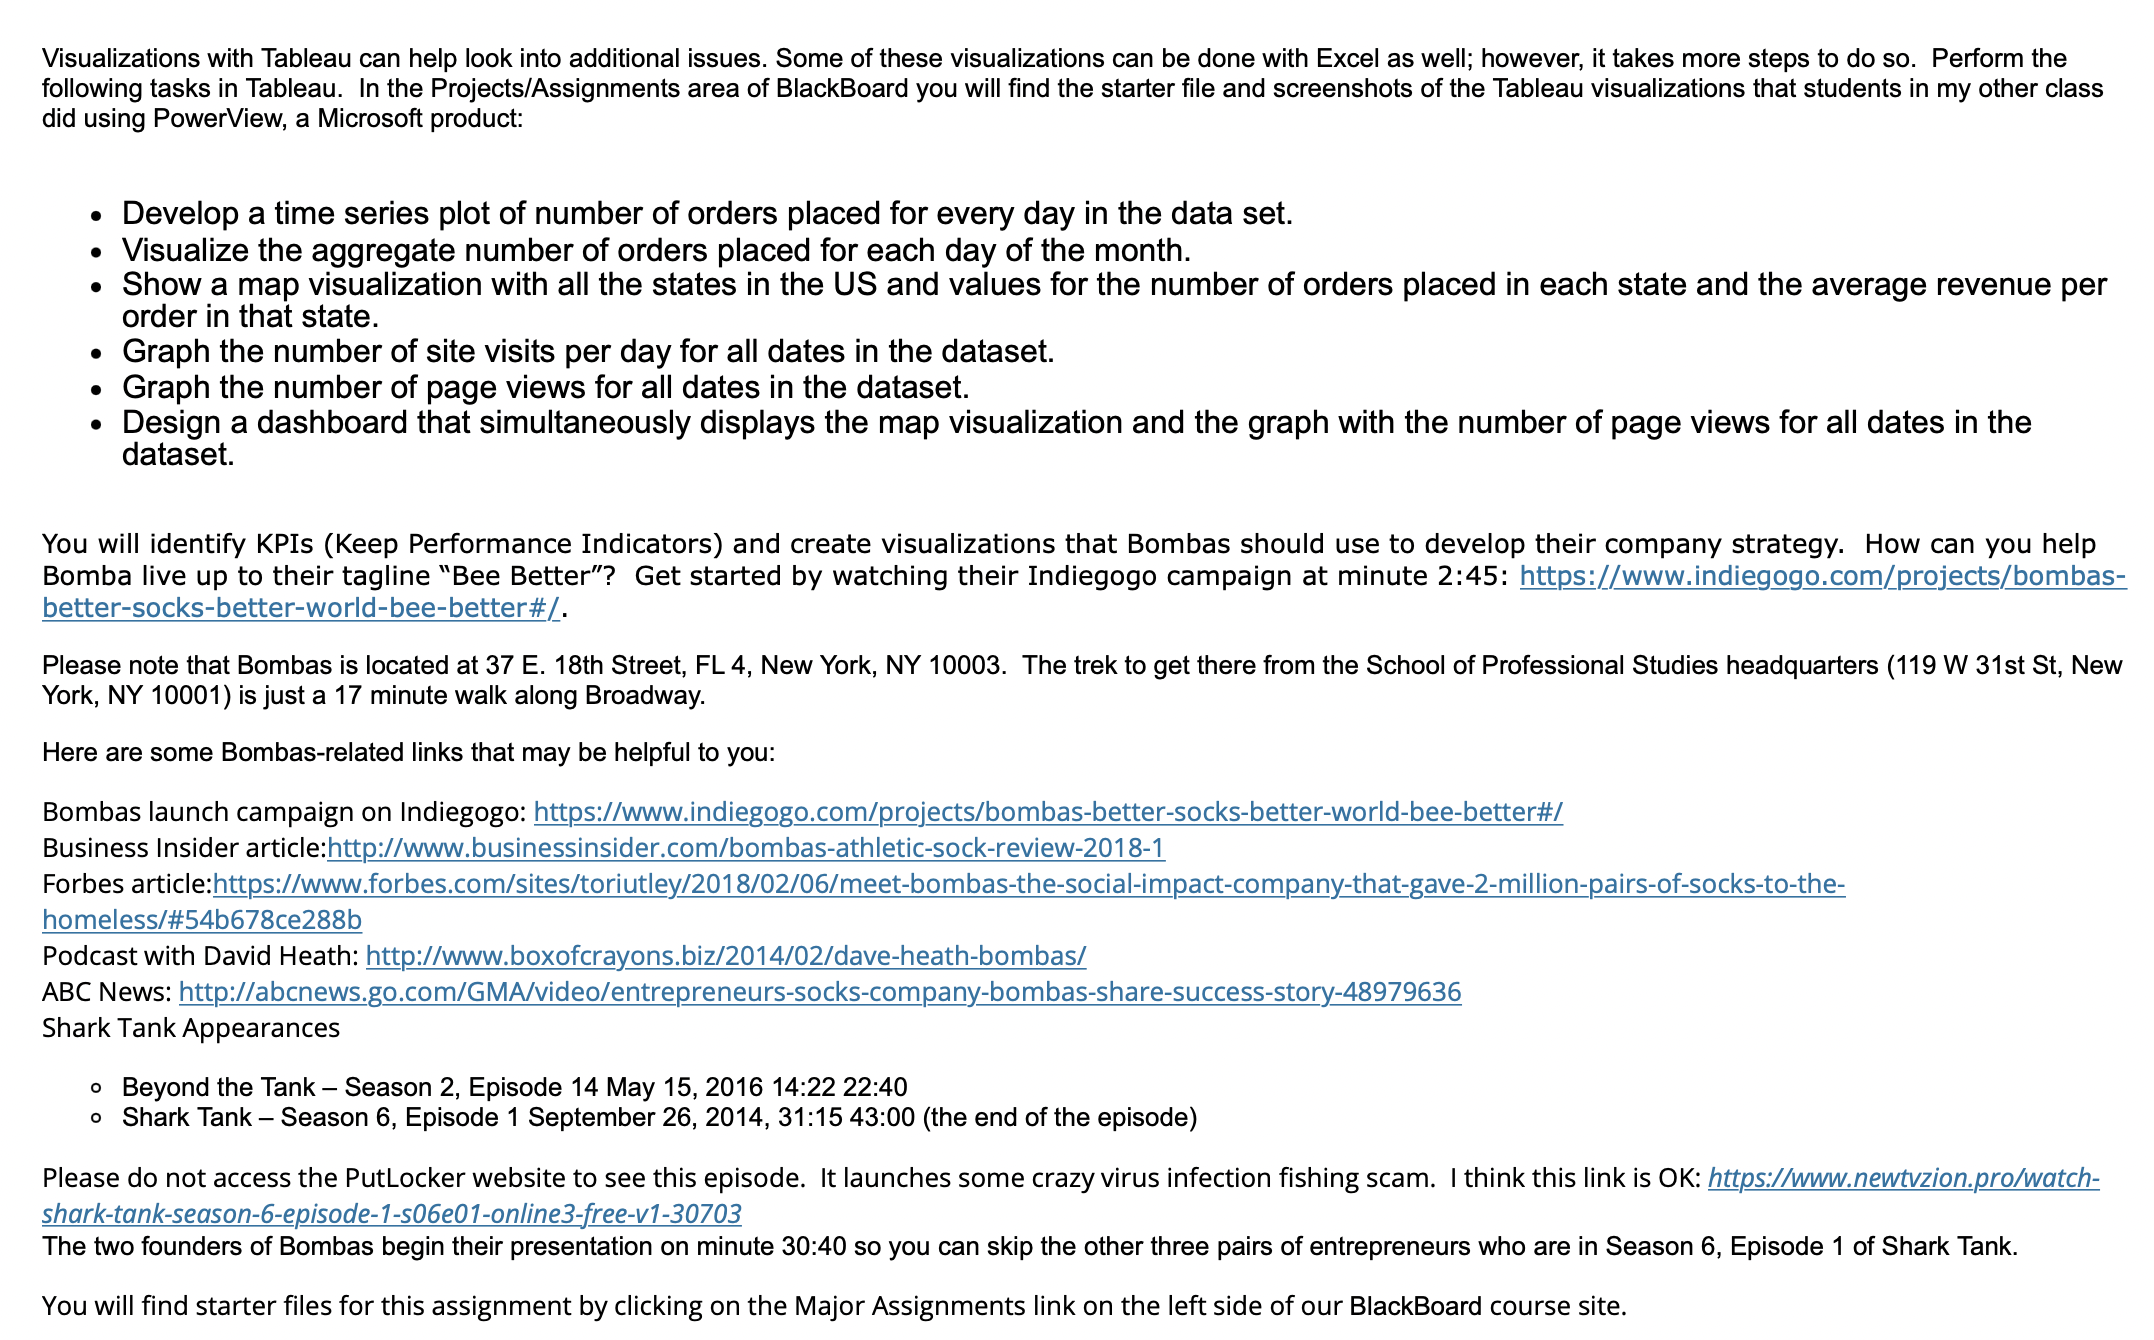
Bombas Company Case Study (Week 10) The article describing this case is attached; a synopsis of the case is available: http://dx.doi.org/10.1016/j.jaccedu.2016.12.005. The role of data visualization and analytics in performance management Guiding entrepreneurial growth decisions.pdf At. The citation for this article is: Kokina, Julia, Dessislava Pachamanova, and Andrew Corbett. "The role of data visualization and analytics in performance management: Guiding entrepreneurial growth decisions." Journal of Accounting Education 38 (2018): 50-62. You do not have to read the whole article, focus on pages 50 through 53. I have included the Appendix A steps below because Appendix A in the article has mistakes in it. The first part of Appendix A lists four analysis steps using Excel that are required for this assignment even though our focus is on Tableau. Here are the four analysis steps you will do in Excel: Visualize the frequency of orders placed during a time period; Summarize the frequency of occurrence of a specific number of orders placed by individual customers for the duration of the time period in the data set; Visualize the frequency of orders placed by the day of the week and the time of the day; Determine the strength of the relationship between two variables. I have provided step-by-step instructions for the Excel work, however if you would like instructions with pictures perhaps this tutorial will help you create the first Excel visualization which is to "Visualize the frequency of orders placed during a time period." I just Googled "Visualize the frequency of orders placed during a time period" and found this tutorial which may be more helpful to some of you: https://medium.com/berkeleyischool/how-to-create-a-visualization-showing-events-on-time-series-data-in-excel- 96abbc1475e0 Here are instructions for the four Bombas Excel exercises To perform these analyses, use the data file titled Bombas RevenueData.xlsx. The file contains the following columns: Customer number, State, Zip code, Registration date, Last site visit, Number of site visits, Number of product page views, Number of add to cart events, Number of checkout events, Number of orders placed, Number of items purchased, Order 1 revenue, and Order 1 purchase date. What variables in the case dataset do you think would be helpful to analyze to identify key business issues Bombas is facing at this growth stage? Visualize the frequency of orders placed during a time period. This could be accomplished by creating a time series graph in Excel. Transform "Order 1 purchase date" (this column includes the time of purchase along with month, date, and year) into "Order 1 MMDDYYYY" in order to create a count of orders by day. To do so, create a new column and use the following formula:=DATE(YEAR(M2),MONTH(M2),DAY(M2)), where Column M is "Order 1 purchase date". Create a PivotTable by clicking Insert, PivotTable. Make sure the option to create a New Worksheet is selected. Drag the newly created field "Order 1 MMDDYYYY" to the area under "ROWS". Then drag the same field "Order 1 MMDDYYYY" to the area under "P VALUES". To create a time series graph, click on Insert, Line Chart. Select the first line chart to the left under the 2-D Line. Summarize the frequency of occurrence of a specific number of orders placed by individual customer for the duration of the time period in the data set. This could be done using a pivot table. Create a PivotTable by clicking Insert, PivotTable. Make sure the option to create a New Worksheet is selected. Drag the field "Number of Orders Placed" to the area under "ROWS". Then drag "Number of Orders Placed" to the area under "P VALUES". Finally, click on the button "Sum of Number of Orders Placed" under "P VALUES" and select "Value Field Setting," then "Count." Visualize the frequency of orders placed by the day of the week and the time of the day. This could be done using a heatmap in Excel. Create a new column titled "WEEKDAY by using the following formula:=WEEKDAY(M2,1), where "M2 is "Order 1 purchase date" column and "1" is to indicate that the week begins with Sunday (1) and ends with Saturday (7). . Create a new column titled "HOUR by using the following formula:=HOUR(M2), where "M2" is "Order 1 purchase date" column. Create a PivotTable by clicking Insert, PivotTable. Make sure the option to create a New Worksheet is selected. Drag the newly created field "WEEKDAY" to the area under "ROWS". Then drag the newly created field HOUR" to the area under COLUMNS". Finally, drag "Order 1 MMDDYYYY" to the area under "P VALUES". Under the "Home" tab, highlight the area with order frequencies (excluding the Grant Total column), click on Conditional Formatting", then "Color Scales", and select the first option on the left (Green Yellow - Red Color Scale). Determine the strength of the relationship between two variables. This could be done by running a correlation analysis in Excel. Under the "Data" tab, click on "Data Analysis." (If you do not see "Data Analysis" as an option in the "Data" ribbon, click on File, then "Options," then "Add-Ins," and select "Data Analysis Toolpak.") From the list of analytical techniques, select "Correlations." Select the two columns of numbers for which you would like to find the correlation. Click OK. Alternatively, one can use the CORREL formula in Excel.= CORREL(Array Reference in Column 1, Array Reference in Column 2) will return the correlation between the arrays in Column 1 and Column 2. Alternatively you can use a scatterplot to visualize the correlation. In the "Charts" section under the "Insert" tab, select 'Scatter," and then select the two columns to be plotted. Use columns K and L, do not include the column titles. (If the two columns with data are highlighted in advance, the scatterplot will appear automatically. Press the Ctrl key to highlight two non-contiguous arrays of data.) Visualizations with Tableau can help look into additional issues. Some of these visualizations can be done with Excel as well; however, it takes more steps to do so. Perform the following tasks in Tableau. In the Projects/Assignments area of BlackBoard you will find the starter file and screenshots of the Tableau visualizations that students in my other class did using PowerView, a Microsoft product: Visualizations with Tableau can help look into additional issues. Some of these visualizations can be done with Excel as well; however, it takes more steps to do so. Perform the following tasks in Tableau. In the Projects/Assignments area of BlackBoard you will find the starter file and screenshots of the Tableau visualizations that students in my other class did using PowerView, a Microsoft product: Develop a time series plot of number of orders placed for every day in the data set. Visualize the aggregate number of orders placed for each day of the month. Show a map visualization with all the states in the US and values for the number of orders placed in each state and the average revenue per order in that state. Graph the number of site visits per day for all dates in the dataset. Graph the number of page views for all dates in the dataset. Design a dashboard that simultaneously displays the map visualization and the graph with the number of page views for all dates in the dataset. You will identify KPIs (Keep Performance Indicators) and create visualizations that Bombas should use to develop their company strategy. How can you help Bomba live up to their tagline "Bee Better"? Get started by watching their Indiegogo campaign at minute 2:45: https://www.indiegogo.com/projects/bombas- better-socks-better-world-bee-better#/. Please note that Bombas is located at 37 E. 18th Street, FL 4, New York, NY 10003. The trek to get there from the School of Professional Studies headquarters (119 W 31st St, New York, NY 10001) is just a 17 minute walk along Broadway. Here are some Bombas-related links that may be helpful to you: Bombas launch campaign on Indiegogo: https://www.indiegogo.com/projects/bombas-better-socks-better-world-bee-better#/ Business Insider article:http://www.businessinsider.com/bombas-athletic-sock-review-2018-1 Forbes article:https://www.forbes.com/sites/toriutley/2018/02/06/meet-bombas-the-social-impact-company-that-gave-2-million-pairs-of-socks-to-the- homeless/#54b678ce288b Podcast with David Heath: http://www.boxofcrayons.biz/2014/02/dave-heath-bombas/ ABC News: http://abcnews.go.com/GMA/video/entrepreneurs-socks-company-bombas-share-success-story-48979636 Shark Tank Appearances Beyond the Tank - Season 2, Episode 14 May 15, 2016 14:22 22:40 Shark Tank - Season 6, Episode 1 September 26, 2014, 31:15 43:00 (the end of the episode) Please do not access the PutLocker website to see this episode. It launches some crazy virus infection fishing scam. I think this link is OK: https://www.newtvzion.pro/watch- shark-tank-season-6-episode-1-s06e01-online3-free-v1-30703 The two founders of Bombas begin their presentation on minute 30:40 so you can skip the other three pairs of entrepreneurs who are in Season 6, Episode 1 of Shark Tank. You will find starter files for this assignment by clicking on the Major Assignments link on the left side of our BlackBoard course site. Bombas Company Case Study (Week 10) The article describing this case is attached; a synopsis of the case is available: http://dx.doi.org/10.1016/j.jaccedu.2016.12.005. The role of data visualization and analytics in performance management Guiding entrepreneurial growth decisions.pdf At. The citation for this article is: Kokina, Julia, Dessislava Pachamanova, and Andrew Corbett. "The role of data visualization and analytics in performance management: Guiding entrepreneurial growth decisions." Journal of Accounting Education 38 (2018): 50-62. You do not have to read the whole article, focus on pages 50 through 53. I have included the Appendix A steps below because Appendix A in the article has mistakes in it. The first part of Appendix A lists four analysis steps using Excel that are required for this assignment even though our focus is on Tableau. Here are the four analysis steps you will do in Excel: Visualize the frequency of orders placed during a time period; Summarize the frequency of occurrence of a specific number of orders placed by individual customers for the duration of the time period in the data set; Visualize the frequency of orders placed by the day of the week and the time of the day; Determine the strength of the relationship between two variables. I have provided step-by-step instructions for the Excel work, however if you would like instructions with pictures perhaps this tutorial will help you create the first Excel visualization which is to "Visualize the frequency of orders placed during a time period." I just Googled "Visualize the frequency of orders placed during a time period" and found this tutorial which may be more helpful to some of you: https://medium.com/berkeleyischool/how-to-create-a-visualization-showing-events-on-time-series-data-in-excel- 96abbc1475e0 Here are instructions for the four Bombas Excel exercises To perform these analyses, use the data file titled Bombas RevenueData.xlsx. The file contains the following columns: Customer number, State, Zip code, Registration date, Last site visit, Number of site visits, Number of product page views, Number of add to cart events, Number of checkout events, Number of orders placed, Number of items purchased, Order 1 revenue, and Order 1 purchase date. What variables in the case dataset do you think would be helpful to analyze to identify key business issues Bombas is facing at this growth stage? Visualize the frequency of orders placed during a time period. This could be accomplished by creating a time series graph in Excel. Transform "Order 1 purchase date" (this column includes the time of purchase along with month, date, and year) into "Order 1 MMDDYYYY" in order to create a count of orders by day. To do so, create a new column and use the following formula:=DATE(YEAR(M2),MONTH(M2),DAY(M2)), where Column M is "Order 1 purchase date". Create a PivotTable by clicking Insert, PivotTable. Make sure the option to create a New Worksheet is selected. Drag the newly created field "Order 1 MMDDYYYY" to the area under "ROWS". Then drag the same field "Order 1 MMDDYYYY" to the area under "P VALUES". To create a time series graph, click on Insert, Line Chart. Select the first line chart to the left under the 2-D Line. Summarize the frequency of occurrence of a specific number of orders placed by individual customer for the duration of the time period in the data set. This could be done using a pivot table. Create a PivotTable by clicking Insert, PivotTable. Make sure the option to create a New Worksheet is selected. Drag the field "Number of Orders Placed" to the area under "ROWS". Then drag "Number of Orders Placed" to the area under "P VALUES". Finally, click on the button "Sum of Number of Orders Placed" under "P VALUES" and select "Value Field Setting," then "Count." Visualize the frequency of orders placed by the day of the week and the time of the day. This could be done using a heatmap in Excel. Create a new column titled "WEEKDAY by using the following formula:=WEEKDAY(M2,1), where "M2 is "Order 1 purchase date" column and "1" is to indicate that the week begins with Sunday (1) and ends with Saturday (7). . Create a new column titled "HOUR by using the following formula:=HOUR(M2), where "M2" is "Order 1 purchase date" column. Create a PivotTable by clicking Insert, PivotTable. Make sure the option to create a New Worksheet is selected. Drag the newly created field "WEEKDAY" to the area under "ROWS". Then drag the newly created field HOUR" to the area under COLUMNS". Finally, drag "Order 1 MMDDYYYY" to the area under "P VALUES". Under the "Home" tab, highlight the area with order frequencies (excluding the Grant Total column), click on Conditional Formatting", then "Color Scales", and select the first option on the left (Green Yellow - Red Color Scale). Determine the strength of the relationship between two variables. This could be done by running a correlation analysis in Excel. Under the "Data" tab, click on "Data Analysis." (If you do not see "Data Analysis" as an option in the "Data" ribbon, click on File, then "Options," then "Add-Ins," and select "Data Analysis Toolpak.") From the list of analytical techniques, select "Correlations." Select the two columns of numbers for which you would like to find the correlation. Click OK. Alternatively, one can use the CORREL formula in Excel.= CORREL(Array Reference in Column 1, Array Reference in Column 2) will return the correlation between the arrays in Column 1 and Column 2. Alternatively you can use a scatterplot to visualize the correlation. In the "Charts" section under the "Insert" tab, select 'Scatter," and then select the two columns to be plotted. Use columns K and L, do not include the column titles. (If the two columns with data are highlighted in advance, the scatterplot will appear automatically. Press the Ctrl key to highlight two non-contiguous arrays of data.) Visualizations with Tableau can help look into additional issues. Some of these visualizations can be done with Excel as well; however, it takes more steps to do so. Perform the following tasks in Tableau. In the Projects/Assignments area of BlackBoard you will find the starter file and screenshots of the Tableau visualizations that students in my other class did using PowerView, a Microsoft product: Visualizations with Tableau can help look into additional issues. Some of these visualizations can be done with Excel as well; however, it takes more steps to do so. Perform the following tasks in Tableau. In the Projects/Assignments area of BlackBoard you will find the starter file and screenshots of the Tableau visualizations that students in my other class did using PowerView, a Microsoft product: Develop a time series plot of number of orders placed for every day in the data set. Visualize the aggregate number of orders placed for each day of the month. Show a map visualization with all the states in the US and values for the number of orders placed in each state and the average revenue per order in that state. Graph the number of site visits per day for all dates in the dataset. Graph the number of page views for all dates in the dataset. Design a dashboard that simultaneously displays the map visualization and the graph with the number of page views for all dates in the dataset. You will identify KPIs (Keep Performance Indicators) and create visualizations that Bombas should use to develop their company strategy. How can you help Bomba live up to their tagline "Bee Better"? Get started by watching their Indiegogo campaign at minute 2:45: https://www.indiegogo.com/projects/bombas- better-socks-better-world-bee-better#/. Please note that Bombas is located at 37 E. 18th Street, FL 4, New York, NY 10003. The trek to get there from the School of Professional Studies headquarters (119 W 31st St, New York, NY 10001) is just a 17 minute walk along Broadway. Here are some Bombas-related links that may be helpful to you: Bombas launch campaign on Indiegogo: https://www.indiegogo.com/projects/bombas-better-socks-better-world-bee-better#/ Business Insider article:http://www.businessinsider.com/bombas-athletic-sock-review-2018-1 Forbes article:https://www.forbes.com/sites/toriutley/2018/02/06/meet-bombas-the-social-impact-company-that-gave-2-million-pairs-of-socks-to-the- homeless/#54b678ce288b Podcast with David Heath: http://www.boxofcrayons.biz/2014/02/dave-heath-bombas/ ABC News: http://abcnews.go.com/GMA/video/entrepreneurs-socks-company-bombas-share-success-story-48979636 Shark Tank Appearances Beyond the Tank - Season 2, Episode 14 May 15, 2016 14:22 22:40 Shark Tank - Season 6, Episode 1 September 26, 2014, 31:15 43:00 (the end of the episode) Please do not access the PutLocker website to see this episode. It launches some crazy virus infection fishing scam. I think this link is OK: https://www.newtvzion.pro/watch- shark-tank-season-6-episode-1-s06e01-online3-free-v1-30703 The two founders of Bombas begin their presentation on minute 30:40 so you can skip the other three pairs of entrepreneurs who are in Season 6, Episode 1 of Shark Tank. You will find starter files for this assignment by clicking on the Major Assignments link on the left side of our BlackBoard course site.
Expert Answer:

Related Book For 

Posted Date:
Students also viewed these law questions
-
This assignment requires you to complete the 2022 tax reporting for a fictional woman named Anna Smith. Question 1 T1 - step 4 - line 66 This is Anna's taxable income Answer: Question 2 T1 - step...
-
THIRD AVENUE SOFTWARE HEALTH-CARE APP PROJECT This case is new for the ninth edition of Information Technology Project Management . The case provides an opportunity to apply agile and Scrum...
-
Joshua Tree Inc. reported that at the end of 2012 net accounts receivable of 2,050 (the net value at the end of 2011 was 1,090). Their allowance for doubtful accounts at the end of 2012 was 150 (the...
-
Use the diagram from Exercise 5 to answer each question. In Exercise 5 a. Use the multiplication rule to find the probability of each path. b. Are the paths equally likely? Explain. c. What is the...
-
The Home Depot, Inc. reported the following data in its 2009 Annual Report (for the fiscal year ended January 31, 2010): Analyze: 1. What percentage of total current liabilities is made up of accrued...
-
The two segments of the wire in Figure P22.59 have equal diameters and equal lengths but different resistivities \(ho_{1}\) and \(ho_{2}\) Current \(I\) passes through this wire. If the resistivities...
-
On 30 June 2012, Crawford Company estimated that 1.5% of its net sales of $400,000 will become uncollectable. The company recorded this amount as an addition to Allowance for Doubtful Debts. On 11...
-
In a group of two members, design and develop a Java program that performs simple calculation. Your program will read in values and operation to be calculated from the user and display the result....
-
If you had to lead a redesign project at your organization, what would you do? How would you launch the project? How would you manage it? How would you measure it? Please add references:
-
Name three sources of data for sports marketing. How might a marketer use these data?
-
Livingston Lures develops and markets electronic fishing lures that emit various sounds associated with baitfish. This feature makes a Livingston Lure much more effective than traditional lures...
-
How do experts expect the Internet of Things to transform the marketing research industry?
-
Belk has a chain of department stores across the South. Top management requires that each store manager collect, maintain, and respond to customer complaints (emails, letters, calls, etc.). Each...
-
How do packaged services differ from syndicated data?
-
Describe in detail and elaborate on the relationship era of marketing.
-
Imagine a sound wave with a frequency of 1.10 kHz propagating with a speed of 330 m/s. Determine the phase difference in radians between any two points on the wave separated by 10.0 cm.
-
The change in the annual spending rate, in conjunction with the boards expectations regarding future enrollment and the need for endowment support, could justify that KUEs target weight for: A....
-
Which of the characteristics put forth by Chaterji to describe the factor-based approach is/are correct? A. Only Characteristic 1 B. Only Characteristic 2 C. Both Characteristic 1 and Characteristic...
-
Based on Exhibits 1 and 2, to attempt to profit from the short-term excess return forecast, Capara should increase KUEs portfolio allocation to: A. developed markets equity and decrease its...

Study smarter with the SolutionInn App