Question: BS3619 SECTION B Answer two questions only from this section Give a summary of the basic EOQ Model assumptions, as given in your lectures. (3
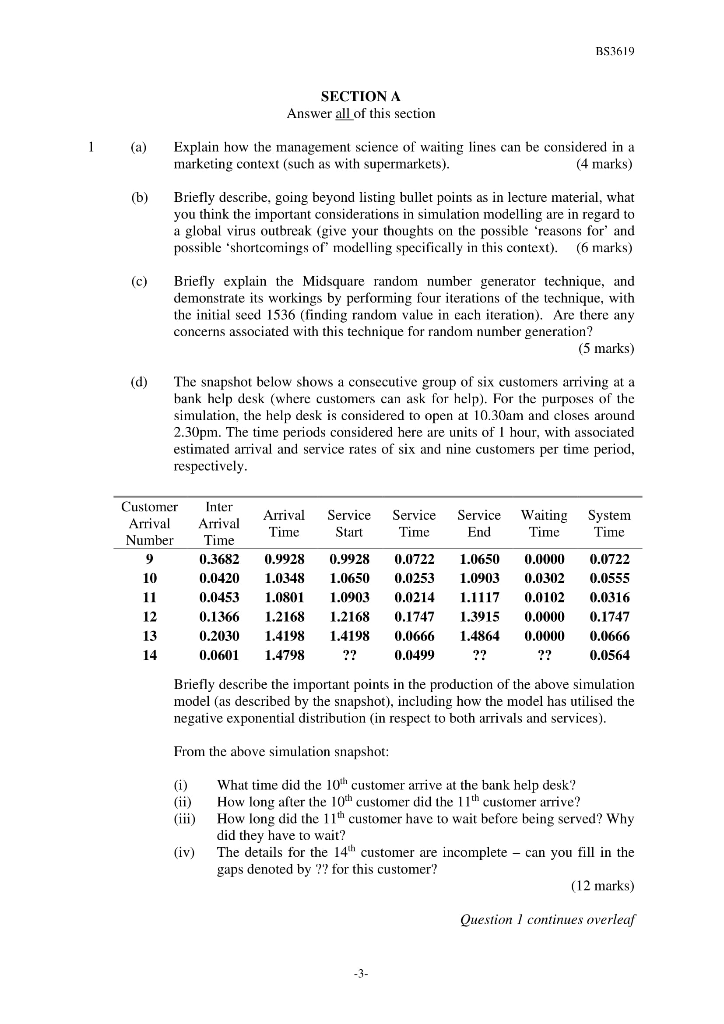
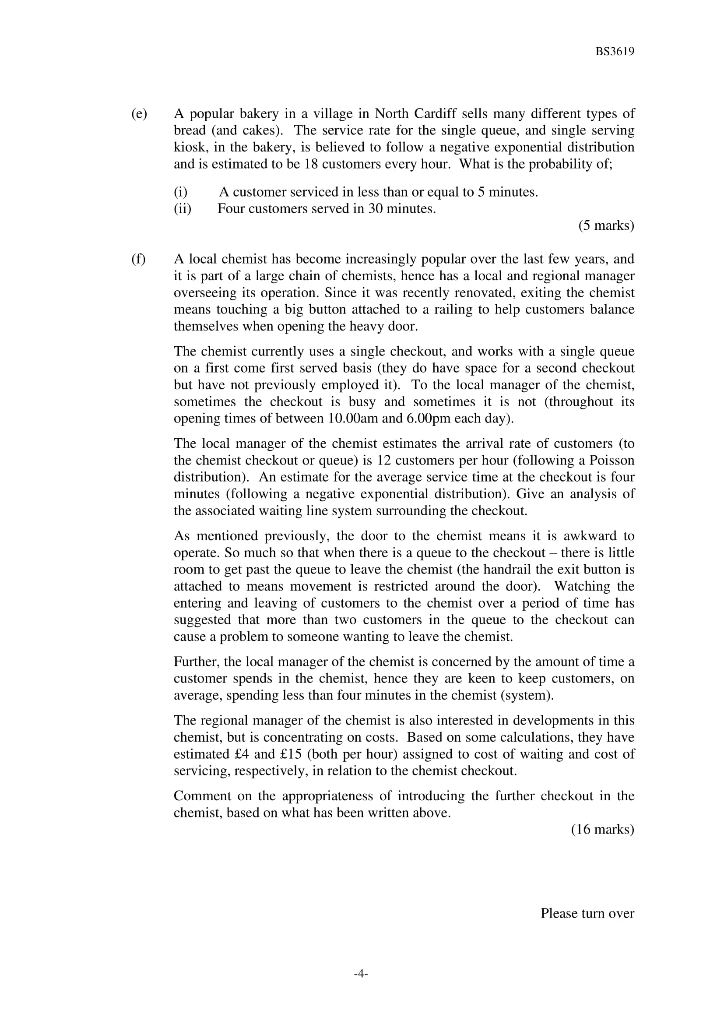
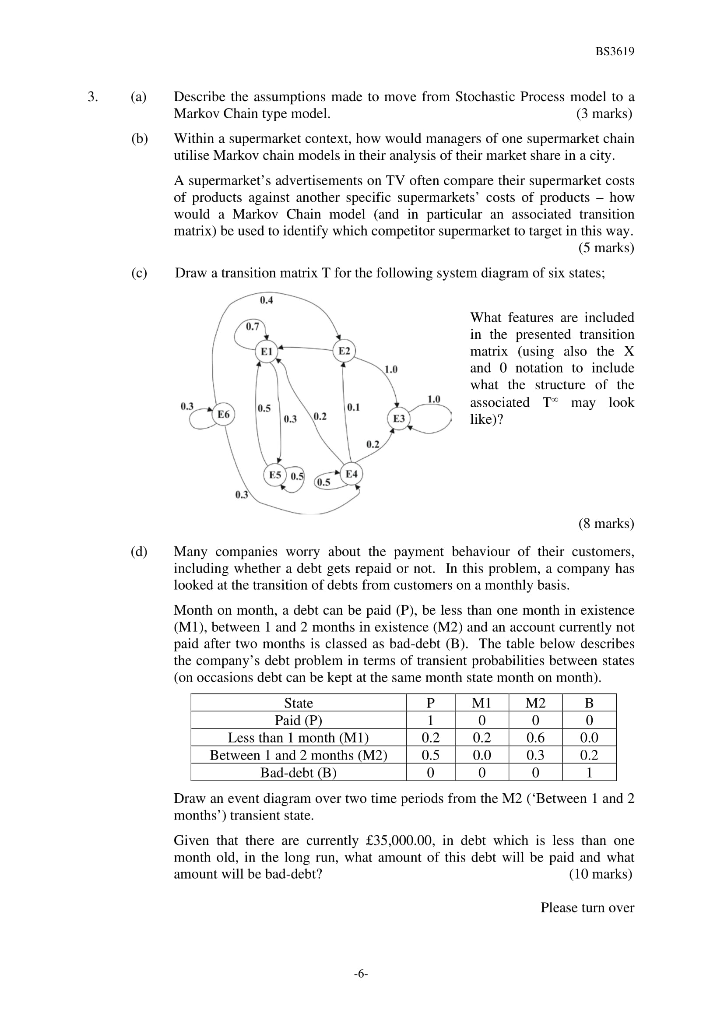
BS3619 SECTION B Answer two questions only from this section Give a summary of the basic EOQ Model assumptions, as given in your lectures. (3 marks) 2 (a) (b) Explain the construction (with the aid of a diagram) of the formula for the planned shortage economic order quantity model, including the expression for the total cost of inventory in this case. Include also an explanation of other factors associated within this model in the diagram constructed. (5 marks) (c) A chemical factory produces medicine for use in hospitals. An important key ingredient for one medicine in high demand (with hospitals needing the medicine as soon as it is produced) is here called Nitrium (not its real name). Demand for this chemical is around 50 capsules per day, with each pack of 5 capsules costing 20.00 (but can be bought individually also at same relative price). The chemical plant operates all 364 days of the considered year. Their current inventory management scheme for this chemical (capsules), is through the ordering of 4550 capsules (or 910 packs) roughly every three months (an order all arrives at the same time and no shortages). Also associated with this model are the estimated cost of ordering at 20 per order and cost of holding is 15% the unit price. Comment on the current inventory management position regarding these packs of chemicals. Is there room for improvement in their inventory policy based on the evidence given (using an inventory management model you are acquainted with from your lectures)? A newly appointed operations manager, who came from the car industry, has suggested they work towards a planned shortages model (as they had in the car industry). They have done some research and believe the cost of backordering this chemical is 6 per backorder (per capsule). What further advice can you give to the managers of the chemical plant, in regard to the inventory management of the capsules of the chemical? For only the most cost-effective model in your analysis, knowing there is a lead time of 20 days for ordering this chemical, what is the associated reorder point? Draw a well labelled inventory-time diagram for the most cost-effective inventory model. What other thoughts do you have on your answers and subsequent conclusions on this problem (13 marks) (d) Describe mathematically and in words the conditions that certain inventory models converge to the basic EOQ model, which you have considered? (5 marks) -5- BS.3619 SECTION A Answer all of this section Explain how the management science of waiting lines can be considered in a marketing context (such as with supermarkets). (4 marks) (b) Briefly describe, going beyond listing bullet points as in lecture material, what you think the important considerations in simulation modelling are in regard to a global virus outbreak (give your thoughts on the possible 'reasons for' and possible 'shortcomings of modelling specifically in this context). (6 marks) (c) Briefly explain the Midsquare random number generator technique, and demonstrate its workings by performing four iterations of the technique, with the initial seed 1536 (finding random value in each iteration). Are there any concerns associated with this technique for random number generation? (5 marks) (d) The snapshot below shows a consecutive group of six customers arriving at a bank help desk (where customers can ask for help). For the purposes of the simulation, the help desk is considered to open at 10.30am and closes around 2.30pm. The time periods considered here are units of 1 hour, with associated estimated arrival and service rates of six and nine customers per time period, respectively. Arrival Service Start Service Time Service End Waiting Time System Time Time Customer Arrival Number 9 10 11 12 13 14 Inter Arrival Time 0.3682 0.0420 0.0453 0.1366 0.2030 0.0601 0.9928 1.0348 1.0801 1.2168 1.4198 1.4798 0.9928 1.0650 1.0903 1.2168 1.4198 0.0722 0.0253 0.0214 0.1747 0.0666 0.0499 1.0650 1.0903 1.1117 1.3915 1.4864 ?? 0.0000 0.0302 0.0102 0.0000 0.0000 ?? 0.0722 0.0555 0.0316 0.1747 0.0666 0.0564 Briefly describe the important points in the production of the above simulation model (as described by the snapshot), including how the model has utilised the negative exponential distribution (in respect to both arrivals and services). From the above simulation snapshot: (1) What time did the 10th customer arrive at the bank help desk? How long after the 10th customer did the 11th customer arrive? How long did the 11 customer have to wait before being served? Why did they have to wait? The details for the 14th customer are incomplete - can you fill in the gaps denoted by ?? for this customer? (12 marks) (iv) Question 1 continues overleaf BS3619 (e) A popular bakery in a village in North Cardiff sells many different types of bread (and cakes). The service rate for the single queue, and single serving kiosk, in the bakery, is believed to follow a negative exponential distribution and is estimated to be 18 customers every hour. What is the probability of; (i) A customer serviced in less than or equal to 5 minutes. Four customers served in 30 minutes. (5 marks) (1) A local chemist has become increasingly popular over the last few years, and it is part of a large chain of chemists, hence has a local and regional manager overseeing its operation. Since it was recently renovated, exiting the chemist means touching a big button attached to a railing to help customers balance themselves when opening the heavy door. The chemist currently uses a single checkout, works with a single queue on a first come first served basis (they do have space for a second checkout but have not previously employed it). To the local manager of the chemist, sometimes the checkout is busy and sometimes it is not throughout its opening times of between 10.00am and 6.00pm each day). The local manager of the chemist estimates the arrival rate of customers (to the chemist checkout or queue) is 12 customers per hour (following a Poisson distribution). An estimate for the average service time at the checkout is four minutes (following a negative exponential distribution). Give an analysis of the associated waiting line system surrounding the checkout. As mentioned previously, the door to the chemist means it is awkward to operate. So much so that when there is a queue to the checkout - there is little room to get past the queue to leave the chemist (the handrail the exit button is attached to means movement is restricted around the door). Watching the entering and leaving of customers to the chemist over a period of time has suggested that more than two customers in the queue to the checkout can cause a problem to someone wanting to leave the chemist. Further, the local manager of the chemist is concerned by the amount of time a customer spends in the chemist, hence they are keen to keep customers, on average, spending less than four minutes in the chemist (system). The regional manager of the chemist is also interested in developments in this chemist, but is concentrating on costs. Based on some calculations, they have estimated 4 and 15 (both per hour) assigned to cost of waiting and cost of servicing, respectively, in relation to the chemist checkout. Comment on the appropriateness of introducing the further checkout in the chemist, based on what has been written above. (16 marks) Please turn over -4- BS3619 3. (a) (b) Describe the assumptions made to move from Stochastic Process model to a Markov Chain type model. (3 marks) Within a supermarket context, how would managers of one supermarket chain utilise Markov chain models in their analysis of their market share in a city. A supermarket's advertisements on TV often compare their supermarket costs of products against another specific supermarkets' costs of products how would a Markov Chain model (and in particular an associated transition matrix) be used to identify which competitor supermarket to target in this way. (5 marks) Draw a transition matrix T for the following system diagram of six states; (c) 0.4 0.7 E2 1.0 What features are included in the presented transition matrix (using also the X and 0 notation to include what the structure of the associated T may look like)? 1.0 0.3 0.5 0.1 E6 0.3 0.2 Y E3 0.2 E5) 0.5 E4 0.5 0.3 (8 marks) (d) Many companies worry about the payment behaviour of their customers, including whether a debt gets repaid or not. In this problem, a company has looked at the transition of debts from customers on a monthly basis. Month on month, a debt can be paid (P), be less than one month in existence (MI), between 1 and 2 months in existence (M2) and an account currently not paid after two months is classed as bad-debt (B). The table below describes the company's debt problem in terms of transient probabilities between states (on occasions debt can be kept at the same month state month on month). State P M1 M2 B Paid (P) 0 0 Less than 1 month (MI) 0.2 0.2 0.0 Between 1 and 2 months (M2) 0.0 0.3 0.2 Bad-debt (B) 0 0 0 1 Draw an event diagram over two time periods from the M2 (Between 1 and 2 months') transient state. Given that there are currently 35,000.00, in debt which is less than one month old, in the long run, what amount of this debt will be paid and what amount will be bad-debt? (10 marks) 1 0 0.6 0.5 Please turn over -6- BS3619 4. (a) What is Management Science, including the associated three levels as described in your lectures? Comment on how you think the three levels of management science could have been considered regarding the current global virus pandemic. (7 marks) (b) A Welsh museum sells medium-sized Welsh flags with current year embroidered (sewn) onto it. They are bought by both tourists as well as sports fans who wave them at sporting events. They currently estimate demand for this Welsh flag is estimated to follow a normal distribution with mean 2,000 flags and standard deviation 300 flags. The medium-sized flags usually cost the museum 23.00 per flag. Unsold medium-sized flags, since they have the current year sewn on them, have a salvage costs estimated to be 8.00 each. If demand for flags exceeds available stock, quantities can be purchased at an additional cost of 3.00 each on their price to purchase a flag. By using the method of incremental analysis, which can be used to determine the optimal order quantity for a single period inventory model that has probabilistic demand, what is the recommended order quantity for the medium-sized flags? Draw a normal distribution graph to illustrate your evaluation of your answer. (5 marks) (c) Describe advantages and disadvantages associated with the Quantity Discount Model, as discussed in the lectures. (4 marks) (d) A local hospital uses a lot of face masks to protect their workers when dealing with infectious patients. The estimated annual demand for packs of 10 face mask is 15,000 packs. The hospital management are investigating the application of a quantity discount model to manage the inventory of these packs of face masks. Annual holding costs are 35% of the price of a pack of face masks and the ordering costs are 8.00 per order. The following discount price schedule is offered to the hospital manager by their supplier: Order quantity of packs 0 - 499 500 - 4,999 5,000+ Price per pack of face masks 4.00 3.79 3.69 Determine the optimal order quantity and the respective total annual inventory cost. Sketch a graph showing how the costs change for the different order quantity options expressed. (10 marks) -7x- BS3619 SECTION B Answer two questions only from this section Give a summary of the basic EOQ Model assumptions, as given in your lectures. (3 marks) 2 (a) (b) Explain the construction (with the aid of a diagram) of the formula for the planned shortage economic order quantity model, including the expression for the total cost of inventory in this case. Include also an explanation of other factors associated within this model in the diagram constructed. (5 marks) (c) A chemical factory produces medicine for use in hospitals. An important key ingredient for one medicine in high demand (with hospitals needing the medicine as soon as it is produced) is here called Nitrium (not its real name). Demand for this chemical is around 50 capsules per day, with each pack of 5 capsules costing 20.00 (but can be bought individually also at same relative price). The chemical plant operates all 364 days of the considered year. Their current inventory management scheme for this chemical (capsules), is through the ordering of 4550 capsules (or 910 packs) roughly every three months (an order all arrives at the same time and no shortages). Also associated with this model are the estimated cost of ordering at 20 per order and cost of holding is 15% the unit price. Comment on the current inventory management position regarding these packs of chemicals. Is there room for improvement in their inventory policy based on the evidence given (using an inventory management model you are acquainted with from your lectures)? A newly appointed operations manager, who came from the car industry, has suggested they work towards a planned shortages model (as they had in the car industry). They have done some research and believe the cost of backordering this chemical is 6 per backorder (per capsule). What further advice can you give to the managers of the chemical plant, in regard to the inventory management of the capsules of the chemical? For only the most cost-effective model in your analysis, knowing there is a lead time of 20 days for ordering this chemical, what is the associated reorder point? Draw a well labelled inventory-time diagram for the most cost-effective inventory model. What other thoughts do you have on your answers and subsequent conclusions on this problem (13 marks) (d) Describe mathematically and in words the conditions that certain inventory models converge to the basic EOQ model, which you have considered? (5 marks) -5- BS.3619 SECTION A Answer all of this section Explain how the management science of waiting lines can be considered in a marketing context (such as with supermarkets). (4 marks) (b) Briefly describe, going beyond listing bullet points as in lecture material, what you think the important considerations in simulation modelling are in regard to a global virus outbreak (give your thoughts on the possible 'reasons for' and possible 'shortcomings of modelling specifically in this context). (6 marks) (c) Briefly explain the Midsquare random number generator technique, and demonstrate its workings by performing four iterations of the technique, with the initial seed 1536 (finding random value in each iteration). Are there any concerns associated with this technique for random number generation? (5 marks) (d) The snapshot below shows a consecutive group of six customers arriving at a bank help desk (where customers can ask for help). For the purposes of the simulation, the help desk is considered to open at 10.30am and closes around 2.30pm. The time periods considered here are units of 1 hour, with associated estimated arrival and service rates of six and nine customers per time period, respectively. Arrival Service Start Service Time Service End Waiting Time System Time Time Customer Arrival Number 9 10 11 12 13 14 Inter Arrival Time 0.3682 0.0420 0.0453 0.1366 0.2030 0.0601 0.9928 1.0348 1.0801 1.2168 1.4198 1.4798 0.9928 1.0650 1.0903 1.2168 1.4198 0.0722 0.0253 0.0214 0.1747 0.0666 0.0499 1.0650 1.0903 1.1117 1.3915 1.4864 ?? 0.0000 0.0302 0.0102 0.0000 0.0000 ?? 0.0722 0.0555 0.0316 0.1747 0.0666 0.0564 Briefly describe the important points in the production of the above simulation model (as described by the snapshot), including how the model has utilised the negative exponential distribution (in respect to both arrivals and services). From the above simulation snapshot: (1) What time did the 10th customer arrive at the bank help desk? How long after the 10th customer did the 11th customer arrive? How long did the 11 customer have to wait before being served? Why did they have to wait? The details for the 14th customer are incomplete - can you fill in the gaps denoted by ?? for this customer? (12 marks) (iv) Question 1 continues overleaf BS3619 (e) A popular bakery in a village in North Cardiff sells many different types of bread (and cakes). The service rate for the single queue, and single serving kiosk, in the bakery, is believed to follow a negative exponential distribution and is estimated to be 18 customers every hour. What is the probability of; (i) A customer serviced in less than or equal to 5 minutes. Four customers served in 30 minutes. (5 marks) (1) A local chemist has become increasingly popular over the last few years, and it is part of a large chain of chemists, hence has a local and regional manager overseeing its operation. Since it was recently renovated, exiting the chemist means touching a big button attached to a railing to help customers balance themselves when opening the heavy door. The chemist currently uses a single checkout, works with a single queue on a first come first served basis (they do have space for a second checkout but have not previously employed it). To the local manager of the chemist, sometimes the checkout is busy and sometimes it is not throughout its opening times of between 10.00am and 6.00pm each day). The local manager of the chemist estimates the arrival rate of customers (to the chemist checkout or queue) is 12 customers per hour (following a Poisson distribution). An estimate for the average service time at the checkout is four minutes (following a negative exponential distribution). Give an analysis of the associated waiting line system surrounding the checkout. As mentioned previously, the door to the chemist means it is awkward to operate. So much so that when there is a queue to the checkout - there is little room to get past the queue to leave the chemist (the handrail the exit button is attached to means movement is restricted around the door). Watching the entering and leaving of customers to the chemist over a period of time has suggested that more than two customers in the queue to the checkout can cause a problem to someone wanting to leave the chemist. Further, the local manager of the chemist is concerned by the amount of time a customer spends in the chemist, hence they are keen to keep customers, on average, spending less than four minutes in the chemist (system). The regional manager of the chemist is also interested in developments in this chemist, but is concentrating on costs. Based on some calculations, they have estimated 4 and 15 (both per hour) assigned to cost of waiting and cost of servicing, respectively, in relation to the chemist checkout. Comment on the appropriateness of introducing the further checkout in the chemist, based on what has been written above. (16 marks) Please turn over -4- BS3619 3. (a) (b) Describe the assumptions made to move from Stochastic Process model to a Markov Chain type model. (3 marks) Within a supermarket context, how would managers of one supermarket chain utilise Markov chain models in their analysis of their market share in a city. A supermarket's advertisements on TV often compare their supermarket costs of products against another specific supermarkets' costs of products how would a Markov Chain model (and in particular an associated transition matrix) be used to identify which competitor supermarket to target in this way. (5 marks) Draw a transition matrix T for the following system diagram of six states; (c) 0.4 0.7 E2 1.0 What features are included in the presented transition matrix (using also the X and 0 notation to include what the structure of the associated T may look like)? 1.0 0.3 0.5 0.1 E6 0.3 0.2 Y E3 0.2 E5) 0.5 E4 0.5 0.3 (8 marks) (d) Many companies worry about the payment behaviour of their customers, including whether a debt gets repaid or not. In this problem, a company has looked at the transition of debts from customers on a monthly basis. Month on month, a debt can be paid (P), be less than one month in existence (MI), between 1 and 2 months in existence (M2) and an account currently not paid after two months is classed as bad-debt (B). The table below describes the company's debt problem in terms of transient probabilities between states (on occasions debt can be kept at the same month state month on month). State P M1 M2 B Paid (P) 0 0 Less than 1 month (MI) 0.2 0.2 0.0 Between 1 and 2 months (M2) 0.0 0.3 0.2 Bad-debt (B) 0 0 0 1 Draw an event diagram over two time periods from the M2 (Between 1 and 2 months') transient state. Given that there are currently 35,000.00, in debt which is less than one month old, in the long run, what amount of this debt will be paid and what amount will be bad-debt? (10 marks) 1 0 0.6 0.5 Please turn over -6- BS3619 4. (a) What is Management Science, including the associated three levels as described in your lectures? Comment on how you think the three levels of management science could have been considered regarding the current global virus pandemic. (7 marks) (b) A Welsh museum sells medium-sized Welsh flags with current year embroidered (sewn) onto it. They are bought by both tourists as well as sports fans who wave them at sporting events. They currently estimate demand for this Welsh flag is estimated to follow a normal distribution with mean 2,000 flags and standard deviation 300 flags. The medium-sized flags usually cost the museum 23.00 per flag. Unsold medium-sized flags, since they have the current year sewn on them, have a salvage costs estimated to be 8.00 each. If demand for flags exceeds available stock, quantities can be purchased at an additional cost of 3.00 each on their price to purchase a flag. By using the method of incremental analysis, which can be used to determine the optimal order quantity for a single period inventory model that has probabilistic demand, what is the recommended order quantity for the medium-sized flags? Draw a normal distribution graph to illustrate your evaluation of your answer. (5 marks) (c) Describe advantages and disadvantages associated with the Quantity Discount Model, as discussed in the lectures. (4 marks) (d) A local hospital uses a lot of face masks to protect their workers when dealing with infectious patients. The estimated annual demand for packs of 10 face mask is 15,000 packs. The hospital management are investigating the application of a quantity discount model to manage the inventory of these packs of face masks. Annual holding costs are 35% of the price of a pack of face masks and the ordering costs are 8.00 per order. The following discount price schedule is offered to the hospital manager by their supplier: Order quantity of packs 0 - 499 500 - 4,999 5,000+ Price per pack of face masks 4.00 3.79 3.69 Determine the optimal order quantity and the respective total annual inventory cost. Sketch a graph showing how the costs change for the different order quantity options expressed. (10 marks) -7x


