

By recognizing that your data set consists of smokers and nonsmokers, you gain tremendous power in...
Fantastic news! We've Found the answer you've been seeking!
Question:
Transcribed Image Text:
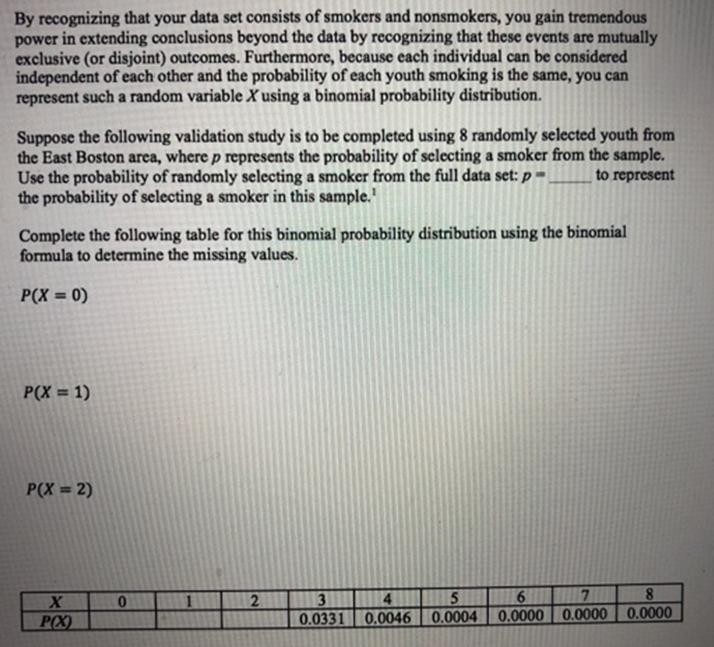
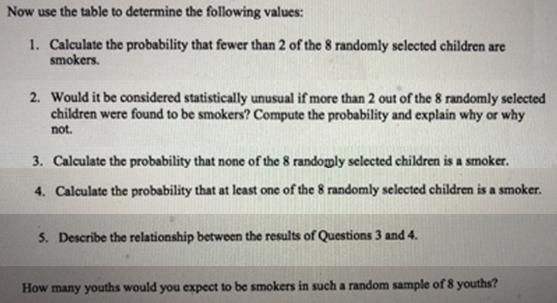
By recognizing that your data set consists of smokers and nonsmokers, you gain tremendous power in extending conclusions beyond the data by recognizing that these events are mutually exclusive (or disjoint) outcomes. Furthermore, because each individual can be considered independent of each other and the probability of each youth smoking is the same, you can represent such a random variable X using a binomial probability distribution. Suppose the following validation study is to be completed using 8 randomly selected youth from the East Boston area, where p represents the probability of selecting a smoker from the sample. Use the probability of randomly selecting a smoker from the full data set: p = the probability of selecting a smoker in this sample. to represent Complete the following table for this binomial probability distribution using the binomial formula to determine the missing values. P(X = 0) %3D P(X = 1) P(X = 2) 17 8. 6. 0.0000 0.0000 0.0000 01 1 3 P(X) 0.0331 0.0046 0.0004 Now use the table to determine the following values: 1. Calculate the probability that fewer than 2 of the 8 randomly selected children are smokers. 2. Would it be considered statistically unusual if more than 2 out of the 8 randomly selected children were found to be smokers? Compute the probability and explain why or why not. 3. Calculate the probability that none of the 8 randomly selected children is a smoker. 4. Calculate the probability that at least one of the 8 randomly selected children is a smoker. 5. Describe the relationship between the results of Questions 3 and 4. How many youths would you expect to be smokers in such a random sample of 8 youths? By recognizing that your data set consists of smokers and nonsmokers, you gain tremendous power in extending conclusions beyond the data by recognizing that these events are mutually exclusive (or disjoint) outcomes. Furthermore, because each individual can be considered independent of each other and the probability of each youth smoking is the same, you can represent such a random variable X using a binomial probability distribution. Suppose the following validation study is to be completed using 8 randomly selected youth from the East Boston area, where p represents the probability of selecting a smoker from the sample. Use the probability of randomly selecting a smoker from the full data set: p = the probability of selecting a smoker in this sample. to represent Complete the following table for this binomial probability distribution using the binomial formula to determine the missing values. P(X = 0) %3D P(X = 1) P(X = 2) 17 8. 6. 0.0000 0.0000 0.0000 01 1 3 P(X) 0.0331 0.0046 0.0004 Now use the table to determine the following values: 1. Calculate the probability that fewer than 2 of the 8 randomly selected children are smokers. 2. Would it be considered statistically unusual if more than 2 out of the 8 randomly selected children were found to be smokers? Compute the probability and explain why or why not. 3. Calculate the probability that none of the 8 randomly selected children is a smoker. 4. Calculate the probability that at least one of the 8 randomly selected children is a smoker. 5. Describe the relationship between the results of Questions 3 and 4. How many youths would you expect to be smokers in such a random sample of 8 youths? By recognizing that your data set consists of smokers and nonsmokers, you gain tremendous power in extending conclusions beyond the data by recognizing that these events are mutually exclusive (or disjoint) outcomes. Furthermore, because each individual can be considered independent of each other and the probability of each youth smoking is the same, you can represent such a random variable X using a binomial probability distribution. Suppose the following validation study is to be completed using 8 randomly selected youth from the East Boston area, where p represents the probability of selecting a smoker from the sample. Use the probability of randomly selecting a smoker from the full data set: p = the probability of selecting a smoker in this sample. to represent Complete the following table for this binomial probability distribution using the binomial formula to determine the missing values. P(X = 0) %3D P(X = 1) P(X = 2) 17 8. 6. 0.0000 0.0000 0.0000 01 1 3 P(X) 0.0331 0.0046 0.0004 Now use the table to determine the following values: 1. Calculate the probability that fewer than 2 of the 8 randomly selected children are smokers. 2. Would it be considered statistically unusual if more than 2 out of the 8 randomly selected children were found to be smokers? Compute the probability and explain why or why not. 3. Calculate the probability that none of the 8 randomly selected children is a smoker. 4. Calculate the probability that at least one of the 8 randomly selected children is a smoker. 5. Describe the relationship between the results of Questions 3 and 4. How many youths would you expect to be smokers in such a random sample of 8 youths? By recognizing that your data set consists of smokers and nonsmokers, you gain tremendous power in extending conclusions beyond the data by recognizing that these events are mutually exclusive (or disjoint) outcomes. Furthermore, because each individual can be considered independent of each other and the probability of each youth smoking is the same, you can represent such a random variable X using a binomial probability distribution. Suppose the following validation study is to be completed using 8 randomly selected youth from the East Boston area, where p represents the probability of selecting a smoker from the sample. Use the probability of randomly selecting a smoker from the full data set: p = the probability of selecting a smoker in this sample. to represent Complete the following table for this binomial probability distribution using the binomial formula to determine the missing values. P(X = 0) %3D P(X = 1) P(X = 2) 17 8. 6. 0.0000 0.0000 0.0000 01 1 3 P(X) 0.0331 0.0046 0.0004 Now use the table to determine the following values: 1. Calculate the probability that fewer than 2 of the 8 randomly selected children are smokers. 2. Would it be considered statistically unusual if more than 2 out of the 8 randomly selected children were found to be smokers? Compute the probability and explain why or why not. 3. Calculate the probability that none of the 8 randomly selected children is a smoker. 4. Calculate the probability that at least one of the 8 randomly selected children is a smoker. 5. Describe the relationship between the results of Questions 3 and 4. How many youths would you expect to be smokers in such a random sample of 8 youths? By recognizing that your data set consists of smokers and nonsmokers, you gain tremendous power in extending conclusions beyond the data by recognizing that these events are mutually exclusive (or disjoint) outcomes. Furthermore, because each individual can be considered independent of each other and the probability of each youth smoking is the same, you can represent such a random variable X using a binomial probability distribution. Suppose the following validation study is to be completed using 8 randomly selected youth from the East Boston area, where p represents the probability of selecting a smoker from the sample. Use the probability of randomly selecting a smoker from the full data set: p = the probability of selecting a smoker in this sample. to represent Complete the following table for this binomial probability distribution using the binomial formula to determine the missing values. P(X = 0) %3D P(X = 1) P(X = 2) 17 8. 6. 0.0000 0.0000 0.0000 01 1 3 P(X) 0.0331 0.0046 0.0004 Now use the table to determine the following values: 1. Calculate the probability that fewer than 2 of the 8 randomly selected children are smokers. 2. Would it be considered statistically unusual if more than 2 out of the 8 randomly selected children were found to be smokers? Compute the probability and explain why or why not. 3. Calculate the probability that none of the 8 randomly selected children is a smoker. 4. Calculate the probability that at least one of the 8 randomly selected children is a smoker. 5. Describe the relationship between the results of Questions 3 and 4. How many youths would you expect to be smokers in such a random sample of 8 youths? By recognizing that your data set consists of smokers and nonsmokers, you gain tremendous power in extending conclusions beyond the data by recognizing that these events are mutually exclusive (or disjoint) outcomes. Furthermore, because each individual can be considered independent of each other and the probability of each youth smoking is the same, you can represent such a random variable X using a binomial probability distribution. Suppose the following validation study is to be completed using 8 randomly selected youth from the East Boston area, where p represents the probability of selecting a smoker from the sample. Use the probability of randomly selecting a smoker from the full data set: p = the probability of selecting a smoker in this sample. to represent Complete the following table for this binomial probability distribution using the binomial formula to determine the missing values. P(X = 0) %3D P(X = 1) P(X = 2) 17 8. 6. 0.0000 0.0000 0.0000 01 1 3 P(X) 0.0331 0.0046 0.0004 Now use the table to determine the following values: 1. Calculate the probability that fewer than 2 of the 8 randomly selected children are smokers. 2. Would it be considered statistically unusual if more than 2 out of the 8 randomly selected children were found to be smokers? Compute the probability and explain why or why not. 3. Calculate the probability that none of the 8 randomly selected children is a smoker. 4. Calculate the probability that at least one of the 8 randomly selected children is a smoker. 5. Describe the relationship between the results of Questions 3 and 4. How many youths would you expect to be smokers in such a random sample of 8 youths? By recognizing that your data set consists of smokers and nonsmokers, you gain tremendous power in extending conclusions beyond the data by recognizing that these events are mutually exclusive (or disjoint) outcomes. Furthermore, because each individual can be considered independent of each other and the probability of each youth smoking is the same, you can represent such a random variable X using a binomial probability distribution. Suppose the following validation study is to be completed using 8 randomly selected youth from the East Boston area, where p represents the probability of selecting a smoker from the sample. Use the probability of randomly selecting a smoker from the full data set: p = the probability of selecting a smoker in this sample. to represent Complete the following table for this binomial probability distribution using the binomial formula to determine the missing values. P(X = 0) %3D P(X = 1) P(X = 2) 17 8. 6. 0.0000 0.0000 0.0000 01 1 3 P(X) 0.0331 0.0046 0.0004 Now use the table to determine the following values: 1. Calculate the probability that fewer than 2 of the 8 randomly selected children are smokers. 2. Would it be considered statistically unusual if more than 2 out of the 8 randomly selected children were found to be smokers? Compute the probability and explain why or why not. 3. Calculate the probability that none of the 8 randomly selected children is a smoker. 4. Calculate the probability that at least one of the 8 randomly selected children is a smoker. 5. Describe the relationship between the results of Questions 3 and 4. How many youths would you expect to be smokers in such a random sample of 8 youths? By recognizing that your data set consists of smokers and nonsmokers, you gain tremendous power in extending conclusions beyond the data by recognizing that these events are mutually exclusive (or disjoint) outcomes. Furthermore, because each individual can be considered independent of each other and the probability of each youth smoking is the same, you can represent such a random variable X using a binomial probability distribution. Suppose the following validation study is to be completed using 8 randomly selected youth from the East Boston area, where p represents the probability of selecting a smoker from the sample. Use the probability of randomly selecting a smoker from the full data set: p = the probability of selecting a smoker in this sample. to represent Complete the following table for this binomial probability distribution using the binomial formula to determine the missing values. P(X = 0) %3D P(X = 1) P(X = 2) 17 8. 6. 0.0000 0.0000 0.0000 01 1 3 P(X) 0.0331 0.0046 0.0004 Now use the table to determine the following values: 1. Calculate the probability that fewer than 2 of the 8 randomly selected children are smokers. 2. Would it be considered statistically unusual if more than 2 out of the 8 randomly selected children were found to be smokers? Compute the probability and explain why or why not. 3. Calculate the probability that none of the 8 randomly selected children is a smoker. 4. Calculate the probability that at least one of the 8 randomly selected children is a smoker. 5. Describe the relationship between the results of Questions 3 and 4. How many youths would you expect to be smokers in such a random sample of 8 youths?
Expert Answer:
Answer rating: 100% (QA)
Required solution PX 3 8 C 3 p 3 1p 5 00331 PX 3 56 p 3 1p 5 00331 1 PX 4 8 C 4 p 4 1p 4 000... View the full answer

Related Book For 

Probability and Statistics for Engineering and the Sciences
ISBN: 978-1305251809
9th edition
Authors: Jay L. Devore
Posted Date:
Students also viewed these accounting questions
-
A random variable x can assume five values: 0, 1, 2, 3, 4. A portion of the probability distribution is shown here: a. Find p(3). b. Construct a probability histogram for p(x). c. Calculate the...
-
A random variable X has density function proportional to Use R to find P(1/8 < X < 1/4). f(x) = for 0 < x < 1. (1 2)
-
The mean and standard deviation for a random variable x are 5.0 and 2.0, respectively. Find the mean and standard deviation if a. each value of x is increased by 3 b. each value of x is multiplied...
-
Q-1 A motor car shaft consists of a steel tube 30 mm internal diameter and 4 mm thick. The engine develops 10 kW at 2000 r.p.m. Find the maximum shear stress in the tube when the power is transmitted...
-
On January 1, 2014, Pollo Company issued 1,000 shares of 4%, $ 100 par cumulative preferred stock for $ 110,000. On December 26, 2015, the board of directors declared dividends of $ 6,000, which were...
-
McGregor Insurance Agency started the year with a beginning Retained Earnings balance of $27,500. During the year, McGregor Insurance Agency earned $34,000 of Service Revenue and incurred $23,500 of...
-
Discuss the suitability of bank loan financing for an entrepreneurial venture.
-
The executive director of Mutt Rescue (MR) animal shelter has asked you to prepare an annual budget for the coming fiscal year as well as a flexible budget based on a 5 percent increase in the number...
-
Marigold Hills Ltd. issued five-year bonds with a face value of $160,000 on January 1. The bonds have a coupon interest rate of 7% and interest is paid semi-annually on June 30 and December 31. The...
-
The adjusted trial balance for Burlington Advertising Services is presented below: (Click on the icon to view the adjusted trial balance.) Read the requirements Requirement 1. Prepare the income...
-
Discuss the role that pension funds play in company pension plans. What benefits accrue to companies who elect to use pension funds? How does the use of a pension fund change the accounting that must...
-
11. On January 31st, Justin had to record the depreciation on the truck he had bought in transaction (3). He estimated that the truck would last for 20 years and have a salvage value of $2,000. He...
-
Clearly explain your forecasting methods, and why you chose that technique in your Excel spreadsheet. Analyze and explain your results, and tell why this could be very important to the manufacturer...
-
Sometimes finding job openings is about asking the right questions (of the right people) and checking websites. These sources are usually free, while employment agencies may charge for their...
-
How does the economic theory of Optimization apply to home management? Share an example from your own life.
-
Problem 1 Keene Clinic, a multispecialty practice in Keene, Texas, has three revenue-producing patient services departments and one support department. The direct cost of the support department is...
-
Simple random samples of high-interest mortgages and low-interest mortgages were obtained. For the 40 high-interest mortgages, the borrowers had a mean FICO score of 727 and a standard deviation of...
-
At 31 December 20X9, the end of the annual reporting period, the accounts of Huron Company showed the following: a. Sales revenue for 20X9, $ 2,950,000, of which one- quarter was on credit. b....
-
Cortisol is a hormone that plays an important role in mediating stress. There is growing awareness that exposure of outdoor workers to pollutants may impact cortisol levels. The article "Plasma...
-
In cost estimation, the total cost of a project is the sum of component task costs. Each of these costs is a random variable with a probability distribution. It is customary to obtain information...
-
One piece of PVC pipe is to be inserted inside another piece. The length of the first piece is normally distributed with mean value 20 in. and standard deviation .5 in. The length of the second piece...
-
A sensitive instrument of mass \(100 \mathrm{~kg}\) is installed at a location that is subjected to harmonic motion with frequency \(20 \mathrm{~Hz}\) and acceleration \(0.5 \mathrm{~m} /...
-
A delicate instrument weighing \(200 \mathrm{~N}\) is suspended by four identical springs, each with stiffness \(50,000 \mathrm{~N} / \mathrm{m}\), in a rigid box as shown in Fig. 9.50. The box is...
-
A single-degree-of-freedom system is used to represent an automobile, of mass \(m\), damping constant \(c\), and stiffness \(k\), which travels on a rough road that is in the form of a sinusoidal...

Study smarter with the SolutionInn App