

Calculate the gross margin, profit margin and return on investment for both companies for 2016 and...
Fantastic news! We've Found the answer you've been seeking!
Question:
Transcribed Image Text:
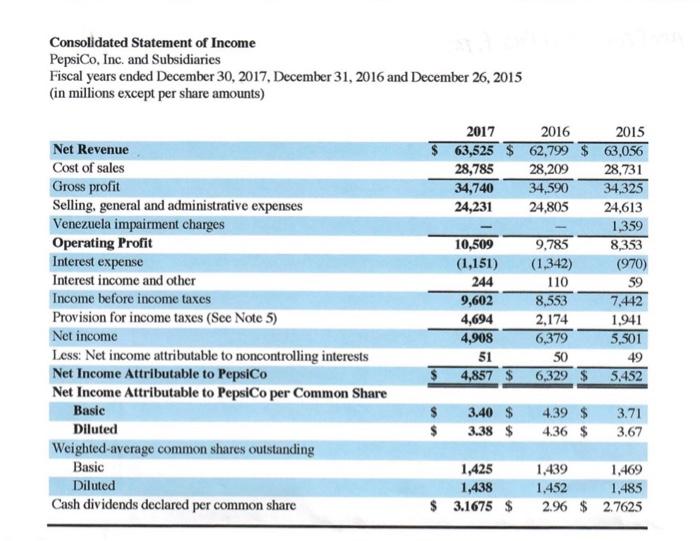
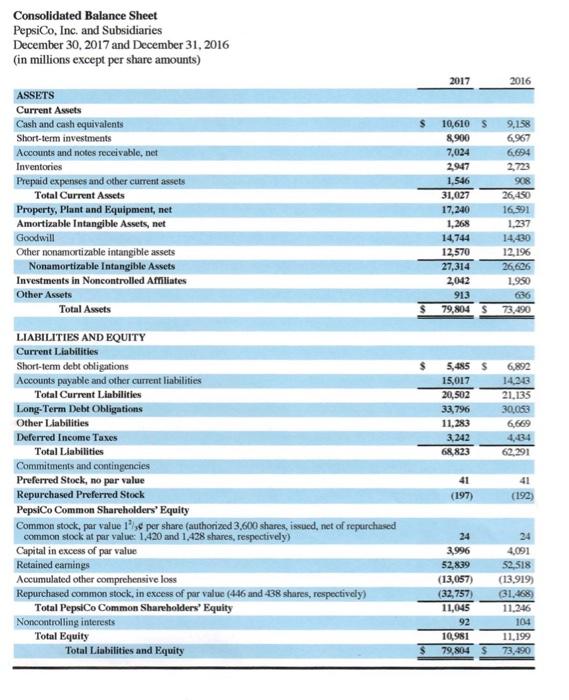
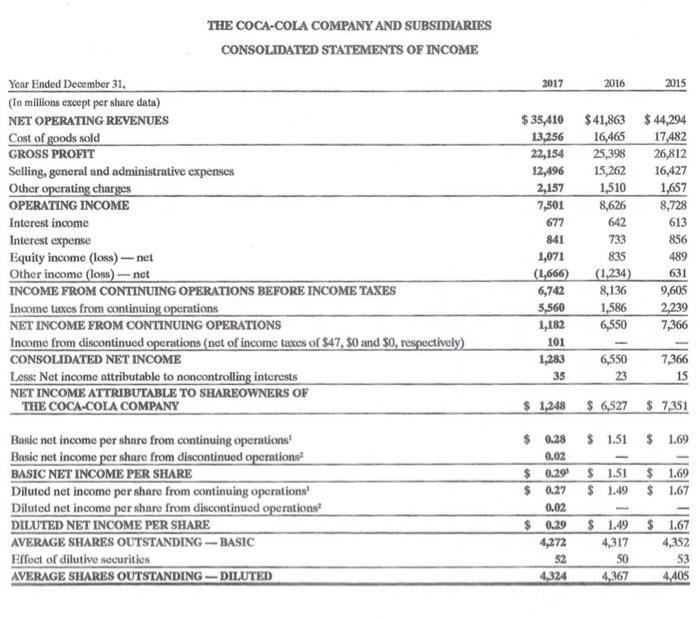
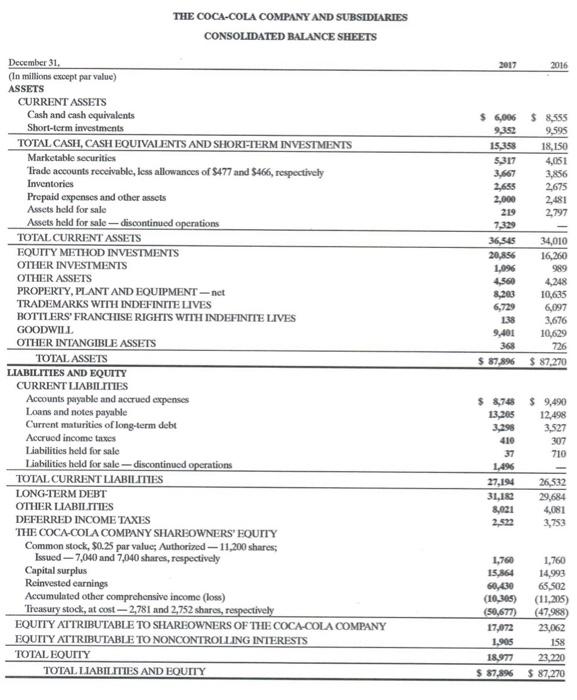
Calculate the gross margin, profit margin and return on investment for both companies for 2016 and 2017. Explain in a paragraph what these ratios show about each company's profitability compared to each other. Indicate which company shows the best prospects for future profits and explain in detail why you think the ratios support your observation. Consolidated Statement of Income PepsiCo, Inc. and Subsidiaries Fiscal years ended December 30, 2017, December 31, 2016 and December 26, 2015 (in millions except per share amounts) Net Revenue Cost of sales Gross profit Selling, general and administrative expenses Venezuela impairment charges Operating Profit Interest expense Interest income and other Income before income taxes Provision for income taxes (See Note 5) Net income Less: Net income attributable to noncontrolling interests Net Income Attributable to PepsiCo Net Income Attributable to PepsiCo per Common Share Basic Diluted Weighted average common shares outstanding Basic Diluted Cash dividends declared per common share 2017 $ 63,525 $ 28,785 34,740 24,231 $ 10,509 (1,151) 244 2016 62,799 $ 28,209 34,590 24,805 9,785 (1,342) 110 9,602 4,694 4,908 51 4,857 $6,329 $ 1,425 1,438 $ 3.1675 $ 8,553 2,174 6,379 50 3.40 $ 4.39 $ 3.38 $ 4.36 $ 2015 63,056 28,731 34,325 24,613 1,359 8,353 (970) 7,442 1,941 5,501 49 5,452 3.71 3.67 1,439 1,469 1,452 1,485 2.96 $ 2.7625 Consolidated Balance Sheet PepsiCo, Inc. and Subsidiaries December 30, 2017 and December 31, 2016 (in millions except per share amounts) ASSETS Current Assets Cash and cash equivalents Short-term investments Accounts and notes receivable, net Inventories Prepaid expenses and other current assets Total Current Assets Property, Plant and Equipment, net Amortizable Intangible Assets, net Goodwill Other nonamortizable intangible assets Nonamortizable Intangible Assets Investments in Noncontrolled Affiliates Other Assets Total Assets LIABILITIES AND EQUITY Current Liabilities Short-term debt obligations Accounts payable and other current liabilities Total Current Liabilities Long-Term Debt Obligations Other Liabilities Deferred Income Taxes Total Liabilities Commitments and contingencies Preferred Stock, no par value Repurchased Preferred Stock PepsiCo Common Shareholders' Equity Common stock, par value 1, per share (authorized 3,600 shares, issued, net of repurchased common stock at par value: 1,420 and 1,428 shares, respectively) Capital in excess of par value Retained earnings Accumulated other comprehensive loss Repurchased common stock, in excess of par value (446 and 438 shares, respectively) Total PepsiCo Common Shareholders' Equity Noncontrolling interests Total Equity Total Liabilities and Equity 2017 10,610 S 8,900 7,024 2,947 1,546 31,027 17,240 1,268 14,744 12,570 27,314 5,485 S 15,017 20,502 33,796 11,283 2,042 1,950 913 636 79,804 S 73,490 3,242 68,823 41 (197) 2016 9,158 6,967 6,694 2,723 908 10,981 79,804 S 26,450 16,991 1,237 14,430 12,196 26,626 6,892 14,243 21,135 30,053 6,669 4,434 62,291 41 (192) 24 24 3,996 4,091 52,839 52,518 (13,057) (13,919) (32,757) (31,468) 11,045 11,246 92 104 11,199 73,490 Year Ended December 31, (In millions except per share data) NET OPERATING REVENUES Cost of goods sold GROSS PROFIT THE COCA-COLA COMPANY AND SUBSIDIARIES CONSOLIDATED STATEMENTS OF INCOME Selling, general and administrative expenses Other operating charges OPERATING INCOME Interest income Interest expense Equity income (loss) -- net Other income (loss)-net INCOME FROM CONTINUING OPERATIONS BEFORE INCOME TAXES Income taxes from continuing operations NET INCOME FROM CONTINUING OPERATIONS Income from discontinued operations (net of income taxes of $47, $0 and $0, respectively) CONSOLIDATED NET INCOME Less: Net income attributable to noncontrolling interests NET INCOME ATTRIBUTABLE TO SHAREOWNERS OF THE COCA-COLA COMPANY Basic net income per share from continuing operations Basic net income per share from discontinued operations BASIC NET INCOME PER SHARE Diluted net income per share from continuing operations Diluted net income per share from discontinued operations DILUTED NET INCOME PER SHARE AVERAGE SHARES OUTSTANDING-BASIC Effect of dilutive securities AVERAGE SHARES OUTSTANDING-DILUTED 2017 $ 35,410 13,256 22,154 12,496 2,157 7,501 677 841 1,071 (1,666) 6,742 5,560 1,182 101 1,283 35 $ 1,248 $ 0.28 0.02 $ 0.29 $ 0.27 0.02 $ 0.29 4,272 52 4,324 2016 $41,863 16,465 25,398 15,262 1,510 8,626 642 733 835 (1,234) 8,136 1,586 6,550 - $ 1.51 $ 1.49 2015 $ 1.49 4,317 50 4,367 $ 44,294 17,482 26,812 16,427 1,657 8,728 613 856 489 631 9,605 2,239 7,366 6,550 23 $ 6,527 $ 7,351 $ 1.51 7,366 15 $ 1.69 $ 1.69 $ 1.67 $ 1.67 4,352 53 4,405 December 31, (In millions except par value) ASSETS THE COCA-COLA COMPANY AND SUBSIDIARIES CONSOLIDATED BALANCE SHEETS CURRENT ASSETS Cash and cash equivalents Short-term investments TOTAL CASH, CASH EQUIVALENTS AND SHORT-TERM INVESTMENTS Marketable securities Trade accounts receivable, less allowances of $477 and $466, respectively Inventories Prepaid expenses and other assets Assets held for sale Assets held for sale-discontinued operations TOTAL CURRENT ASSETS EQUITY METHOD INVESTMENTS OTHER INVESTMENTS OTHER ASSETS PROPERTY, PLANT AND EQUIPMENT-net TRADEMARKS WITH INDEFINITE LIVES BOTTLERS' FRANCHISE RIGHTS WITH INDEFINITE LIVES GOODWILL OTHER INTANGIBLE ASSETS TOTAL ASSETS LIABILITIES AND EQUITY CURRENT LIABILITIES Accounts payable and accrued expenses Loans and notes payable Current maturities of long-term debt Accrued income taxes Liabilities held for sale Liabilities held for sale-discontinued operations TOTAL CURRENT LIABILITIES LONG-TERM DEBT OTHER LIABILITIES DEFERRED INCOME TAXES THE COCA-COLA COMPANY SHAREOWNERS' EQUITY Common stock, $0.25 par value; Authorized-11,200 shares; Issued-7,040 and 7,040 shares, respectively Capital surplus Reinvested earnings Accumulated other comprehensive income (loss) Treasury stock, at cost-2,781 and 2,752 shares, respectively EQUITY ATTRIBUTABLE TO SHAREOWNERS OF THE COCA-COLA COMPANY EQUITY ATTRIBUTABLE TO NONCONTROLLING INTERESTS TOTAL EQUITY TOTAL LIABILITIES AND EQUITY 2017 $ 6,006 9,352 15,358 5,317 3,667 2,655 2,000 219 7,329 36,545 20,856 1,096 $ 8,748 13,205 3,298 410 37 1,496 27,194 31,182 8,021 2,522 4,560 8,203 6,729 138 9,401 368 $ 87,896 $ 87,270 1,760 15,864 60,430 (10,305) (50,677) 2016 $ 8,555 9,595 18,150 4,051 3,856 2,675 2,481 2,797 18,977 $ 87,896 34,010 16,260 989 4,248 10,635 6,097 3,676 10,629 726 $ 9,490 12,498 3,527 307 710 1,760 14,993 65,502 (11,205) (47,988) 17,072 23,062 1,905 158 23,220 $ 87,270 26,532 29,684 4,081 3,753 Calculate the gross margin, profit margin and return on investment for both companies for 2016 and 2017. Explain in a paragraph what these ratios show about each company's profitability compared to each other. Indicate which company shows the best prospects for future profits and explain in detail why you think the ratios support your observation. Consolidated Statement of Income PepsiCo, Inc. and Subsidiaries Fiscal years ended December 30, 2017, December 31, 2016 and December 26, 2015 (in millions except per share amounts) Net Revenue Cost of sales Gross profit Selling, general and administrative expenses Venezuela impairment charges Operating Profit Interest expense Interest income and other Income before income taxes Provision for income taxes (See Note 5) Net income Less: Net income attributable to noncontrolling interests Net Income Attributable to PepsiCo Net Income Attributable to PepsiCo per Common Share Basic Diluted Weighted average common shares outstanding Basic Diluted Cash dividends declared per common share 2017 $ 63,525 $ 28,785 34,740 24,231 $ 10,509 (1,151) 244 2016 62,799 $ 28,209 34,590 24,805 9,785 (1,342) 110 9,602 4,694 4,908 51 4,857 $6,329 $ 1,425 1,438 $ 3.1675 $ 8,553 2,174 6,379 50 3.40 $ 4.39 $ 3.38 $ 4.36 $ 2015 63,056 28,731 34,325 24,613 1,359 8,353 (970) 7,442 1,941 5,501 49 5,452 3.71 3.67 1,439 1,469 1,452 1,485 2.96 $ 2.7625 Consolidated Balance Sheet PepsiCo, Inc. and Subsidiaries December 30, 2017 and December 31, 2016 (in millions except per share amounts) ASSETS Current Assets Cash and cash equivalents Short-term investments Accounts and notes receivable, net Inventories Prepaid expenses and other current assets Total Current Assets Property, Plant and Equipment, net Amortizable Intangible Assets, net Goodwill Other nonamortizable intangible assets Nonamortizable Intangible Assets Investments in Noncontrolled Affiliates Other Assets Total Assets LIABILITIES AND EQUITY Current Liabilities Short-term debt obligations Accounts payable and other current liabilities Total Current Liabilities Long-Term Debt Obligations Other Liabilities Deferred Income Taxes Total Liabilities Commitments and contingencies Preferred Stock, no par value Repurchased Preferred Stock PepsiCo Common Shareholders' Equity Common stock, par value 1, per share (authorized 3,600 shares, issued, net of repurchased common stock at par value: 1,420 and 1,428 shares, respectively) Capital in excess of par value Retained earnings Accumulated other comprehensive loss Repurchased common stock, in excess of par value (446 and 438 shares, respectively) Total PepsiCo Common Shareholders' Equity Noncontrolling interests Total Equity Total Liabilities and Equity 2017 10,610 S 8,900 7,024 2,947 1,546 31,027 17,240 1,268 14,744 12,570 27,314 5,485 S 15,017 20,502 33,796 11,283 2,042 1,950 913 636 79,804 S 73,490 3,242 68,823 41 (197) 2016 9,158 6,967 6,694 2,723 908 10,981 79,804 S 26,450 16,991 1,237 14,430 12,196 26,626 6,892 14,243 21,135 30,053 6,669 4,434 62,291 41 (192) 24 24 3,996 4,091 52,839 52,518 (13,057) (13,919) (32,757) (31,468) 11,045 11,246 92 104 11,199 73,490 Year Ended December 31, (In millions except per share data) NET OPERATING REVENUES Cost of goods sold GROSS PROFIT THE COCA-COLA COMPANY AND SUBSIDIARIES CONSOLIDATED STATEMENTS OF INCOME Selling, general and administrative expenses Other operating charges OPERATING INCOME Interest income Interest expense Equity income (loss) -- net Other income (loss)-net INCOME FROM CONTINUING OPERATIONS BEFORE INCOME TAXES Income taxes from continuing operations NET INCOME FROM CONTINUING OPERATIONS Income from discontinued operations (net of income taxes of $47, $0 and $0, respectively) CONSOLIDATED NET INCOME Less: Net income attributable to noncontrolling interests NET INCOME ATTRIBUTABLE TO SHAREOWNERS OF THE COCA-COLA COMPANY Basic net income per share from continuing operations Basic net income per share from discontinued operations BASIC NET INCOME PER SHARE Diluted net income per share from continuing operations Diluted net income per share from discontinued operations DILUTED NET INCOME PER SHARE AVERAGE SHARES OUTSTANDING-BASIC Effect of dilutive securities AVERAGE SHARES OUTSTANDING-DILUTED 2017 $ 35,410 13,256 22,154 12,496 2,157 7,501 677 841 1,071 (1,666) 6,742 5,560 1,182 101 1,283 35 $ 1,248 $ 0.28 0.02 $ 0.29 $ 0.27 0.02 $ 0.29 4,272 52 4,324 2016 $41,863 16,465 25,398 15,262 1,510 8,626 642 733 835 (1,234) 8,136 1,586 6,550 - $ 1.51 $ 1.49 2015 $ 1.49 4,317 50 4,367 $ 44,294 17,482 26,812 16,427 1,657 8,728 613 856 489 631 9,605 2,239 7,366 6,550 23 $ 6,527 $ 7,351 $ 1.51 7,366 15 $ 1.69 $ 1.69 $ 1.67 $ 1.67 4,352 53 4,405 December 31, (In millions except par value) ASSETS THE COCA-COLA COMPANY AND SUBSIDIARIES CONSOLIDATED BALANCE SHEETS CURRENT ASSETS Cash and cash equivalents Short-term investments TOTAL CASH, CASH EQUIVALENTS AND SHORT-TERM INVESTMENTS Marketable securities Trade accounts receivable, less allowances of $477 and $466, respectively Inventories Prepaid expenses and other assets Assets held for sale Assets held for sale-discontinued operations TOTAL CURRENT ASSETS EQUITY METHOD INVESTMENTS OTHER INVESTMENTS OTHER ASSETS PROPERTY, PLANT AND EQUIPMENT-net TRADEMARKS WITH INDEFINITE LIVES BOTTLERS' FRANCHISE RIGHTS WITH INDEFINITE LIVES GOODWILL OTHER INTANGIBLE ASSETS TOTAL ASSETS LIABILITIES AND EQUITY CURRENT LIABILITIES Accounts payable and accrued expenses Loans and notes payable Current maturities of long-term debt Accrued income taxes Liabilities held for sale Liabilities held for sale-discontinued operations TOTAL CURRENT LIABILITIES LONG-TERM DEBT OTHER LIABILITIES DEFERRED INCOME TAXES THE COCA-COLA COMPANY SHAREOWNERS' EQUITY Common stock, $0.25 par value; Authorized-11,200 shares; Issued-7,040 and 7,040 shares, respectively Capital surplus Reinvested earnings Accumulated other comprehensive income (loss) Treasury stock, at cost-2,781 and 2,752 shares, respectively EQUITY ATTRIBUTABLE TO SHAREOWNERS OF THE COCA-COLA COMPANY EQUITY ATTRIBUTABLE TO NONCONTROLLING INTERESTS TOTAL EQUITY TOTAL LIABILITIES AND EQUITY 2017 $ 6,006 9,352 15,358 5,317 3,667 2,655 2,000 219 7,329 36,545 20,856 1,096 $ 8,748 13,205 3,298 410 37 1,496 27,194 31,182 8,021 2,522 4,560 8,203 6,729 138 9,401 368 $ 87,896 $ 87,270 1,760 15,864 60,430 (10,305) (50,677) 2016 $ 8,555 9,595 18,150 4,051 3,856 2,675 2,481 2,797 18,977 $ 87,896 34,010 16,260 989 4,248 10,635 6,097 3,676 10,629 726 $ 9,490 12,498 3,527 307 710 1,760 14,993 65,502 (11,205) (47,988) 17,072 23,062 1,905 158 23,220 $ 87,270 26,532 29,684 4,081 3,753
Expert Answer:
Answer rating: 100% (QA)
Gross Margin Profit Margin and Return on Investment Ratios Particulars Formula Pepsi Co The Coca Cola Co 2017 2016 2017 2016 Gross Margin Net Sales CO... View the full answer

Related Book For 
Understanding Financial Accounting
ISBN: 978-1118849385
1st Canadian Edition
Authors: Christopher Burnley, Robert Hoskin, Maureen Fizzell, Donald
Posted Date:
Students also viewed these accounting questions
-
Explain the net present value and return on investment for a cost-benefit analysis. Why would these calculations be used?
-
Explain in a paragraph why a phased conversion would be used to install the computer system.
-
Explain in a paragraph the relationship between a foreign key and a primary key, and why it is necessary to have them on separate entities when there is a relationship between the entities.
-
Suppose that for a sample of n = 11 measurements, we find that n = 72 and s = 5. Assuming normality, compute confidence intervals for the population mean with the following levels of confidence: a....
-
Briefly explain the responsibility of company management and the independent auditors in the accounting communication process.
-
Midtown Holding Company operates numerous businesses, including motel, auto rental, and real estate companies. Year 20X6 was interesting for Midtown, which reported the following on its income...
-
Find out from a bank or other financial institution the current interest rate on a standard savings account. Find out what other savings plans are available and their interest rates. 1. Calculate by...
-
The general ledger of Pipers Plumbing at January 1, 2015, includes the following account balances: The following is a summary of the transactions for the year: a. Provide plumbing services for cash,...
-
Shahinyan Supplies shipped the wrong material to a customer, who refused to accept the order. Upon receipt of the material, Shahinyan would credit accounts receivable and debit: Group of answer...
-
Testing to see if there is evidence that the mean service time at Restaurant #1 is less than the mean service time at Restaurant #2. Use Figure 4.4 and assume that the sample sizes are all the same....
-
The distance between the point (-1, -5, -10) and the point of intersection of the line - 2 +1_z-2 22. with the plane x - y + Z = 5 is 3 4 12 -1 -3 z- Let P(1, 2, 3) be a point in space and Q be a...
-
You expected to receive $1,000 today, $1000 one month from now and $1000 two months from now. What is the present value of these cash flows if the dicount rate is 12% APR wit monthly compounding?
-
Ronald Robert has spent much of the last few years gambling and playing soccer in Chicago. He has been largely unemployed during that period. About two years ago, however, he got his act together and...
-
Camila Company has set the following standard cost per unit for direct materials and direct labor. Direct materials (14 pounds @ $4 per pound) Direct labor (2 hours @ $14 per hour) $ 56 28 During...
-
Discuss the role of mass transfer coefficients and the impact of interfacial phenomena in gas-liquid absorption processes. How do hydrodynamic conditions influence the efficiency of mass transfer ?
-
Describe a situation situation where physical agents pose a potential hazard? What agents are present? How do these agents pose hazards? What steps have been taken to control the physical agents and...
-
What are the "checks and balances" when a researcher presents their findings? How can one truly know with any certainty whether a researcher is making up data or whether the findings are truly...
-
Juarez worked for Westarz Homes at construction sites for five years. Bever was a superintendent at construction sites, supervising subcontractors and moving trash from sites to landfills. He...
-
Some users of financial statements do not believe that deferred income tax liabilities meet the criteria for recognition as liabilities. Required: Discuss deferred income tax liabilities in terms of...
-
AP1-19 introduced Jason Chan and his pizza business, A Slice of Life Ltd. At the end of November, the following items were in records: Required: a. Identify each of the items in his records as an...
-
Assume that you are a member of the Canadian Accounting Standards Board (AcSB) and are a guest speaker at a commercial lender. You have been asked to explain why the board concluded that it would be...
-
Question: Joel Curtis was two years old and his brother, Joshua, was three years old when their father left both children asleep in the rear seat of his automobile while visiting a friend. His...
-
1. YOU BE THE JUDGE WRITING PROBLEM Process cheese food slices must contain at least 51 percent natural cheese. Imitation cheese slices, by contrast, contain little or no natural cheese and consist...
-
2. Josephine Rutyna was a 60-year-old widow who suffered from high blood pressure and epilepsy. A bill collector from Collections Accounts Terminal, Inc., called her and demanded that she pay $56 she...

Study smarter with the SolutionInn App