

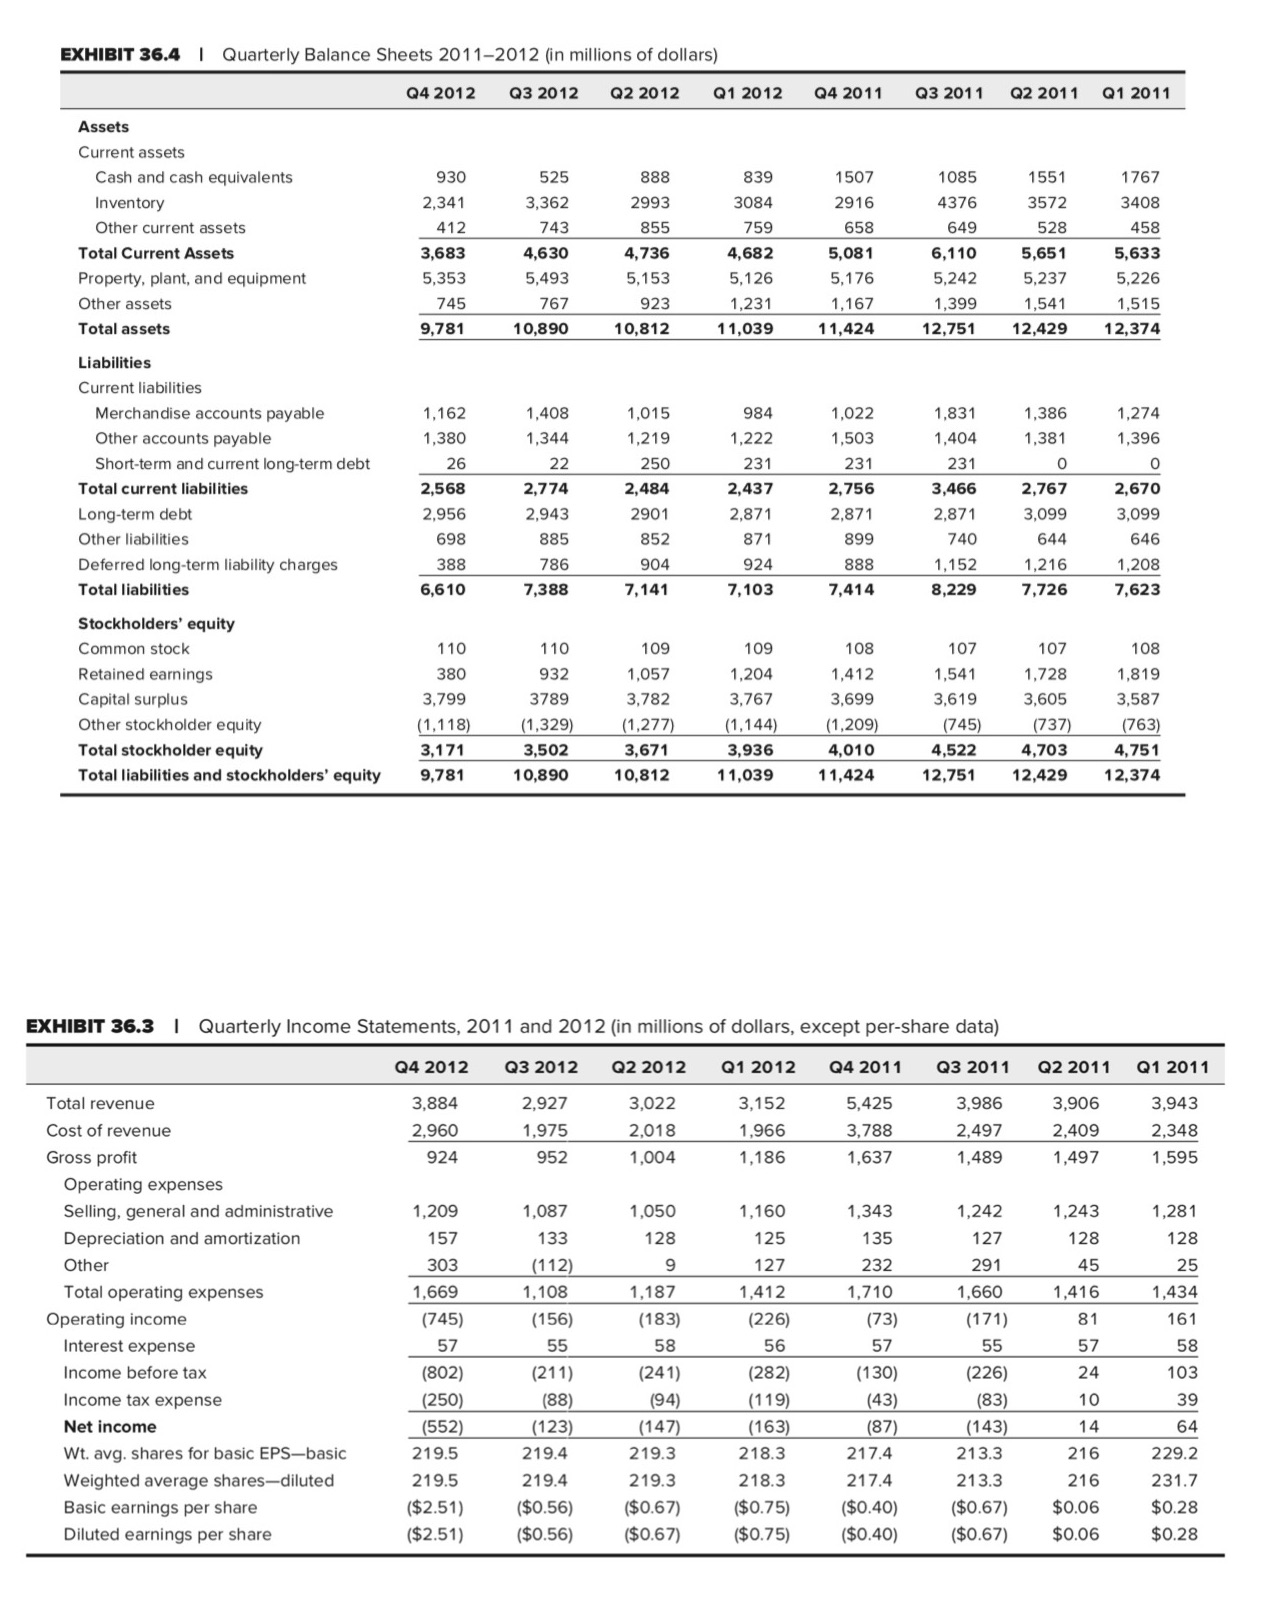
Calculate the inventory turnover, pay sales outstanding, days payable outstanding, days payable merchandise outstanding for each quarter.
Fantastic news! We've Found the answer you've been seeking!
Question:
Calculate the inventory turnover, pay sales outstanding, days payable outstanding, days payable merchandise outstanding for each quarter. Explain how these ratios can answer question 2.2.How has J.C. Penney managed its working capital accounts over the past eight quarters? Is there an opportunity to squeeze more cash from any of these accounts?
Expert Answer:

Related Book For 

Posted Date:
