

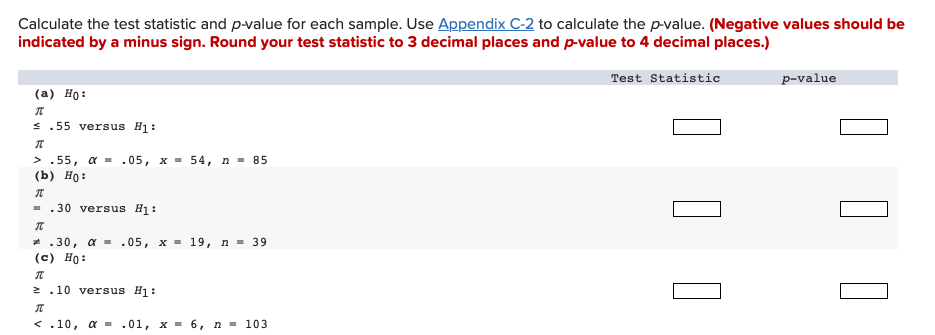
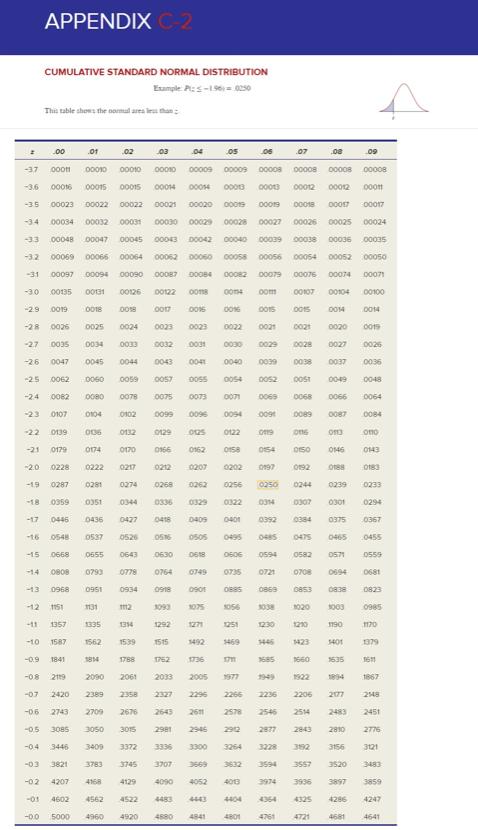
Calculate the test statistic and p-value for each sample. Use Appendix C-2 to calculate the p-value....
Fantastic news! We've Found the answer you've been seeking!
Question:
Transcribed Image Text:
Calculate the test statistic and p-value for each sample. Use Appendix C-2 to calculate the p-value. (Negative values should be indicated by a minus sign. Round your test statistic to 3 decimal places and p-value to 4 decimal places.) (a) Ho: .55 versus H: >.55, .05, x=54, n = 85 (b) Ho: T .30 versus H: T .30, = .05, x = 19, n = 39 (c) H0: T .10 versus H: APPENDIX C-2 CUMULATIVE STANDARD NORMAL DISTRIBUTION Example: Pl: -1960250 This table shows the normal area less than .00 .01 .02 03 .04 05 06 .07 08 09 -37 00011 00010 00010 00010 00009 00009 00008 00008 00008 00008 -3.6 00016 00015 00015 00014 00014 00013 00013 00012 00012 00011 -35 00023 00022 -34 00034 00032 00031 -33 -32 00048 00047 00045 00043 00042 00069 00066 00064 00062 00060 -31 00097 00094 00090 00087 00084 00026 00025 00024 00022 00021 00020 00019 00030 00029 00028 00027 00040 00039 00038 00036 00035 00058 00056 00054 00052 00050 00082 00079 00076 00074 00071 00019 00018 00017 00017 -30 00135 00131 00126 00122 0004 .com 00107 00104 00100 -29 0019 20018 0018 0017 0015 0016 0015 0015 0014 0014 -28 0026 0025 0024 0023 0023 0022 0021 0021 0020 0019 -27 0035 0034 0033 0032 0031 0030 0029 0028 0027 0026 -26 0047 0045 0044 0043 0041 0040 0039 0038 0037 0036 -25 0062 0060 0059 0057 0055 0054 0052 DOST 0049 0048 -24 0082 0080 0078 0075 0073 0071 0069 0068 0066 0064 -23 0107 0104 0102 0099 0096 0094 0091 0089 0087 0084 -22 0139 006 0132 0129 0125 0122 019 ons 0113 ono -21 0179 0174 0170 0166 0162 0158 0154 0150 0146 0143 -2.0 0228 0222 0217 0212 0207 0202 0197 0192 0188 0183 -19 0287 0281 0274 0268 0262 0256 0250 0244 0239 0233 -18 0359 0351 0344 0336 0329 0322 0314 0307 0301 0294 -17 0446 0436 0427 0418 0409 0401 0392 0384 0375 0367 -16 0548 0537 0526 0516 0505 0495 0485 0475 0465 0455 -15 0668 0655 0643 0630 0618 0606 0594 0582 0571 0559 14 0808 0793 0778 0764 0749 0735 0721 0708 0694 0681 -13 0968 0951 0934 0918 0901 0885 0869 0853 0838 0823 -12 1151 1131 112 3093 1075 1056 3038 1020 3003 0985 -11 1357 1335 1314 1292 1271 1251 1230 1210 1190 1170 -10 1587 1562 1539 1515 1492 1469 3446 1423 5401 1379 -0.9 1841 1814 1788 1762 1736 1711 1685 1660 1635 1611 -0.8 2119 2090 2061 2033 2005 3977 1949 1922 1894 1867 -07 2420 2389 2358 2327 2296 2266 2236 2206 2177 2148 -06 2743 2709 2676 2643 2611 2578 2546 2514 2483 2451 -0.5 3085 3050 3015 2981 2946 2912 2877 2843 2810 2776 -0.4 3446 3409 3372 3336 3300 3264 3228 392 3156 3121 -03 3821 3783 3745 3707 3609 3632 3594 3557 3520 3483 -02 4207 4168 4129 4090 4052 4013 3974 3936 3897 3859 -01 4602 4562 4522 4483 4404 4364 4325 4286 4247 -0.0 5000 4960 4920 4880 4841 4801 4761 4721 4681 4641 Calculate the test statistic and p-value for each sample. Use Appendix C-2 to calculate the p-value. (Negative values should be indicated by a minus sign. Round your test statistic to 3 decimal places and p-value to 4 decimal places.) (a) Ho: .55 versus H: >.55, .05, x=54, n = 85 (b) Ho: T .30 versus H: T .30, = .05, x = 19, n = 39 (c) H0: T .10 versus H: APPENDIX C-2 CUMULATIVE STANDARD NORMAL DISTRIBUTION Example: Pl: -1960250 This table shows the normal area less than .00 .01 .02 03 .04 05 06 .07 08 09 -37 00011 00010 00010 00010 00009 00009 00008 00008 00008 00008 -3.6 00016 00015 00015 00014 00014 00013 00013 00012 00012 00011 -35 00023 00022 -34 00034 00032 00031 -33 -32 00048 00047 00045 00043 00042 00069 00066 00064 00062 00060 -31 00097 00094 00090 00087 00084 00026 00025 00024 00022 00021 00020 00019 00030 00029 00028 00027 00040 00039 00038 00036 00035 00058 00056 00054 00052 00050 00082 00079 00076 00074 00071 00019 00018 00017 00017 -30 00135 00131 00126 00122 0004 .com 00107 00104 00100 -29 0019 20018 0018 0017 0015 0016 0015 0015 0014 0014 -28 0026 0025 0024 0023 0023 0022 0021 0021 0020 0019 -27 0035 0034 0033 0032 0031 0030 0029 0028 0027 0026 -26 0047 0045 0044 0043 0041 0040 0039 0038 0037 0036 -25 0062 0060 0059 0057 0055 0054 0052 DOST 0049 0048 -24 0082 0080 0078 0075 0073 0071 0069 0068 0066 0064 -23 0107 0104 0102 0099 0096 0094 0091 0089 0087 0084 -22 0139 006 0132 0129 0125 0122 019 ons 0113 ono -21 0179 0174 0170 0166 0162 0158 0154 0150 0146 0143 -2.0 0228 0222 0217 0212 0207 0202 0197 0192 0188 0183 -19 0287 0281 0274 0268 0262 0256 0250 0244 0239 0233 -18 0359 0351 0344 0336 0329 0322 0314 0307 0301 0294 -17 0446 0436 0427 0418 0409 0401 0392 0384 0375 0367 -16 0548 0537 0526 0516 0505 0495 0485 0475 0465 0455 -15 0668 0655 0643 0630 0618 0606 0594 0582 0571 0559 14 0808 0793 0778 0764 0749 0735 0721 0708 0694 0681 -13 0968 0951 0934 0918 0901 0885 0869 0853 0838 0823 -12 1151 1131 112 3093 1075 1056 3038 1020 3003 0985 -11 1357 1335 1314 1292 1271 1251 1230 1210 1190 1170 -10 1587 1562 1539 1515 1492 1469 3446 1423 5401 1379 -0.9 1841 1814 1788 1762 1736 1711 1685 1660 1635 1611 -0.8 2119 2090 2061 2033 2005 3977 1949 1922 1894 1867 -07 2420 2389 2358 2327 2296 2266 2236 2206 2177 2148 -06 2743 2709 2676 2643 2611 2578 2546 2514 2483 2451 -0.5 3085 3050 3015 2981 2946 2912 2877 2843 2810 2776 -0.4 3446 3409 3372 3336 3300 3264 3228 392 3156 3121 -03 3821 3783 3745 3707 3609 3632 3594 3557 3520 3483 -02 4207 4168 4129 4090 4052 4013 3974 3936 3897 3859 -01 4602 4562 4522 4483 4404 4364 4325 4286 4247 -0.0 5000 4960 4920 4880 4841 4801 4761 4721 4681 4641
Expert Answer:

Related Book For 

Applied Regression Analysis and Other Multivariable Methods
ISBN: 978-1285051086
5th edition
Authors: David G. Kleinbaum, Lawrence L. Kupper, Azhar Nizam, Eli S. Rosenberg
Posted Date:
Students also viewed these finance questions
-
Consider these data on the selling prices ($000) of homes in the city of Warren. Pennsylvania. last year. What is the class interval? Selling Price (S000) 120 up to 150 150 up to 180 180 up to 210...
-
Since perpetuity payments continue forever, how can a present value be computed? Why isnt the present value infinite?
-
On November 17 of Year 1, the company entered into a commitment to purchase 250,000 ounces of gold on February 14 of Year 2 at a price of $1,110.20 per ounce. On December 31 of Year 1, the market...
-
In problem, answer the questions about the given function. f(x) = 2x 2 /x 4 + 1 (a) Is the point (-1, 1) on the graph of f? (b) If x = 2, what is f(x)? What point is on the graph of f? (c) If f(x) =...
-
Identify the most appropriate approach and then design. Provide a rationale as to why this approach and design would be most appropriate. Develop a hypothetical research scenario that would...
-
Dousmann Corp.'s sales slumped badly in 2014. For the first time in its history, it operated at a loss. The company's income statement showed the following results from selling 500,000 units of...
-
Write the following expression in expanded form. (x+5)4 In (x-1)x+2
-
A fall in the unemployment rate must indicate that the economy is doing well. While this is almost always true, it is not always true. Explain why this is so.
-
Develop a scoring rubric to validate, rate, and rank candidates in order to be able to identify the top three candidates. How would reliability and validity affect the evaluation of this measurement?
-
food preparation list for tonkotsu ramen stock, pho stock, oxtail soup (kkori gomtang), veg stock(clear vegetable soup), hot and sour soup, miso soup, tom yum soup,bun bo hue, kimchi jjigae(kimchi...
-
Technical Analysis: Interest Rate Risk Management at Union Carbide Corporation Please provide me excel based analysis
-
With your knowledge of the differences between awards and enterprise agreements explain the impact that these have on your preparation of staffing rosters.
-
Describe 5 components of Human Capital discussed in the class and give some examples from your own life and readings. How would you use this model if tasked to hire new shift managers at a restaurant?
-
The tear film (of density 1 g/cm' and viscosity 0.013 g/cm per s) bathes the comea and protects it from drying out. Treat the cornea as a vertical planar surface, and assume that the tear film has a...
-
What are the four types of poultry production systems? Explain each type.
-
Consider the following four covariance matrices that apply to clusters having four responses per cluster: P Q R S a. Which of the above matrices are heterogeneous (as compared to homogeneous)...
-
Use the computer output shown next to compare the separate regressions of SBP on AGE and QUET for smokers and nonsmokers (based on the data from Problem 2 in Chapter 5), as follows. a. State the...
-
In the PDA research described in Problem 15, one of the outcome variables was mean airway pressure (measured in cm H2O) seven days after birtha measure of respiratory status. The data on this outcome...
-
A client who is a director of a publicly listed corporation is required by law to refrain from trading that companys stock at certain points of the year when disclosure of financial results are...
-
Consider the pairwise correlations of monthly returns of the following asset classes: Based solely on the information in the preceding table, which equity asset class is most sharply distinguished...
-
Investing the majority of the portfolio on a passive or low active risk basis while a minority of the assets is managed aggressively in smaller portfolios is best described as: A. The coresatellite...

Study smarter with the SolutionInn App