

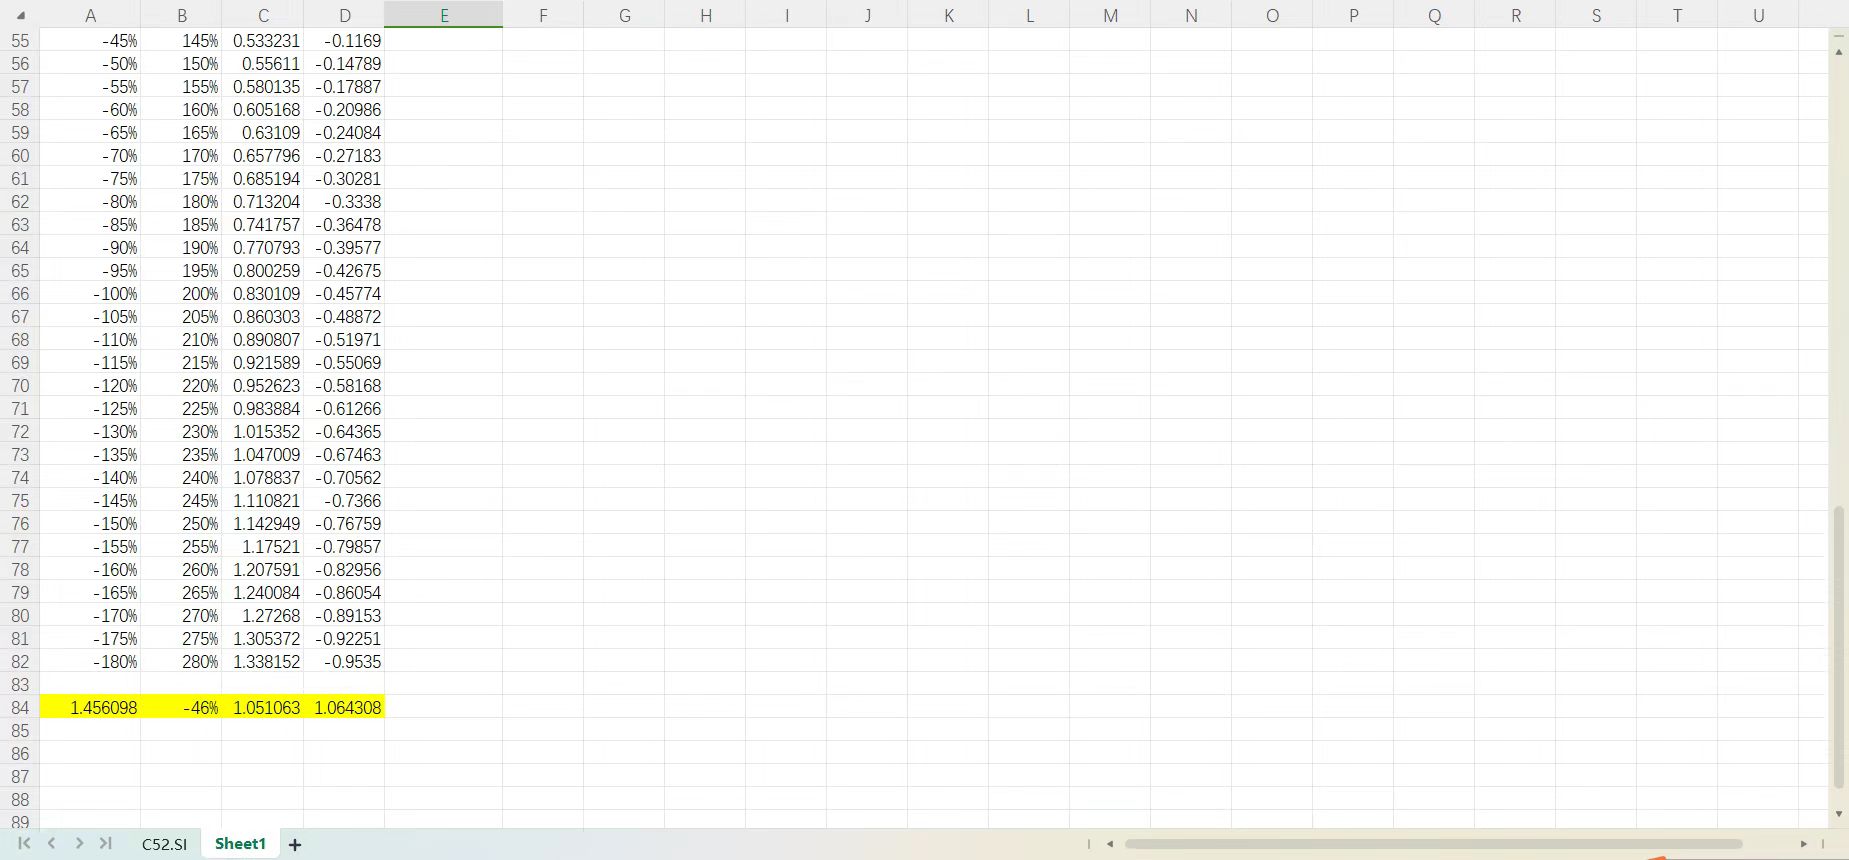
Calculate the weights on the minimum variance portfolio (= turning point) consisting of the two stocks,...
Fantastic news! We've Found the answer you've been seeking!
Question:

Transcribed Image Text:
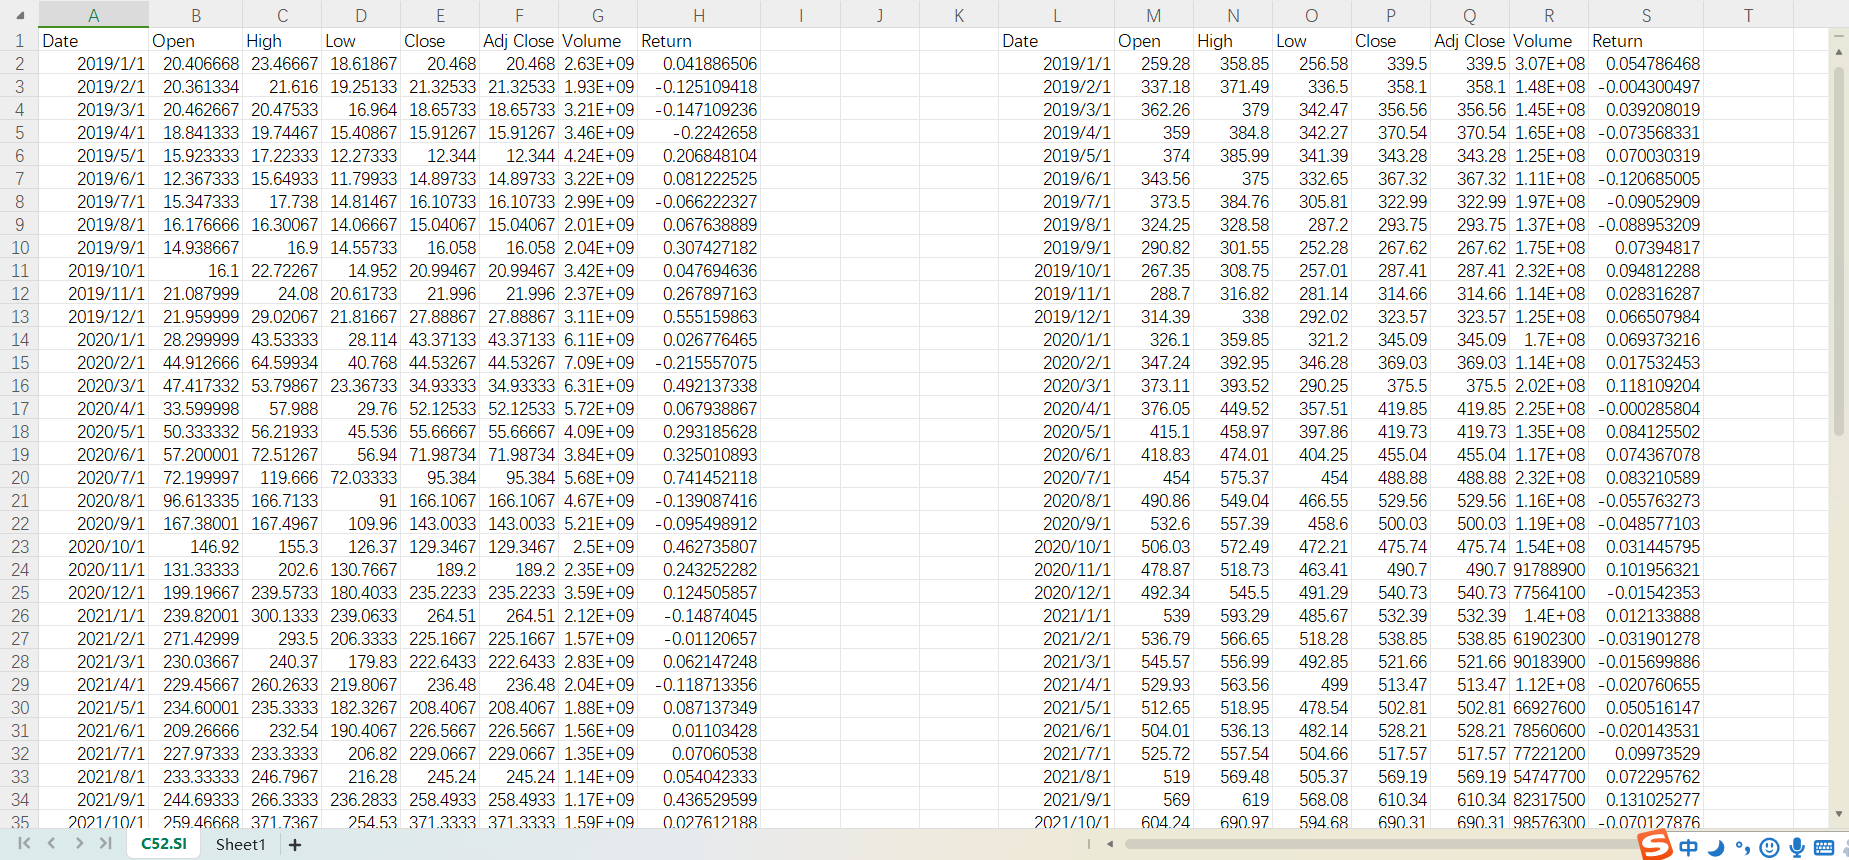
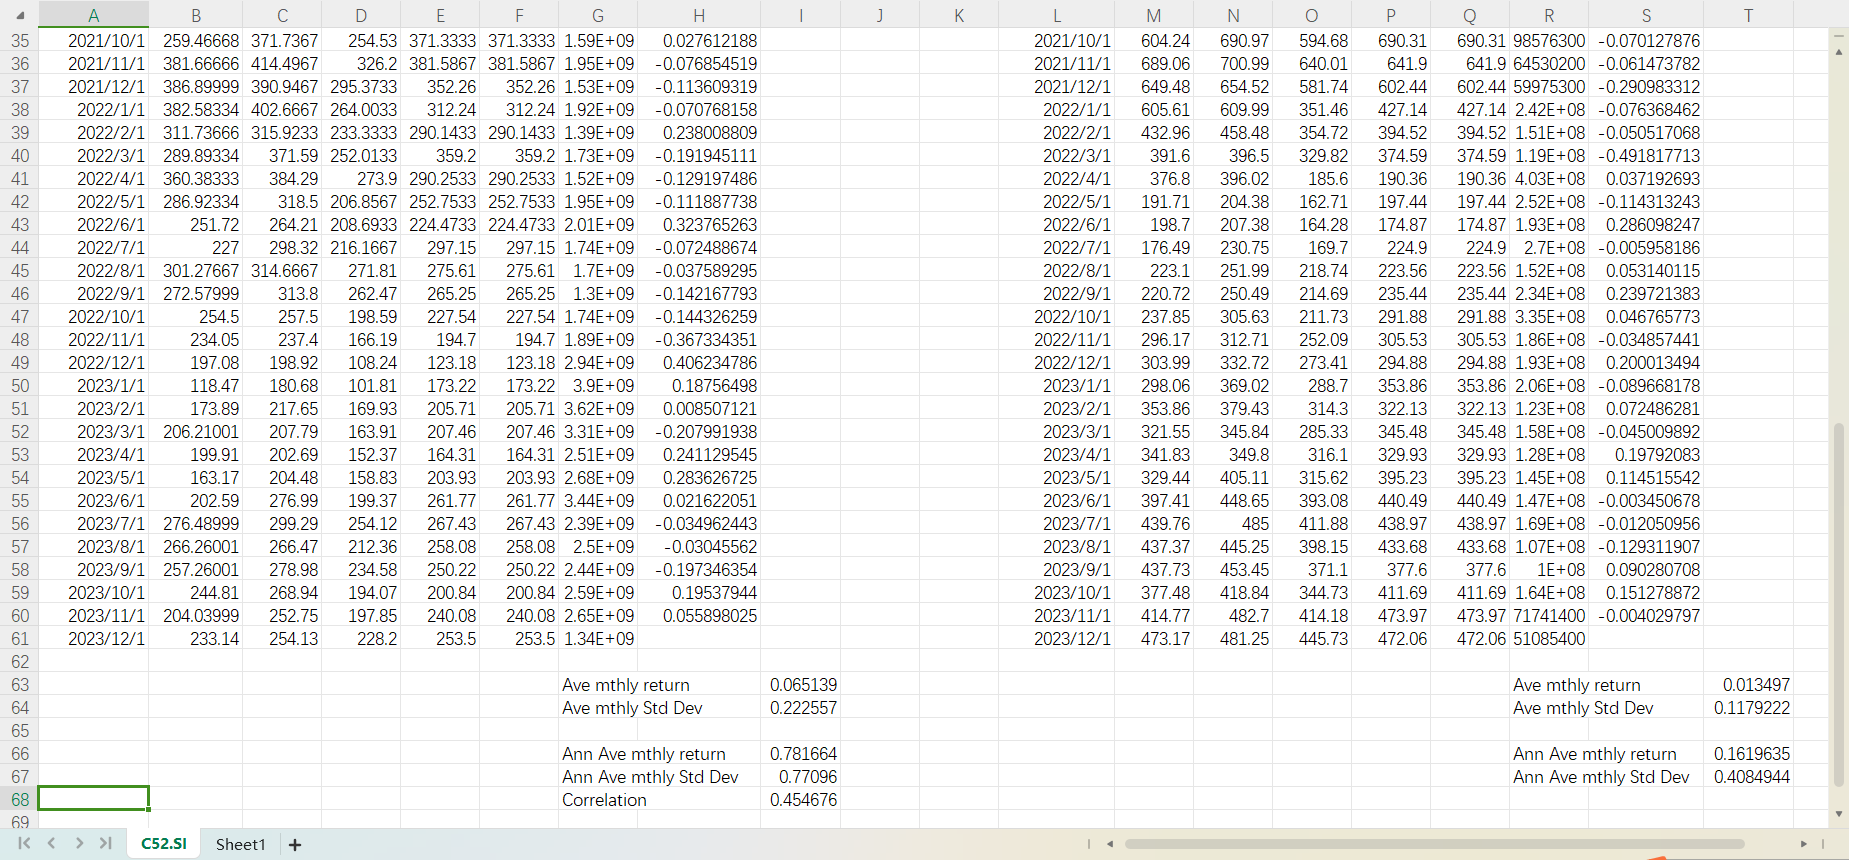
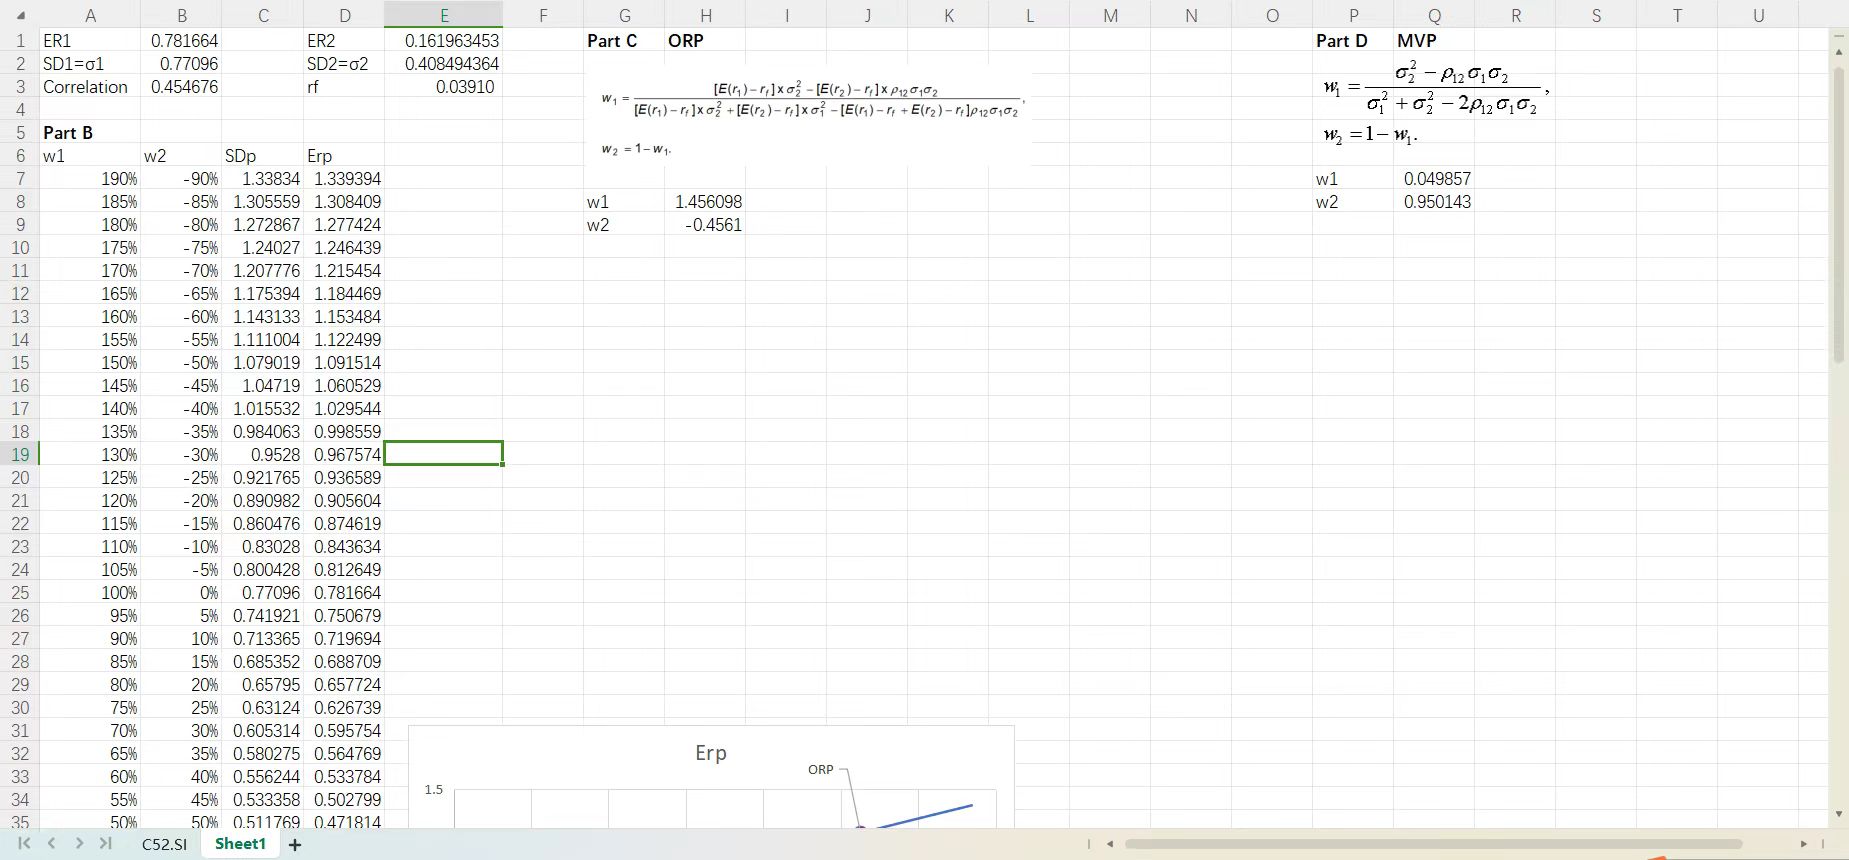
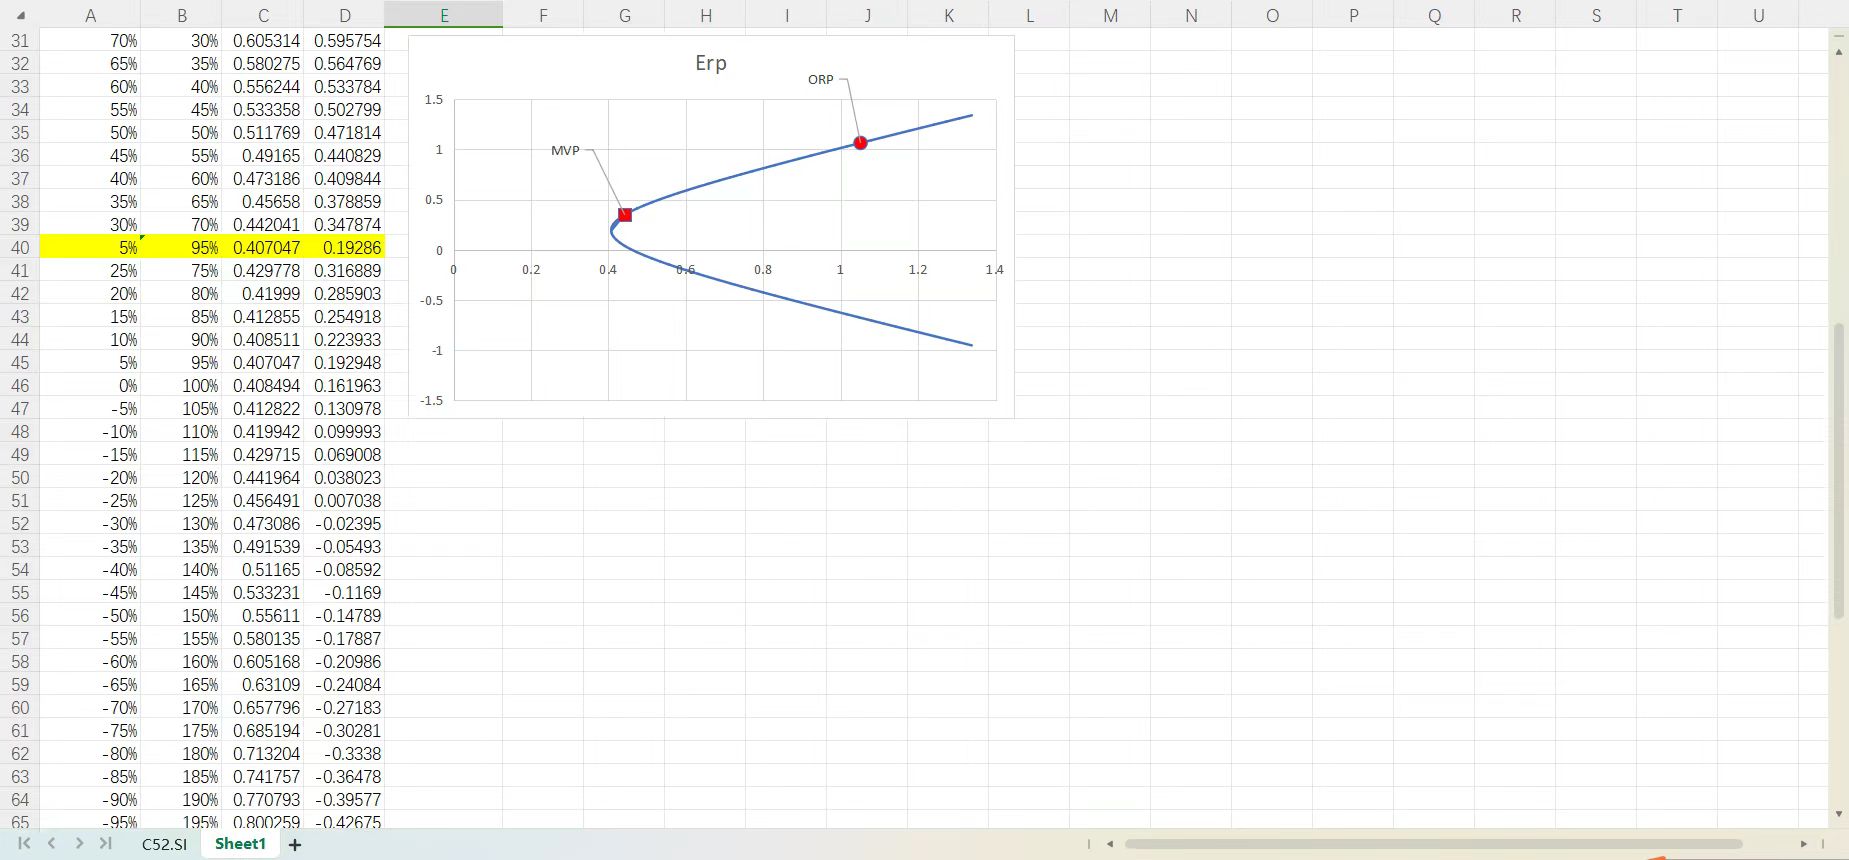
Calculate the weights on the minimum variance portfolio (= turning point) consisting of the two stocks, denoted as stock 1 and stock 2, using the following formulae. Show your working clearly. W =. 02-P120102 0 +02-20120102 W =1-W. Calculate the expected return and standard deviation of this minimum variance portfolio (MVP). Show clearly the minimum variance portfolio on the same graph with ORP in (c) above. Identify the MVP, ORP and efficient frontier consisting of the portfolios made up of these two assets. Label them clearly on the graph. Discuss in details on diversification with reference to the efficient frontier and comparing the expected return and standard deviation of the optimal risky portfolio to the minimum-variance portfolio in your answer. B E F High Low Adj Close Volume Return -0.147109236 -0.2242658 6 0.206848104 7 8 9 10 16 17 18 Open Close 2019/1/1 20.406668 23.46667 18.61867 20.468 20.468 2.63E+09 0.041886506 2019/2/1 20.361334 21.616 19.25133 21.32533 21.32533 1.93E+09 -0.125109418 2019/3/1 20.462667 20.47533 16.964 18.65733 18.65733 3.21E+09 2019/4/1 18.841333 19.74467 15.40867 15.91267 15.91267 3.46E+09 2019/5/1 15.923333 17.22333 12.27333 12.344 12.344 4.24E+09 2019/6/1 12.367333 15.64933 11.79933 14.89733 14.89733 3.22E+09 0.081222525 2019/7/1 15.347333 17.738 14.81467 16.10733 16.10733 2.99E+09 -0.066222327 2019/8/1 16.176666 16.30067 14.06667 15.04067 15.04067 2.01E+09 0.067638889 2019/9/1 14.938667 16.9 14.55733 16.058 16.058 2.04E+09 0.307427182 11 2019/10/1 16.1 22.72267 14.952 20.99467 20.99467 3.42E+09 0.047694636 12 2019/11/1 21.087999 24.08 20.61733 21.996 21.996 2.37E+09 0.267897163 13 2019/12/1 21.959999 29.02067 21.81667 27.88867 27.88867 3.11E+09 0.555159863 14 2020/1/1 28.299999 43.53333 28.114 43.37133 43.37133 6.11E+09 0.026776465 15 2020/2/1 44.912666 64.59934 40.768 44.53267 44.53267 7.09E+09 -0.215557075 2020/3/1 47.417332 53.79867 23.36733 34.93333 34.93333 6.31E+09 0.492137338 2020/4/1 33.599998 57.988 29.76 52.12533 52.12533 5.72E+09 0.067938867 2020/5/1 50.333332 56.21933 45.536 55.66667 55.66667 4.09E+09 0.293185628 2020/6/1 57.200001 72.51267 56.94 71.98734 71.98734 3.84E+09 0.325010893 2020/7/1 72.199997 119.666 72.03333 95.384 95.384 5.68E+09 0.741452118 2020/8/1 96.613335 166.7133 91 166.1067 166.1067 4.67E+09 -0.139087416 2020/9/1 167.38001 167.4967 109.96 143.0033 143.0033 5.21E+09 -0.095498912 2020/10/1 146.92 155.3 126.37 129.3467 129.3467 2.5E+09 0.462735807 2020/11/1 131.33333 202.6 130.7667 189.2 189.2 2.35E+09 0.243252282 25 2020/12/1 199.19667 239.5733 180.4033 235.2233 235.2233 3.59E+09 0.124505857 2021/1/1 239.82001 300.1333 239.0633 264.51 264.51 2.12E+09 -0.14874045 2021/2/1 271.42999 293.5 206.3333 225.1667 225.1667 1.57E+09 -0.01120657 2021/3/1 230.03667 240.37 179.83 222.6433 222.6433 2.83E+09 0.062147248 2021/4/1 229.45667 260.2633 219.8067 236.48 236.48 2.04E+09 -0.118713356 2021/5/1 234.60001 235.3333 182.3267 208.4067 208.4067 1.88E+09 0.087137349 2021/6/1 209.26666 232.54 190.4067 226.5667 226.5667 1.56E+09 0.01103428 2021/7/1 227.97333 233.3333 206.82 229.0667 229.0667 1.35E+09 0.07060538 2021/8/1 233.33333 246.7967 216.28 245.24 245.24 1.14E+09 0.054042333 2021/9/1 244.69333 266.3333 236.2833 258.4933 258.4933 1.17E+09 0.436529599 2021/10/1 259.46668 371.7367 254.53 371.3333 371.3333 1.59F+09 0.027612188 K < < >>I C52.SI Sheet1 + 19 20 21 22 23 24 26 27 28 29 30 31 32 33 34 35 1 Date 2345 A D H J K M N O P Open High Low Close 2019/1/1 259.28 358.85 256.58 339.5 2019/2/1 337.18 371.49 336.5 358.1 2019/3/1 362.26 379 342.47 356.56 2019/4/1 359 384.8 342.27 370.54 2019/5/1 374 385.99 341.39 343.28 2019/6/1 343.56 375 332.65 367.32 2019/7/1 373.5 384.76 305.81 322.99 2019/8/1 324.25 328.58 287.2 293.75 2019/9/1 290.82 301.55 252.28 267.62 2019/10/1 267.35 308.75 257.01 287.41 2019/11/1 288.7 316.82 281.14 314.66 2019/12/1 314.39 338 292.02 323.57 2020/1/1 326.1 359.85 321.2 345.09 2020/2/1 347.24 392.95 346.28 369.03 2020/3/1 373.11 393.52 290.25 375.5 2020/4/1 376.05 449.52 357.51 419.85 2020/5/1 415.1 458.97 397.86 419.73 2020/6/1 418.83 474.01 404.25 455.04 2020/7/1 454 575.37 454 488.88 2020/8/1 490.86 549.04 466.55 529.56 2020/9/1 532.6 557.39 458.6 500.03 2020/10/1 506.03 572.49 472.21 475.74 2020/11/1 478.87 518.73 463.41 490.7 2020/12/1 492.34 545.5 491.29 540.73 2021/1/1 539 593.29 485.67 532.39 2021/2/1 536.79 566.65 518.28 538.85 2021/3/1 545.57 556.99 492.85 521.66 2021/4/1 529.93 563.56 499 513.47 2021/5/1 512.65 518.95 478.54 502.81 2021/6/1 504.01 536.13 482.14 528.21 2021/7/1 525.72 557.54 504.66 517.57 2021/8/1 519 569.48 505.37 569.19 2021/9/1 569 619 568.08 610.34 2021/10/1 604.24 690.97 594.68 690.31 Date L S Q R Adj Close Volume Return 339.5 3.07E+08 0.054786468 358.1 1.48E+08 -0.004300497 356.56 1.45E+08 0.039208019 370.54 1.65E+08 -0.073568331 343.28 1.25E+08 0.070030319 367.32 1.11E+08 -0.120685005 322.99 1.97E+08 -0.09052909 293.75 1.37E+08 -0.088953209 267.62 1.75E+08 0.07394817 287.41 2.32E+08 0.094812288 314.66 1.14E+08 0.028316287 323.57 1.25E+08 0.066507984 345.09 1.7E+08 0.069373216 369.03 1.14E+08 0.017532453 375.5 2.02E+08 0.118109204 419.85 2.25E+08 -0.000285804 419.73 1.35E+08 0.084125502 455.04 1.17E+08 0.074367078 488.88 2.32E+08 0.083210589 529.56 1.16E+08 -0.055763273 500.03 1.19E+08 -0.048577103 475.74 1.54E+08 0.031445795 490.7 91788900 0.101956321 540.73 77564100 -0.01542353 532.39 1.4E+08 0.012133888 538.85 61902300 -0.031901278 521.66 90183900 -0.015699886 513.47 1.12E+08 -0.020760655 502.81 66927600 0.050516147 528.21 78560600 -0.020143531 517.57 77221200 0.09973529 569.19 54747700 0.072295762 610.34 82317500 0.131025277 690.31 98576300 -0.070127876 S T A B D E F G 35 2021/10/1 259.46668 371.7367 254.53 371.3333 371.3333 1.59E+09 H 0.027612188 -0.076854519 -0.113609319 36 2021/11/1 381.66666 414.4967 37 38 39 40 41 2022/4/1 360.38333 384.29 42 2022/5/1 286.92334 43 2022/6/1 44 45 326.2 381.5867 381.5867 1.95E+09 2021/12/1 386.89999 390.9467 295.3733 352.26 352.26 1.53E+09 2022/1/1 382.58334 402.6667 264.0033 312.24 312.24 1.92E+09 -0.070768158 2022/2/1 311.73666 315.9233 233.3333 290.1433 290.1433 1.39E+09 0.238008809 2022/3/1 289.89334 371.59 252.0133 359.2 359.2 1.73E+09 -0.191945111 273.9 290.2533 290.2533 1.52E+09 -0.129197486 318.5 206.8567 252.7533 252.7533 1.95E+09 -0.111887738 251.72 264.21 208.6933 224.4733 224.4733 2.01E+09 0.323765263 2022/7/1 227 298.32 216.1667 297.15 297.15 1.74E+09 -0.072488674 2022/8/1 301.27667 314.6667 271.81 275.61 275.61 1.7E+09 -0.037589295 46 2022/9/1 272.57999 313.8 262.47 265.25 265.25 1.3E+09 -0.142167793 47 2022/10/1 254.5 257.5 198.59 227.54 227.54 1.74E+09 -0.144326259 48 2022/11/1 234.05 237.4 166.19 194.7 194.7 1.89E+09 -0.367334351 49 2022/12/1 197.08 198.92 108.24 123.18 123.18 2.94E+09 0.406234786 2023/1/1 118.47 180.68 101.81 173.22 173.22 3.9E+09 0.18756498 2023/2/1 173.89 217.65 169.93 205.71 205.71 3.62E+09 0.008507121 2023/3/1 206.21001 207.79 163.91 207.46 207.46 3.31E+09 -0.207991938 2023/4/1 199.91 202.69 152.37 164.31 164.31 2.51E+09 0.241129545 2023/5/1 163.17 204.48 158.83 203.93 203.93 2.68E+09 0.283626725 2023/6/1 202.59 276.99 199.37 261.77 261.77 3.44E+09 0.021622051 2023/7/1 276.48999 299.29 254.12 267.43 267.43 2.39E+09 -0.034962443 2023/8/1 266.26001 266.47 212.36 258.08 258.08 2.5E+09 -0.03045562 2023/9/1 257.26001 278.98 234.58 250.22 250.22 2.44E+09 -0.197346354 244.81 268.94 194.07 200.84 200.84 2.59E+09 60 2023/11/1 204.03999 252.75 197.85 240.08 240.08 2.65E+09 2023/12/1 233.14 254.13 228.2 253.5 253.5 1.34E+09 50 51 52 53 54 55 56 57 58 59 2023/10/1 0.19537944 0.055898025 61 62 63 64 65 66 67 68 69 K < < > > C52.SI Sheet1 + Ave mthly return Ave mthly Std Dev Ann Ave mthly return Ann Ave mthly Std Dev Correlation I 0.065139 0.222557 0.781664 0.77096 0.454676 J K L M N O P Q R 2021/10/1 604.24 690.97 594.68 690.31 690.31 98576300 -0.070127876 2021/11/1 689.06 700.99 640.01 641.9 641.9 64530200 -0.061473782 2021/12/1 649.48 654.52 581.74 602.44 602.44 59975300 -0.290983312 2022/1/1 605.61 609.99 351.46 427.14 427.14 2.42E+08 -0.076368462 2022/2/1 432.96 458.48 354.72 394.52 394.52 1.51E+08 -0.050517068 2022/3/1 391.6 396.5 329.82 374.59 374.59 1.19E+08 -0.491817713 2022/4/1 376.8 396.02 185.6 190.36 190.36 4.03E+08 0.037192693 2022/5/1 191.71 204.38 162.71 197.44 197.44 2.52E+08 -0.114313243 2022/6/1 198.7 207.38 164.28 174.87 174.87 1.93E+08 0.286098247 2022/7/1 176.49 230.75 169.7 224.9 224.9 2.7E+08 -0.005958186 2022/8/1 223.1 251.99 218.74 223.56 223.56 1.52E+08 0.053140115 2022/9/1 220.72 250.49 214.69 235.44 235.44 2.34E+08 0.239721383 2022/10/1 237.85 305.63 211.73 291.88 291.88 3.35E+08 0.046765773 2022/11/1 296.17 312.71 252.09 305.53 305.53 1.86E+08 -0.034857441 2022/12/1 303.99 332.72 273.41 294.88 294.88 1.93E+08 0.200013494 2023/1/1 298.06 369.02 288.7 353.86 353.86 2.06E+08 -0.089668178 2023/2/1 353.86 379.43 314.3 322.13 322.13 1.23E+08 0.072486281 2023/3/1 321.55 345.84 285.33 345.48 345.48 1.58E+08 -0.045009892 2023/4/1 341.83 349.8 316.1 329.93 329.93 1.28E+08 0.19792083 2023/5/1 329.44 405.11 315.62 395.23 395.23 1.45E+08 0.114515542 2023/6/1 397.41 448.65 393.08 440.49 440.49 1.47E+08 -0.003450678 2023/7/1 439.76 485 411.88 438.97 438.97 1.69E+08 -0.012050956 2023/8/1 437.37 445.25 398.15 433.68 433.68 1.07E+08 -0.129311907 2023/9/1 437.73 453.45 371.1 377.6 377.6 1E+08 0.090280708 2023/10/1 377.48 418.84 344.73 411.69 1.64E+08 0.151278872 2023/11/1 414.77 482.7 414.18 473.97 71741400 -0.004029797 2023/12/1 473.17 481.25 445.73 411.69 473.97 472.06 472.06 51085400 Ave mthly return Ave mthly Std Dev Ann Ave mthly return Ann Ave mthly Std Dev T 0.013497 0.1179222 0.1619635 0.4084944 1 ER1 2 SD1=01 3 Correlation 4 5 Part B 6 w1 7 8 9 10 11 12 13 14 15 16 17 A 18 19 20 21 22 23 24 25 26 27 28 29 30 190% 185% 180% 175% 170% 165% 160% 155% 150% 145% 140% 135% 130% 125% 120% 115% 110% 105% 100% 95% 90% 85% 80% 31 32 33 34 35 K < > > 75% 70% 65% 60% 55% 50% B 0.781664 0.77096 0.454676 w2 ER2 SD2=02 rf Erp SDp -90% 1.33834 1.339394 -85% 1.305559 1.308409 -80% 1.272867 1.277424 -75% 1.24027 1.246439 -70% 1.207776 1.215454 -65 % 1.175394 1.184469 -60% 1.143133 1.153484 -55% 1.111004 1.122499 -50% 1.079019 1.091514 -45% 1.04719 1.060529 -40% 1.015532 1.029544 -35% 0.984063 0.998559 0.9528 0.967574 -30% -25% 0.921765 0.936589 -20% 0.890982 0.905604 -15% 0.860476 0.874619 -10% 0.83028 0.843634 -5% 0.800428 0.812649 0% 0.77096 0.781664 5% 0.741921 0.750679 10% 0.713365 0.719694 15% 0.685352 0.688709 20% 0.65795 0.657724 25% 0.63124 0.626739 30% 0.605314 0.595754 35% 0.580275 0.564769 40% 0.556244 0.533784 45% 0.533358 0.502799 50% 0.511769 0.471814 C52.SI Sheet1 + E 0.161963453 0.408494364 0.03910 1.5 F G Part C W = w1 w2 H ORP W = 1-W. [E()-r]xo-[E()-]x P20102 [E(r)-r]xo +[E(r)-r]xo? -[E()-r+E(r)-r]P120102 1.456098 -0.4561 Erp ORP J - K L M N O P Part D W = Q MVP w1 w2 W =1-w. 02-P120102 0 +0-2012010 R 0.049857 0.950143 S T U 31 32 33 34 35 36 37 38 39 40 41 42 43 44 45 46 47 48 49 50 51 52 53 54 55 56 57 58 59 60 61 62 63 64 65 K < A 70% 65% 60% 55% 50% 45% 40% 35% 30% 5% 25% 20% 15% 10% 5% 0% - 5% -10% -15% -20% B C 30% 0.605314 0.595754 35% 0.580275 0.564769 40% 0.556244 0.533784 45% 0.533358 0.502799 50% 0.511769 0.471814 55% 0.49165 0.440829 60% 0.473186 0.409844 65% 0.45658 0.378859 70% 0.442041 0.347874 95% 0.407047 0.19286 75% 0.429778 0.316889 80% 0.41999 0.285903 -0.5 85% 0.412855 0.254918 90% 0.408511 0.223933 95% 0.407047 0.192948 100% 0.408494 0.161963 105% 0.412822 0.130978 110% 0.419942 0.099993 115 % 0.429715 0.069008 120% 0.441964 0.038023 125% 0.456491 0.007038 130% 0.473086 -0.02395 135% 0.491539 -0.05493 140% 0.51165 -0.08592 145% 0.533231 -0.1169 150% 0.55611 -0.14789 155% 0.580135 -0.17887 160 % 0.605168 -0.20986 165% 0.63109 -0.24084 170 % 0.657796 -0.27183 175% 0.685194 -0.30281 180 % 0.713204 -0.3338 185% 0.741757 -0.36478 190% 0.770793 -0.39577 195% 0.800259 -0.42675 -25% -30% -35% -40% -45% -50% -55% -60% -65% -70% -75% -80% -85% -90% -95% > > C52.SI Sheet1 + E 1.5 1 0.5 0 -1 -1.5 0 F 0.2 MVP 0.4 G 06 H Erp 0.8 ORP 1 J 1.2 K 1.4 L M N O P Q R S T U 55 56 57 58 59 60 61 62 63 64 65 66 67 68 69 70 71 72 73 74 75 76 77 78 79 80 81 82 83 84 85 86 87 88 89 K < < A -45% -50% -55% -60% -65% -70% -75% -80% -85% -90% -95% - 100% -105% -110% -115% -120% -125% -130% - 135% - 140% -145% -150% -155% -160% -165% -170% -175% -180% 1.456098 B D 145% 0.533231 -0.1169 150% 0.55611 -0.14789 155% 0.580135 -0.17887 160 % 0.605168 -0.20986 165% 0.63109 -0.24084 170 % 0.657796 -0.27183 175% 0.685194 -0.30281 180% 0.713204 -0.3338 185% 0.741757 -0.36478 190% 0.770793 -0.39577 195% 0.800259 -0.42675 200% 0.830109 -0.45774 205% 0.860303 -0.48872 210% 0.890807 -0.51971 215% 0.921589 -0.55069 220% 0.952623 -0.58168 225% 0.983884 -0.61266 230% 1.015352 -0.64365 235% 1.047009 -0.67463 240% 1.078837 -0.70562 245 % 1.110821 -0.7366 250 % 1.142949 -0.76759 255% 1.17521 -0.79857 260% 1.207591 -0.82956 265% 1.240084 -0.86054 270% 1.27268 -0.89153 275% 1.305372 -0.92251 280% 1.338152 -0.9535 -46% 1.051063 1.064308 > > C52.SI Sheet1 + E F G H 1 J K L M N O P Q R S T U Calculate the weights on the minimum variance portfolio (= turning point) consisting of the two stocks, denoted as stock 1 and stock 2, using the following formulae. Show your working clearly. W =. 02-P120102 0 +02-20120102 W =1-W. Calculate the expected return and standard deviation of this minimum variance portfolio (MVP). Show clearly the minimum variance portfolio on the same graph with ORP in (c) above. Identify the MVP, ORP and efficient frontier consisting of the portfolios made up of these two assets. Label them clearly on the graph. Discuss in details on diversification with reference to the efficient frontier and comparing the expected return and standard deviation of the optimal risky portfolio to the minimum-variance portfolio in your answer. B E F High Low Adj Close Volume Return -0.147109236 -0.2242658 6 0.206848104 7 8 9 10 16 17 18 Open Close 2019/1/1 20.406668 23.46667 18.61867 20.468 20.468 2.63E+09 0.041886506 2019/2/1 20.361334 21.616 19.25133 21.32533 21.32533 1.93E+09 -0.125109418 2019/3/1 20.462667 20.47533 16.964 18.65733 18.65733 3.21E+09 2019/4/1 18.841333 19.74467 15.40867 15.91267 15.91267 3.46E+09 2019/5/1 15.923333 17.22333 12.27333 12.344 12.344 4.24E+09 2019/6/1 12.367333 15.64933 11.79933 14.89733 14.89733 3.22E+09 0.081222525 2019/7/1 15.347333 17.738 14.81467 16.10733 16.10733 2.99E+09 -0.066222327 2019/8/1 16.176666 16.30067 14.06667 15.04067 15.04067 2.01E+09 0.067638889 2019/9/1 14.938667 16.9 14.55733 16.058 16.058 2.04E+09 0.307427182 11 2019/10/1 16.1 22.72267 14.952 20.99467 20.99467 3.42E+09 0.047694636 12 2019/11/1 21.087999 24.08 20.61733 21.996 21.996 2.37E+09 0.267897163 13 2019/12/1 21.959999 29.02067 21.81667 27.88867 27.88867 3.11E+09 0.555159863 14 2020/1/1 28.299999 43.53333 28.114 43.37133 43.37133 6.11E+09 0.026776465 15 2020/2/1 44.912666 64.59934 40.768 44.53267 44.53267 7.09E+09 -0.215557075 2020/3/1 47.417332 53.79867 23.36733 34.93333 34.93333 6.31E+09 0.492137338 2020/4/1 33.599998 57.988 29.76 52.12533 52.12533 5.72E+09 0.067938867 2020/5/1 50.333332 56.21933 45.536 55.66667 55.66667 4.09E+09 0.293185628 2020/6/1 57.200001 72.51267 56.94 71.98734 71.98734 3.84E+09 0.325010893 2020/7/1 72.199997 119.666 72.03333 95.384 95.384 5.68E+09 0.741452118 2020/8/1 96.613335 166.7133 91 166.1067 166.1067 4.67E+09 -0.139087416 2020/9/1 167.38001 167.4967 109.96 143.0033 143.0033 5.21E+09 -0.095498912 2020/10/1 146.92 155.3 126.37 129.3467 129.3467 2.5E+09 0.462735807 2020/11/1 131.33333 202.6 130.7667 189.2 189.2 2.35E+09 0.243252282 25 2020/12/1 199.19667 239.5733 180.4033 235.2233 235.2233 3.59E+09 0.124505857 2021/1/1 239.82001 300.1333 239.0633 264.51 264.51 2.12E+09 -0.14874045 2021/2/1 271.42999 293.5 206.3333 225.1667 225.1667 1.57E+09 -0.01120657 2021/3/1 230.03667 240.37 179.83 222.6433 222.6433 2.83E+09 0.062147248 2021/4/1 229.45667 260.2633 219.8067 236.48 236.48 2.04E+09 -0.118713356 2021/5/1 234.60001 235.3333 182.3267 208.4067 208.4067 1.88E+09 0.087137349 2021/6/1 209.26666 232.54 190.4067 226.5667 226.5667 1.56E+09 0.01103428 2021/7/1 227.97333 233.3333 206.82 229.0667 229.0667 1.35E+09 0.07060538 2021/8/1 233.33333 246.7967 216.28 245.24 245.24 1.14E+09 0.054042333 2021/9/1 244.69333 266.3333 236.2833 258.4933 258.4933 1.17E+09 0.436529599 2021/10/1 259.46668 371.7367 254.53 371.3333 371.3333 1.59F+09 0.027612188 K < < >>I C52.SI Sheet1 + 19 20 21 22 23 24 26 27 28 29 30 31 32 33 34 35 1 Date 2345 A D H J K M N O P Open High Low Close 2019/1/1 259.28 358.85 256.58 339.5 2019/2/1 337.18 371.49 336.5 358.1 2019/3/1 362.26 379 342.47 356.56 2019/4/1 359 384.8 342.27 370.54 2019/5/1 374 385.99 341.39 343.28 2019/6/1 343.56 375 332.65 367.32 2019/7/1 373.5 384.76 305.81 322.99 2019/8/1 324.25 328.58 287.2 293.75 2019/9/1 290.82 301.55 252.28 267.62 2019/10/1 267.35 308.75 257.01 287.41 2019/11/1 288.7 316.82 281.14 314.66 2019/12/1 314.39 338 292.02 323.57 2020/1/1 326.1 359.85 321.2 345.09 2020/2/1 347.24 392.95 346.28 369.03 2020/3/1 373.11 393.52 290.25 375.5 2020/4/1 376.05 449.52 357.51 419.85 2020/5/1 415.1 458.97 397.86 419.73 2020/6/1 418.83 474.01 404.25 455.04 2020/7/1 454 575.37 454 488.88 2020/8/1 490.86 549.04 466.55 529.56 2020/9/1 532.6 557.39 458.6 500.03 2020/10/1 506.03 572.49 472.21 475.74 2020/11/1 478.87 518.73 463.41 490.7 2020/12/1 492.34 545.5 491.29 540.73 2021/1/1 539 593.29 485.67 532.39 2021/2/1 536.79 566.65 518.28 538.85 2021/3/1 545.57 556.99 492.85 521.66 2021/4/1 529.93 563.56 499 513.47 2021/5/1 512.65 518.95 478.54 502.81 2021/6/1 504.01 536.13 482.14 528.21 2021/7/1 525.72 557.54 504.66 517.57 2021/8/1 519 569.48 505.37 569.19 2021/9/1 569 619 568.08 610.34 2021/10/1 604.24 690.97 594.68 690.31 Date L S Q R Adj Close Volume Return 339.5 3.07E+08 0.054786468 358.1 1.48E+08 -0.004300497 356.56 1.45E+08 0.039208019 370.54 1.65E+08 -0.073568331 343.28 1.25E+08 0.070030319 367.32 1.11E+08 -0.120685005 322.99 1.97E+08 -0.09052909 293.75 1.37E+08 -0.088953209 267.62 1.75E+08 0.07394817 287.41 2.32E+08 0.094812288 314.66 1.14E+08 0.028316287 323.57 1.25E+08 0.066507984 345.09 1.7E+08 0.069373216 369.03 1.14E+08 0.017532453 375.5 2.02E+08 0.118109204 419.85 2.25E+08 -0.000285804 419.73 1.35E+08 0.084125502 455.04 1.17E+08 0.074367078 488.88 2.32E+08 0.083210589 529.56 1.16E+08 -0.055763273 500.03 1.19E+08 -0.048577103 475.74 1.54E+08 0.031445795 490.7 91788900 0.101956321 540.73 77564100 -0.01542353 532.39 1.4E+08 0.012133888 538.85 61902300 -0.031901278 521.66 90183900 -0.015699886 513.47 1.12E+08 -0.020760655 502.81 66927600 0.050516147 528.21 78560600 -0.020143531 517.57 77221200 0.09973529 569.19 54747700 0.072295762 610.34 82317500 0.131025277 690.31 98576300 -0.070127876 S T A B D E F G 35 2021/10/1 259.46668 371.7367 254.53 371.3333 371.3333 1.59E+09 H 0.027612188 -0.076854519 -0.113609319 36 2021/11/1 381.66666 414.4967 37 38 39 40 41 2022/4/1 360.38333 384.29 42 2022/5/1 286.92334 43 2022/6/1 44 45 326.2 381.5867 381.5867 1.95E+09 2021/12/1 386.89999 390.9467 295.3733 352.26 352.26 1.53E+09 2022/1/1 382.58334 402.6667 264.0033 312.24 312.24 1.92E+09 -0.070768158 2022/2/1 311.73666 315.9233 233.3333 290.1433 290.1433 1.39E+09 0.238008809 2022/3/1 289.89334 371.59 252.0133 359.2 359.2 1.73E+09 -0.191945111 273.9 290.2533 290.2533 1.52E+09 -0.129197486 318.5 206.8567 252.7533 252.7533 1.95E+09 -0.111887738 251.72 264.21 208.6933 224.4733 224.4733 2.01E+09 0.323765263 2022/7/1 227 298.32 216.1667 297.15 297.15 1.74E+09 -0.072488674 2022/8/1 301.27667 314.6667 271.81 275.61 275.61 1.7E+09 -0.037589295 46 2022/9/1 272.57999 313.8 262.47 265.25 265.25 1.3E+09 -0.142167793 47 2022/10/1 254.5 257.5 198.59 227.54 227.54 1.74E+09 -0.144326259 48 2022/11/1 234.05 237.4 166.19 194.7 194.7 1.89E+09 -0.367334351 49 2022/12/1 197.08 198.92 108.24 123.18 123.18 2.94E+09 0.406234786 2023/1/1 118.47 180.68 101.81 173.22 173.22 3.9E+09 0.18756498 2023/2/1 173.89 217.65 169.93 205.71 205.71 3.62E+09 0.008507121 2023/3/1 206.21001 207.79 163.91 207.46 207.46 3.31E+09 -0.207991938 2023/4/1 199.91 202.69 152.37 164.31 164.31 2.51E+09 0.241129545 2023/5/1 163.17 204.48 158.83 203.93 203.93 2.68E+09 0.283626725 2023/6/1 202.59 276.99 199.37 261.77 261.77 3.44E+09 0.021622051 2023/7/1 276.48999 299.29 254.12 267.43 267.43 2.39E+09 -0.034962443 2023/8/1 266.26001 266.47 212.36 258.08 258.08 2.5E+09 -0.03045562 2023/9/1 257.26001 278.98 234.58 250.22 250.22 2.44E+09 -0.197346354 244.81 268.94 194.07 200.84 200.84 2.59E+09 60 2023/11/1 204.03999 252.75 197.85 240.08 240.08 2.65E+09 2023/12/1 233.14 254.13 228.2 253.5 253.5 1.34E+09 50 51 52 53 54 55 56 57 58 59 2023/10/1 0.19537944 0.055898025 61 62 63 64 65 66 67 68 69 K < < > > C52.SI Sheet1 + Ave mthly return Ave mthly Std Dev Ann Ave mthly return Ann Ave mthly Std Dev Correlation I 0.065139 0.222557 0.781664 0.77096 0.454676 J K L M N O P Q R 2021/10/1 604.24 690.97 594.68 690.31 690.31 98576300 -0.070127876 2021/11/1 689.06 700.99 640.01 641.9 641.9 64530200 -0.061473782 2021/12/1 649.48 654.52 581.74 602.44 602.44 59975300 -0.290983312 2022/1/1 605.61 609.99 351.46 427.14 427.14 2.42E+08 -0.076368462 2022/2/1 432.96 458.48 354.72 394.52 394.52 1.51E+08 -0.050517068 2022/3/1 391.6 396.5 329.82 374.59 374.59 1.19E+08 -0.491817713 2022/4/1 376.8 396.02 185.6 190.36 190.36 4.03E+08 0.037192693 2022/5/1 191.71 204.38 162.71 197.44 197.44 2.52E+08 -0.114313243 2022/6/1 198.7 207.38 164.28 174.87 174.87 1.93E+08 0.286098247 2022/7/1 176.49 230.75 169.7 224.9 224.9 2.7E+08 -0.005958186 2022/8/1 223.1 251.99 218.74 223.56 223.56 1.52E+08 0.053140115 2022/9/1 220.72 250.49 214.69 235.44 235.44 2.34E+08 0.239721383 2022/10/1 237.85 305.63 211.73 291.88 291.88 3.35E+08 0.046765773 2022/11/1 296.17 312.71 252.09 305.53 305.53 1.86E+08 -0.034857441 2022/12/1 303.99 332.72 273.41 294.88 294.88 1.93E+08 0.200013494 2023/1/1 298.06 369.02 288.7 353.86 353.86 2.06E+08 -0.089668178 2023/2/1 353.86 379.43 314.3 322.13 322.13 1.23E+08 0.072486281 2023/3/1 321.55 345.84 285.33 345.48 345.48 1.58E+08 -0.045009892 2023/4/1 341.83 349.8 316.1 329.93 329.93 1.28E+08 0.19792083 2023/5/1 329.44 405.11 315.62 395.23 395.23 1.45E+08 0.114515542 2023/6/1 397.41 448.65 393.08 440.49 440.49 1.47E+08 -0.003450678 2023/7/1 439.76 485 411.88 438.97 438.97 1.69E+08 -0.012050956 2023/8/1 437.37 445.25 398.15 433.68 433.68 1.07E+08 -0.129311907 2023/9/1 437.73 453.45 371.1 377.6 377.6 1E+08 0.090280708 2023/10/1 377.48 418.84 344.73 411.69 1.64E+08 0.151278872 2023/11/1 414.77 482.7 414.18 473.97 71741400 -0.004029797 2023/12/1 473.17 481.25 445.73 411.69 473.97 472.06 472.06 51085400 Ave mthly return Ave mthly Std Dev Ann Ave mthly return Ann Ave mthly Std Dev T 0.013497 0.1179222 0.1619635 0.4084944 1 ER1 2 SD1=01 3 Correlation 4 5 Part B 6 w1 7 8 9 10 11 12 13 14 15 16 17 A 18 19 20 21 22 23 24 25 26 27 28 29 30 190% 185% 180% 175% 170% 165% 160% 155% 150% 145% 140% 135% 130% 125% 120% 115% 110% 105% 100% 95% 90% 85% 80% 31 32 33 34 35 K < > > 75% 70% 65% 60% 55% 50% B 0.781664 0.77096 0.454676 w2 ER2 SD2=02 rf Erp SDp -90% 1.33834 1.339394 -85% 1.305559 1.308409 -80% 1.272867 1.277424 -75% 1.24027 1.246439 -70% 1.207776 1.215454 -65 % 1.175394 1.184469 -60% 1.143133 1.153484 -55% 1.111004 1.122499 -50% 1.079019 1.091514 -45% 1.04719 1.060529 -40% 1.015532 1.029544 -35% 0.984063 0.998559 0.9528 0.967574 -30% -25% 0.921765 0.936589 -20% 0.890982 0.905604 -15% 0.860476 0.874619 -10% 0.83028 0.843634 -5% 0.800428 0.812649 0% 0.77096 0.781664 5% 0.741921 0.750679 10% 0.713365 0.719694 15% 0.685352 0.688709 20% 0.65795 0.657724 25% 0.63124 0.626739 30% 0.605314 0.595754 35% 0.580275 0.564769 40% 0.556244 0.533784 45% 0.533358 0.502799 50% 0.511769 0.471814 C52.SI Sheet1 + E 0.161963453 0.408494364 0.03910 1.5 F G Part C W = w1 w2 H ORP W = 1-W. [E()-r]xo-[E()-]x P20102 [E(r)-r]xo +[E(r)-r]xo? -[E()-r+E(r)-r]P120102 1.456098 -0.4561 Erp ORP J - K L M N O P Part D W = Q MVP w1 w2 W =1-w. 02-P120102 0 +0-2012010 R 0.049857 0.950143 S T U 31 32 33 34 35 36 37 38 39 40 41 42 43 44 45 46 47 48 49 50 51 52 53 54 55 56 57 58 59 60 61 62 63 64 65 K < A 70% 65% 60% 55% 50% 45% 40% 35% 30% 5% 25% 20% 15% 10% 5% 0% - 5% -10% -15% -20% B C 30% 0.605314 0.595754 35% 0.580275 0.564769 40% 0.556244 0.533784 45% 0.533358 0.502799 50% 0.511769 0.471814 55% 0.49165 0.440829 60% 0.473186 0.409844 65% 0.45658 0.378859 70% 0.442041 0.347874 95% 0.407047 0.19286 75% 0.429778 0.316889 80% 0.41999 0.285903 -0.5 85% 0.412855 0.254918 90% 0.408511 0.223933 95% 0.407047 0.192948 100% 0.408494 0.161963 105% 0.412822 0.130978 110% 0.419942 0.099993 115 % 0.429715 0.069008 120% 0.441964 0.038023 125% 0.456491 0.007038 130% 0.473086 -0.02395 135% 0.491539 -0.05493 140% 0.51165 -0.08592 145% 0.533231 -0.1169 150% 0.55611 -0.14789 155% 0.580135 -0.17887 160 % 0.605168 -0.20986 165% 0.63109 -0.24084 170 % 0.657796 -0.27183 175% 0.685194 -0.30281 180 % 0.713204 -0.3338 185% 0.741757 -0.36478 190% 0.770793 -0.39577 195% 0.800259 -0.42675 -25% -30% -35% -40% -45% -50% -55% -60% -65% -70% -75% -80% -85% -90% -95% > > C52.SI Sheet1 + E 1.5 1 0.5 0 -1 -1.5 0 F 0.2 MVP 0.4 G 06 H Erp 0.8 ORP 1 J 1.2 K 1.4 L M N O P Q R S T U 55 56 57 58 59 60 61 62 63 64 65 66 67 68 69 70 71 72 73 74 75 76 77 78 79 80 81 82 83 84 85 86 87 88 89 K < < A -45% -50% -55% -60% -65% -70% -75% -80% -85% -90% -95% - 100% -105% -110% -115% -120% -125% -130% - 135% - 140% -145% -150% -155% -160% -165% -170% -175% -180% 1.456098 B D 145% 0.533231 -0.1169 150% 0.55611 -0.14789 155% 0.580135 -0.17887 160 % 0.605168 -0.20986 165% 0.63109 -0.24084 170 % 0.657796 -0.27183 175% 0.685194 -0.30281 180% 0.713204 -0.3338 185% 0.741757 -0.36478 190% 0.770793 -0.39577 195% 0.800259 -0.42675 200% 0.830109 -0.45774 205% 0.860303 -0.48872 210% 0.890807 -0.51971 215% 0.921589 -0.55069 220% 0.952623 -0.58168 225% 0.983884 -0.61266 230% 1.015352 -0.64365 235% 1.047009 -0.67463 240% 1.078837 -0.70562 245 % 1.110821 -0.7366 250 % 1.142949 -0.76759 255% 1.17521 -0.79857 260% 1.207591 -0.82956 265% 1.240084 -0.86054 270% 1.27268 -0.89153 275% 1.305372 -0.92251 280% 1.338152 -0.9535 -46% 1.051063 1.064308 > > C52.SI Sheet1 + E F G H 1 J K L M N O P Q R S T U
Expert Answer:

Related Book For 

Income Tax Fundamentals 2013
ISBN: 9781285586618
31st Edition
Authors: Gerald E. Whittenburg, Martha Altus Buller, Steven L Gill
Posted Date:
Students also viewed these finance questions
-
KYC's stock price can go up by 15 percent every year, or down by 10 percent. Both outcomes are equally likely. The risk free rate is 5 percent, and the current stock price of KYC is 100. (a) Price a...
-
Q1. You have identified a market opportunity for home media players that would cater for older members of the population. Many older people have difficulty in understanding the operating principles...
-
Show the income statement, cash flow statement and balance sheet of the company at 31/12/2020 if: 1. The company start its operations on June 1st, 2020. Over the period, it sells 50 laptop for $400....
-
John and Sandy Ferguson got married eight years ago and have a seven-year-old daughter Samantha. In 2017, John worked as a computer technician at a local university earning a salary of $52,000, and...
-
The bar AB from Prob. 5/74 is repeated here. If the velocity of point A is 3 m/s to the right and is constant for an interval including the position shown, determine the tangential acceleration of...
-
A bicyclist leaves from her home at 9 A.M. and rides to a beach \(40 \mathrm{mi}\) away. Because of a breeze off the ocean, the temperature at the beach remains \(60^{\circ} \mathrm{F}\) throughout...
-
Transpiration cooling in a planar system, two large flat porous horizontal plates is separated by a relatively small distance L. The upper plate at y = L is at temperature TL, and the lower one at y...
-
The bill and memo: Read A.3252 of 2023, The Billionaire Mark-to-Market Tax Act, and the accompanying bill memo. Bill memos are not always faithful to the bill so be sure to read the bill carefully....
-
Fitz Products Inc. reported $1,075,049 profit in 2023 and declared preferred dividends of $75,100. The following changes in common shares outstanding occurred during the year. Jan. 1 78,000 common...
-
Austin and Brittany need some help determining what their approximate tax situation will be for this year. In addition to what you already know: Brittany plans to contribute $4000 to an RSP this...
-
What are the advantages of chemical machining?
-
Project manager Mark is currently working on a new office automation project and is consistently being asked for updates and meetings with the project sponsor. Mark informs the sponsor that the...
-
Assume you are an analyst evaluating Mesco Company. The following data are available in your financial analysis (unless otherwise indicated, all data are as of December 31, Year 5): Retained...
-
Donna has leased a home unit to live in for the past two years. The lease expired two weeks ago and the real estate agent has just advised her that the rent will go up by 5% at the end of this month....
-
A 6% coupon 10-year bond with a par value 100 is selling at par and is deliverable against a futures contract that settles in 4 months. The current repo rate is 4% p.a. Assume the futures price is...
-
The initial investment of a machine is 320,000 and a salvage value of 60,000 at the end of 15 years. the annual operating cost was 20,000 money is worth 5% compounded annually. a. what's the...
-
Will the prediction interval always be wider than the estimation interval for the same value of the independent variable? Briefly explain.
-
Skyler is covered by his company's health insurance plan. The health insurance costs his company $3,500 a year. During the year, Skyler is diagnosed with a serious illness and the health insurance...
-
Patty Bayan is a single taxpayer living at 543 Space Drive, Houston, TX 77099. Her Social Security number is 466-33-1234. For 2012, Patty has no dependents, and her W-2 from her job at a local...
-
Jim is fired from his job as a waiter and decides to take an extended trip to Europe. After touring Europe for 3 months, Jim returns to look for a new job as a waiter. Are his job-hunting expenses...
-
Give a description for three foundation concepts in stability model.
-
Describe three main steps to identifying EBTs.
-
(T/F) EBTs should have a direct physical representation.

Study smarter with the SolutionInn App