

Case Questions: Recall from class that components (in the WACC formula) are based on the (long-term) target
Question:


Case Questions:
Recall from class that components (in the WACC formula) are based on the (long-term) target debt-equity ratio.
Assumptions:
The beta of debt (for both Midland and its divisions) is zero.
A marginal corporate tax rate of 40%.
Midland will be using the cost of capital estimates to evaluate long-term projects.
Questions
1. a) Compute the asset beta of Midland (as a whole).
b) Compute the WACC (with taxes) for Midland.
2. a) Estimate the asset beta for the Exploration & Production division.
b) Compute the WACC (with taxes) for the Exploration & Production division.
3. a) Estimate the asset beta for the Refining & Marketing division.
b) Compute the WACC (with taxes) for the Refining & Marketing division.
4. Given the data in the case, how would you estimate the asset beta and the WACC for the Petrochemical division? A qualitative response (with some rough calculations) will suffice.
Note: I am looking for an explanation other than that of identifying/using suitable comparables for the Petrochemicals division.
5. Should Midland compute and use a separate cost of capital for each of its divisions? Explain
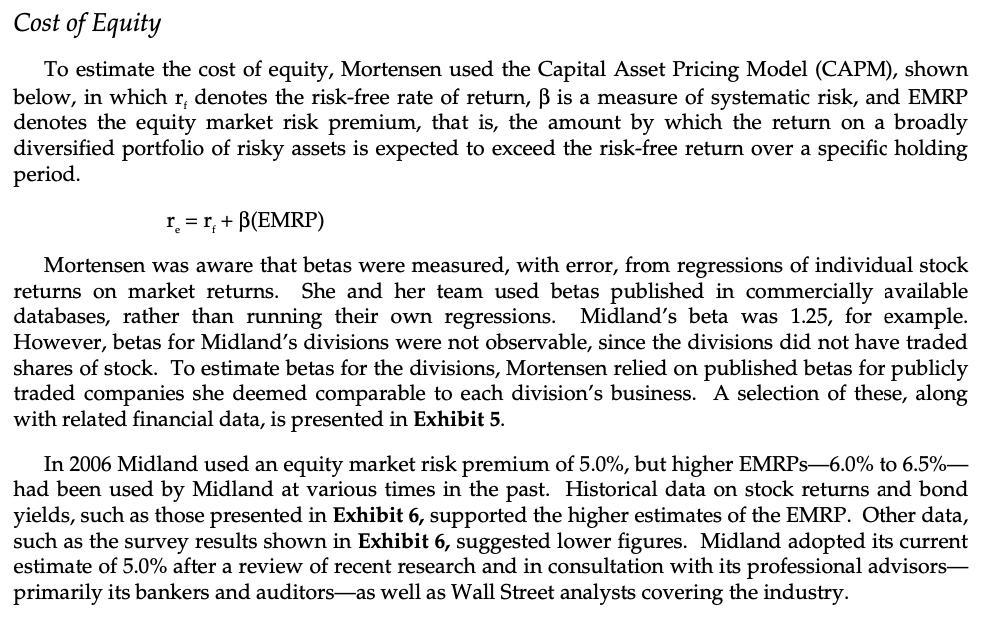
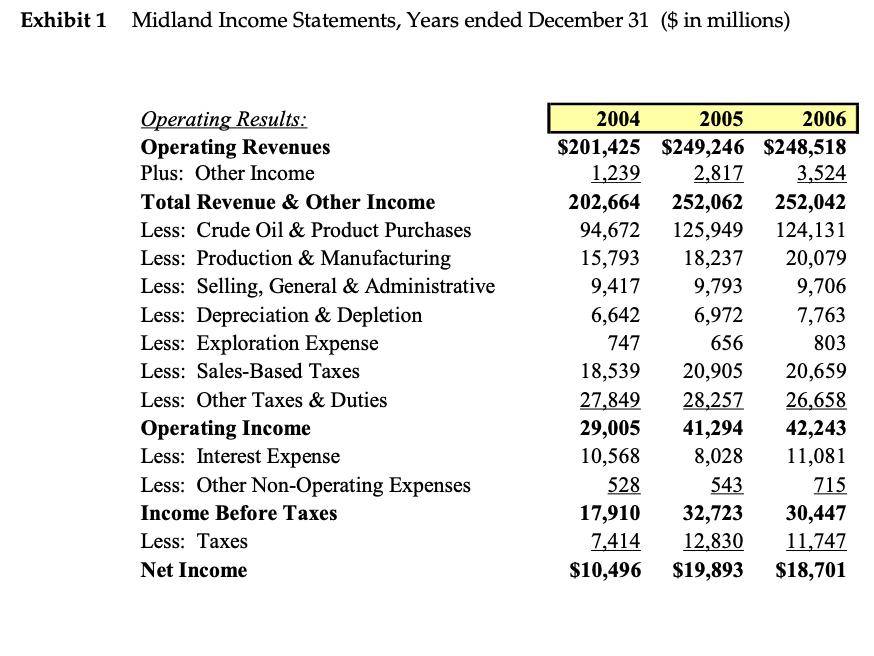
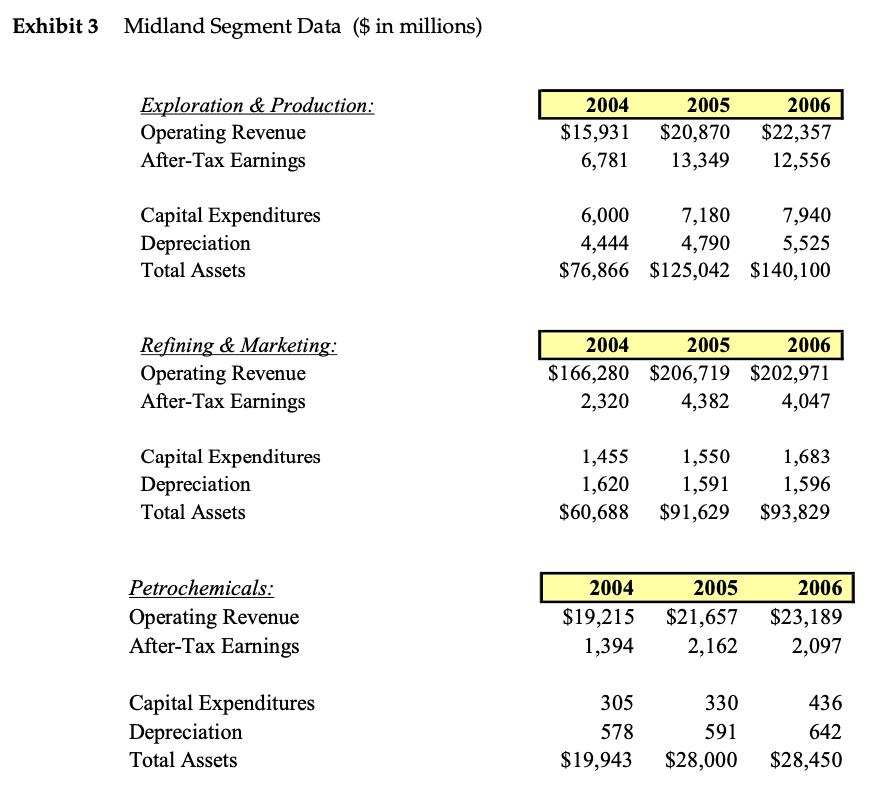
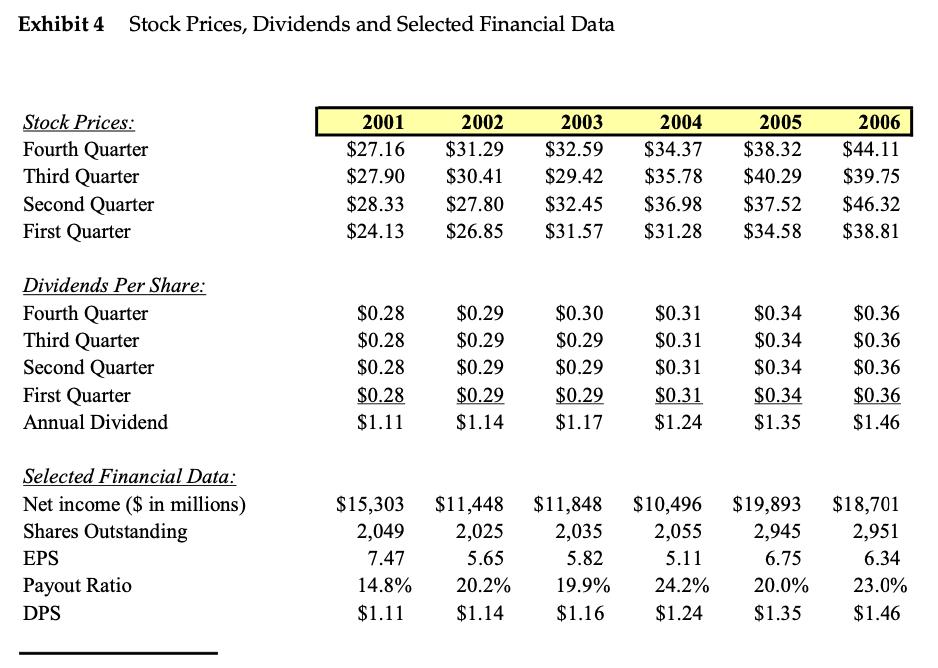
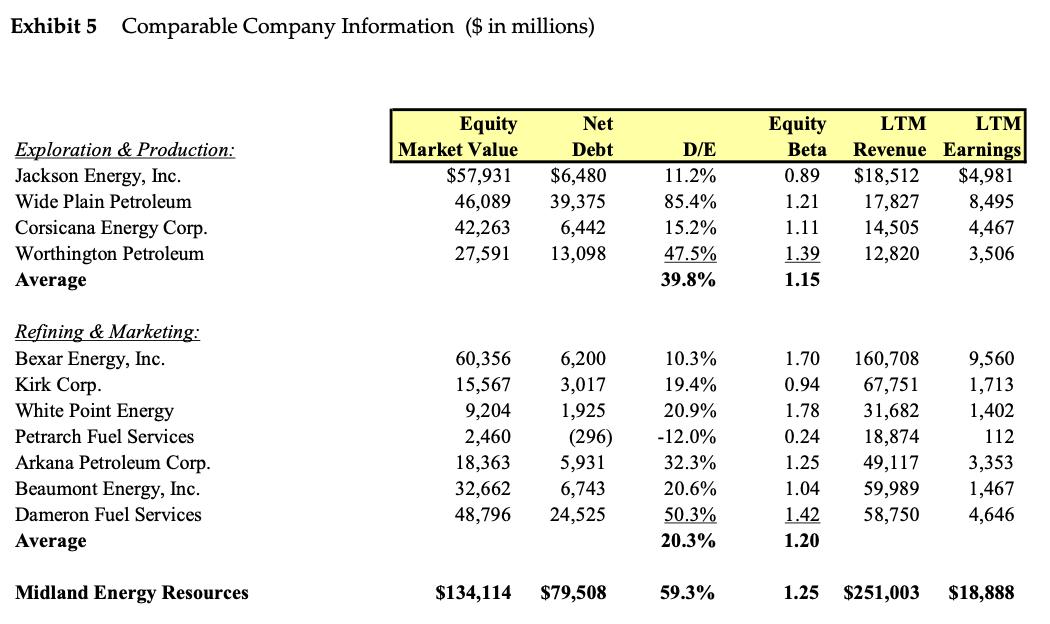
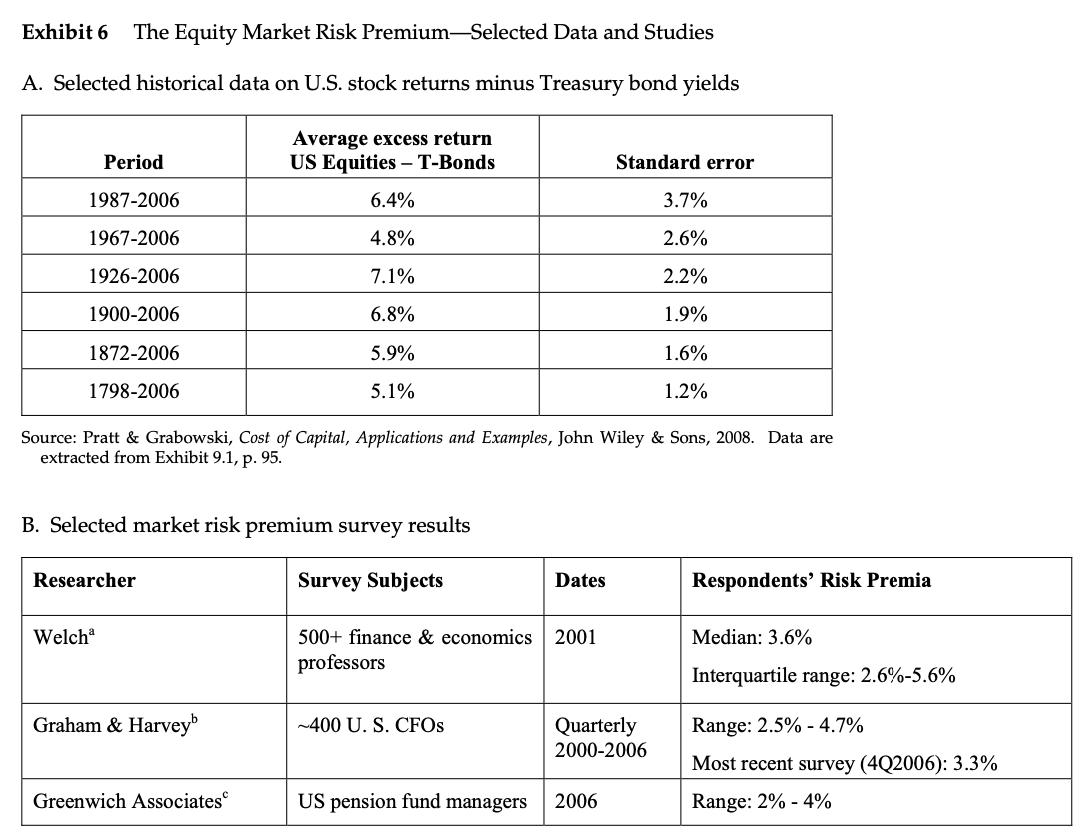
In late January 2007, Janet Mortensen, senior vice president of project finance for Midland Energy Resources, was preparing her annual cost of capital estimates for Midland and each of its three divisions. Midland was a global energy company with operations in oil and gas exploration and production (E&P), refining and marketing (R&M), and petrochemicals. On a consolidated basis, the firm had 2006 operating revenue and operating income of $248.5 billion and $42.2 billion, respectively. Estimates of the cost of capital were used in many analyses within Midland, including asset appraisals for both capital budgeting and financial accounting, performance assessments, M&A proposals, and stock repurchase decisions. Some of these analyses were performed at the division or business unit level, while others were executed at the corporate level. Midland s corporate treasury staff had begun preparing annual cost of capital estimates for the corporation and each division in the early 1980s. The estimates produced by treasury were often criticized, and Midland s division presidents and controllers sometimes challenged specific assumptions and inputs. In 2002, Mortensen, then a senior analyst reporting to the CFO, was asked to estimate Midland s cost of capital in connection with a large proposed share repurchase. Six months later she was asked to calculate corporate and divisional costs of capital that the executive and compensation committees of the board could incorporate in planned performance evaluations. Since then, Mortensen had undertaken a similar exercise each year and her estimates had become widely circulated de facto standards in many analyses throughout the company, even ones in which they were not formally required. By 2007 Mortensen was aware that her calculations had become influential and she devoted ever more time and care to their preparation. Lately she wondered whether they were actually appropriate for all applications and she was considering appending a sort of user s guide to the 2007 set of calculations. Midland s Operations Midland Energy Resources had been incorporated more than 120 years previously and in 2007 had more than 80,000 employees. Exhibits 1 and 2 present Midland s most recent consolidated financial statements. Exhibit 3 presents selected business segment data for the period 2004-06. Exploration & Production Midland engaged in all phases of exploration, development, and production, though the last of these, production, dominated the E&P division s reported operating results. During 2006, Midland extracted approximately 2.10 million barrels of oil per day-a 6.3% increase over 2005 production- and roughly 7.28 billion cubic feet of natural gas per day-an increase of slightly less than 1% over 2005. This represented $22.4 billion of revenue and after-tax earnings of $12.6 billion. E&P was Midland s most profitable business, and its net margin over the previous five years was among the highest in the industry. Midland expected continued global population and economic growth to result in rising demand for its products for the foreseeable future. Nevertheless, the fraction of production coming from non- traditional sources such as deepwater drilling, heavy oil recovery, liquefied natural gas (LNG), and arctic technology was expected to increase. Further, the geographic composition of output was shifting, marked by increases from places such as the Middle East, Central Asia, Russia, and West Africa. With oil prices at historic highs in early 2007, Midland anticipated continued heavy investment in acquisitions of promising properties, in development of its proved undeveloped reserves, and in expanding production. In particular, continued high prices underlay plans to boost investment in sophisticated extraction methods that extended the lives of older fields and marginal properties. Capital spending in E&P was expected to exceed $8 billion in 2007 and 2008. Refining and Marketing Midland had ownership interests in 40 refineries around the world with distillation capacity of 5.0 million barrels a day. Measured by revenue, Midland s refining and marketing business was the company s largest. Global revenue for 2006 was $203.0 billion-a slight decrease of approximately 1.8% over 2005. The division faced stiff competition, as its products were highly commoditized. After-tax earnings for refining and marketing totaled only $4.0 billion. The relatively small margin was consistent with a long-term trend in the industry; margins had declined steadily over the previous 20 years. Though most of Midland s refinery output was gasoline and was sold as fuel for automobiles, the company also had manufacturing capacity to produce approximately 120,000 barrels of base-stock lubricants per day. Midland believed its capacity was as technologically advanced as any in the industry. Advanced technology and vertical integration combined to make Midland a market leader in this business. Midland projected capital spending in refining and marketing would remain stable, without substantial growth in 2007-08. This reflected both the historical trends of low and shrinking margins and the difficulty of obtaining the myriad approvals necessary to expand or to build and operate a new refinery. However, most analysts projected a longer-term global shortage of refining capacity that would eventually spur investment in this segment. Petrochemicals Petrochemicals was Midland s smallest division, but was a substantial business nonetheless. Midland owned outright or had equity interests in 25 manufacturing facilities and five research centers in eight countries around the world. The company s chemical products included polyethylene, polypropylene, styrene and polystyrene as well as olefins, 1-hexene, aromatics, and fuel and lubricant additives. In 2006, revenue and after-tax earnings were $23.2 billion and $2.1 billion, respectively. Capital spending in petrochemicals was expected to grow in the near-term as several older facilities were sold or retired and replaced by newer, more efficient capacity. Much of the new investment would be undertaken by joint ventures outside the United States in which Midland s Petrochemicals Division owned a substantial minority interest. Midland s Financial and Investment Policies Midland s financial strategy in 2007 was founded on four pillars: (1) to fund significant overseas growth; (2) to invest in value-creating projects across all divisions; (3) to optimize its capital structure; and (4) to opportunistically repurchase undervalued shares. Overseas Growth The most easily exploited domestic resources had been put into production decades previously. Consequently, overseas investments were the main engine of growth for most large U.S. producers, and Midland was no exception. Midland usually invested in foreign projects alongside either a foreign government or a local business as partner. Often, these investments had specialized financial and contractual arrangements similar in many respects to project financing. In most cases, Midland acted as the lead developer of the project, for which it collected a management fee or royalty. Midland and its foreign partner shared the equity interest, with the foreign partner generally receiving at least 50% plus a preferred return. Despite the fact that the investments were located abroad, Midland analyzed and evaluated them in U.S. dollars by converting foreign currency cash flows to dollars and applying U.S. dollar discount rates. In 2006, Midland had earnings from equity affiliates of approximately $4.75 billion. The majority of these earnings, 77.7%, came from non-US investments. Value-creating Investments Midland used discounted cash flow methodologies to evaluate most prospective investments. Midland s DCF methods typically involved debt-free cash flows and a hurdle rate equal to or derived from the WACC for the project or division. However, Midland s interests in some overseas projects were instead analyzed as streams of future equity cash flows and discounted at a rate based on the cost of equity. The performance of a business or division over a given historical period was measured in two main ways. The first was performance against plan over 1-, 3-, and 5-year periods. The second was based on economic value added (EVA), in which debt-free cash flows¹ were reduced by a capital charge, and expressed in dollars.² The capital charge was computed as the WACC for the business or division times the amount of capital it employed during the period. Optimal Capital Structure Midland optimized its capital structure in large part by prudently exploiting the borrowing capacity inherent in its energy reserves and in long-lived productive assets such as refining facilities. Debt levels were regularly reevaluated and long-term targets set accordingly. In particular, changes in energy price levels were correlated with changes in Midland s stock price, and necessitated regular reassessments of optimal borrowing. In 2007 both oil prices and Midland s stock price were at historic highs, which-all else equal-increased the company s borrowing capacity. This in turn represented an opportunity to shield additional profits from taxes. Each of Midland s divisions had its own target debt ratio. Targets were set based on considerations involving each division s annual operating cash flow and the collateral value of its identifiable assets. Targets themselves tended to be sticky, but changes in the market value of specific collateral, such as oil reserves, or the market capitalization of the company as a whole could drive actual debt ratios away from corresponding targets. Mortensen s team did not set targets-they were set in consultations among division and corporate executives and the board-but Mortensen did estimate a debt rating for each division based on its target, and a corresponding spread over treasury bonds to estimate divisional and corporate costs of debt.3 Mortensen s preliminary estimates for 2007 are shown below in Table 1. Table 1 Business Segment: Consolidated Exploration & Production Refining & Marketing Petrochemicals Credit Rating A+ Maturity: 1-Year A+ BBB AA- 10-Year 30-Year Debt/ Spread to Value Treasury 42.2% 1.62% Note: Debt/Value is based on market values. 46.0% 31.0% 40.0% At December 31, 2006, the company s debt was rated A+ by Standard & Poor s. Table 2 gives yields to maturity for U.S. Treasury bonds in January 2007. Table 2 1.60% 1.80% 1.35% Rate: 4.54% 4.66% 4.98% Finally, although prudent use of Midland s debt capacity was a primary determinant of capital structure, other considerations played important roles as well. In particular, the strength of Midland s consolidated balance sheet and its access to global financial and commodity markets sometimes presented attractive opportunities to trade securities and commodities. Midland was conservative compared to some of its large competitors, but it did have a group of traders in-house who actively managed currency, interest rate, and commodity risks within a set of guidelines approved by the board. The desire to manage certain risks, or to take advantage of private information or unusual pricing relationships, was an additional reason that the actual capital structure sometimes departed, temporarily, from planned targets. Stock Repurchases In the past, Midland had repurchased its own shares on occasion, and had stated that it would do so again whenever attractive opportunities arose. Consequently, the company regularly estimated the intrinsic value of its shares by subtracting the market value of its debt from the fundamental value of the enterprise and dividing the result by the number of shares outstanding. The fundamental value of the consolidated enterprise was estimated using DCF analyses and a comparison of the company s trading multiples with those of its peers. When the stock price fell below the stock s intrinsic value, Midland considered repurchasing its shares. Small numbers of shares could be purchased on the open market; larger blocks would be bought via self-tenders. Midland had not repurchased shares in large numbers since 2002 and no large purchases were anticipated by analysts in the near future, given the company s high stock price. Nevertheless, Midland executives pointed out that the mere fact that the stock price had risen did not mean the shares were not undervalued - intrinsic value had clearly risen as well, and Midland remained committed to repurchasing shares when they were undervalued. Exhibit 4 shows Midland s historical stock prices, dividends per share, and selected financial data for the period 2001-06. Estimating the Cost of Capital Mortensen s primary calculations were based on the formula for WACC shown below. In this expression, D and E are the market values of the debt and equity respectively, and V is the firm s or division s enterprise value (V = D + E). Similarly, r and r are the costs of debt and equity, respectively, and t is the tax rate. (2)α-1) + r WACC=ra Cost of Debt Mortensen computed the cost of debt for each division by adding a premium, or spread, over U.S. Treasury securities of a similar maturity. The spread depended on a variety of factors, including the division s cash flow from operations, the collateral value of the division s assets, and overall credit market conditions. For some of Midland s operations, long-term expected cash flow and collateral value were affected by political risk. This risk was most apparent, for example, in the exploration and production division. A significant fraction of E&P s productive assets and proven reserves were located in politically volatile countries in which the risk of nationalization or a forced renegotiation of production rights was significant. All else equal, such properties supported less borrowing than might otherwise be expected. Cost of Equity To estimate the cost of equity, Mortensen used the Capital Asset Pricing Model (CAPM), shown below, in which r, denotes the risk-free rate of return, ß is a measure of systematic risk, and EMRP denotes the equity market risk premium, that is, the amount by which the return on a broadly diversified portfolio of risky assets is expected to exceed the risk-free return over a specific holding period. r = r + B(EMRP) Mortensen was aware that betas were measured, with error, from regressions of individual stock returns on market returns. She and her team used betas published in commercially available databases, rather than running their own regressions. Midland s beta was 1.25, for example. However, betas for Midland s divisions were not observable, since the divisions did not have traded shares of stock. To estimate betas for the divisions, Mortensen relied on published betas for publicly traded companies she deemed comparable to each division s business. A selection of these, along with related financial data, is presented in Exhibit 5. In 2006 idland used an equity market risk premium of 5.0%, but higher EMRPs-6.0% to 6.5%- had been used by Midland at various times in the past. Historical data on stock returns and bond yields, such as those presented in Exhibit 6, supported the higher estimates of the EMRP. Other data, such as the survey results shown in Exhibit 6, suggested lower figures. Midland adopted its current estimate of 5.0% after a review of recent research and in consultation with its professional advisors- primarily its bankers and auditors—as well as Wall Street analysts covering the industry. Midland Income Statements, Years ended December 31 ($ in millions) Operating Results: Operating Revenues Plus: Other Income Total Revenue & Other Income Less: Crude Oil & Product Purchases Less: Production & Manufacturing Less: Selling, General & Administrative Less: Depreciation & Depletion Less: Exploration Expense Less: Sales-Based Taxes Less: Other Taxes & Duties Operating Income Less: Interest Expense Less: Other Non-Operating Expenses Income Before Taxes Less: Taxes Net Income 2004 2005 2006 $201,425 $249,246 $248,518 1,239 2,817 3,524 202,664 252,062 252,042 125,949 124,131 18,237 20,079 9,793 9,706 6,972 7,763 656 803 94,672 15,793 9,417 6,642 747 18,539 20,905 20,659 27,849 28,257 26,658 29,005 41,294 42,243 10,568 8,028 11,081 528 543 715 30,447 11,747 $18,701 17,910 32,723 7,414 12,830 $10,496 $19,893 Exhibit 2 Midland Balance Sheets, at December 31 ($ in millions) Assets: Cash & Cash equivalents Restricted Cash Notes Receivable Inventory Prepaid Expenses Total Current Assets Investments & Advances Net Property, Plant & Equipment Other Assets Total Assets Liabilities & Owners Equity: Accounts Payable & Accrued Liabilities Current Portion of Long-Term Debt Taxes Payable Total Current Liabilities Long-Term Debt Post Retirement Benefit Obligations Accrued Liabilities Deferred Taxes Other Long-Term Liabilities Total Shareholders Equity Total Liabilities & Owners Equity 2005 $16,707 3,131 18,689 6,338 2,218 47,083 30,140 34,205 156,630 167,350 10,818 9,294 244,671 262,378 2006 $19,206 3,131 19,681 7,286 2,226 51,528 24,562 26,576 26,534 20,767 5,723 5,462 56,819 52,805 82,414 6,950 4,375 14,197 2,423 77,493 $244,671 81,078 9,473 4,839 14,179 2,725 97,280 $262,378 Exhibit 3 Midland Segment Data ($ in millions) Exploration & Production: Operating Revenue After-Tax Earnings Capital Expenditures Depreciation Total Assets Refining & Marketing: Operating Revenue After-Tax Earnings Capital Expenditures Depreciation Total Assets Petrochemicals: Operating Revenue After-Tax Earnings Capital Expenditures Depreciation Total Assets 2004 $15,931 6,781 6,000 4,444 $76,866 2005 2006 $20,870 $22,357 13,349 12,556 2004 2005 2006 $166,280 $206,719 $202,971 2,320 4,382 4,047 2004 $19,215 1,394 7,180 7,940 4,790 5,525 $125,042 $140,100 1,455 1,550 1,620 1,591 $60,688 $91,629 305 578 $19,943 2005 $21,657 2,162 330 591 $28,000 1,683 1,596 $93,829 2006 $23,189 2,097 436 642 $28,450 Exhibit 4 Stock Prices, Dividends and Selected Financial Data Stock Prices: Fourth Quarter Third Quarter Second Quarter First Quarter Dividends Per Share: Fourth Quarter Third Quarter Second Quarter First Quarter Annual Dividend Selected Financial Data: Net income ($ in millions) Shares Outstanding EPS Payout Ratio DPS 2001 2002 2003 2004 $27.16 $31.29 $32.59 $34.37 $27.90 $30.41 $29.42 $35.78 $28.33 $27.80 $32.45 $36.98 $24.13 $26.85 $31.57 $31.28 $0.28 $0.28 $0.28 $0.28 $1.11 $0.29 $0.29 $0.29 $0.29 $1.14 $0.30 $0.29 $0.29 $0.29 $1.17 $0.31 $0.31 $0.31 $0.31 $1.24 2005 $38.32 $40.29 $37.52 $34.58 $0.34 $0.34 $0.34 $0.34 $1.35 2006 $44.11 $39.75 $46.32 $38.81 $0.36 $0.36 $0.36 $0.36 $1.46 $15,303 $11,448 $11,848 $10,496 $19,893 $18,701 2,049 2,025 2,035 2,055 2,945 2,951 7.47 5.65 5.82 5.11 6.75 6.34 14.8% 20.2% 19.9% 24.2% 20.0% 23.0% $1.11 $1.14 $1.16 $1.24 $1.35 $1.46 Exhibit 5 Comparable Company Information ($ in millions) Exploration & Production: Jackson Energy, Inc. Wide Plain Petroleum Corsicana Energy Corp. Worthington Petroleum Average Refining & Marketing: Bexar Energy, Inc. Kirk Corp. White Point Energy Petrarch Fuel Services Arkana Petroleum Corp. Beaumont Energy, Inc. Dameron Fuel Services Average Midland Energy Resources Equity Market Value Net Debt $57,931 $6,480 46,089 39,375 42,263 6,442 27,591 13,098 6,200 3,017 1,925 60,356 15,567 9,204 2,460 18,363 32,662 6,743 48,796 24,525 (296) 5,931 $134,114 $79,508 D/E 11.2% 85.4% 15.2% 47.5% 39.8% 10.3% 19.4% 20.9% -12.0% 32.3% 20.6% 50.3% 20.3% 59.3% Equity Beta LTM LTM Revenue Earnings 0.89 $18,512 $4,981 1.21 17,827 8,495 1.11 14,505 4,467 1.39 12,820 3,506 1.15 1.70 160,708 0.94 67,751 1.78 31,682 0.24 1.2 1.04 1.42 1.20 18,874 49,117 59,989 58,750 9,560 1,713 1,402 112 3,353 1,467 4,646 1.25 $251,003 $18,888 Exhibit 6 The Equity Market Risk Premium-Selected Data and Studies A. Selected historical data on U.S. stock returns minus Treasury bond yields Average excess return US Equities - T-Bonds 6.4% 4.8% 7.1% 6.8% 5.9% 5.1% Period 1987-2006 1967-2006 1926-2006 1900-2006 1872-2006 1798-2006 B. Selected market risk premium survey results Source: Pratt & Grabowski, Cost of Capital, Applications and Examples, John Wiley & Sons, 2008. Data are extracted from Exhibit 9.1, p. 95. Researcher Welchª Graham & Harvey Greenwich Associates Survey Subjects Dates 500+ finance & economics 2001 professors ~400 U. S. CFOs Standard error Quarterly 2000-2006 US pension fund managers 2006 3.7% 2.6% 2.2% 1.9% 1.6% 1.2% Respondents Risk Premia Median: 3.6% Interquartile range: 2.6%-5.6% Range: 2.5% - 4.7% Most recent survey (4Q2006): 3.3% Range: 2% -4% In late January 2007, Janet Mortensen, senior vice president of project finance for Midland Energy Resources, was preparing her annual cost of capital estimates for Midland and each of its three divisions. Midland was a global energy company with operations in oil and gas exploration and production (E&P), refining and marketing (R&M), and petrochemicals. On a consolidated basis, the firm had 2006 operating revenue and operating income of $248.5 billion and $42.2 billion, respectively. Estimates of the cost of capital were used in many analyses within Midland, including asset appraisals for both capital budgeting and financial accounting, performance assessments, M&A proposals, and stock repurchase decisions. Some of these analyses were performed at the division or business unit level, while others were executed at the corporate level. Midland s corporate treasury staff had begun preparing annual cost of capital estimates for the corporation and each division in the early 1980s. The estimates produced by treasury were often criticized, and Midland s division presidents and controllers sometimes challenged specific assumptions and inputs. In 2002, Mortensen, then a senior analyst reporting to the CFO, was asked to estimate Midland s cost of capital in connection with a large proposed share repurchase. Six months later she was asked to calculate corporate and divisional costs of capital that the executive and compensation committees of the board could incorporate in planned performance evaluations. Since then, Mortensen had undertaken a similar exercise each year and her estimates had become widely circulated de facto standards in many analyses throughout the company, even ones in which they were not formally required. By 2007 Mortensen was aware that her calculations had become influential and she devoted ever more time and care to their preparation. Lately she wondered whether they were actually appropriate for all applications and she was considering appending a sort of user s guide to the 2007 set of calculations. Midland s Operations Midland Energy Resources had been incorporated more than 120 years previously and in 2007 had more than 80,000 employees. Exhibits 1 and 2 present Midland s most recent consolidated financial statements. Exhibit 3 presents selected business segment data for the period 2004-06. Exploration & Production Midland engaged in all phases of exploration, development, and production, though the last of these, production, dominated the E&P division s reported operating results. During 2006, Midland extracted approximately 2.10 million barrels of oil per day-a 6.3% increase over 2005 production- and roughly 7.28 billion cubic feet of natural gas per day-an increase of slightly less than 1% over 2005. This represented $22.4 billion of revenue and after-tax earnings of $12.6 billion. E&P was Midland s most profitable business, and its net margin over the previous five years was among the highest in the industry. Midland expected continued global population and economic growth to result in rising demand for its products for the foreseeable future. Nevertheless, the fraction of production coming from non- traditional sources such as deepwater drilling, heavy oil recovery, liquefied natural gas (LNG), and arctic technology was expected to increase. Further, the geographic composition of output was shifting, marked by increases from places such as the Middle East, Central Asia, Russia, and West Africa. With oil prices at historic highs in early 2007, Midland anticipated continued heavy investment in acquisitions of promising properties, in development of its proved undeveloped reserves, and in expanding production. In particular, continued high prices underlay plans to boost investment in sophisticated extraction methods that extended the lives of older fields and marginal properties. Capital spending in E&P was expected to exceed $8 billion in 2007 and 2008. Refining and Marketing Midland had ownership interests in 40 refineries around the world with distillation capacity of 5.0 million barrels a day. Measured by revenue, Midland s refining and marketing business was the company s largest. Global revenue for 2006 was $203.0 billion-a slight decrease of approximately 1.8% over 2005. The division faced stiff competition, as its products were highly commoditized. After-tax earnings for refining and marketing totaled only $4.0 billion. The relatively small margin was consistent with a long-term trend in the industry; margins had declined steadily over the previous 20 years. Though most of Midland s refinery output was gasoline and was sold as fuel for automobiles, the company also had manufacturing capacity to produce approximately 120,000 barrels of base-stock lubricants per day. Midland believed its capacity was as technologically advanced as any in the industry. Advanced technology and vertical integration combined to make Midland a market leader in this business. Midland projected capital spending in refining and marketing would remain stable, without substantial growth in 2007-08. This reflected both the historical trends of low and shrinking margins and the difficulty of obtaining the myriad approvals necessary to expand or to build and operate a new refinery. However, most analysts projected a longer-term global shortage of refining capacity that would eventually spur investment in this segment. Petrochemicals Petrochemicals was Midland s smallest division, but was a substantial business nonetheless. Midland owned outright or had equity interests in 25 manufacturing facilities and five research centers in eight countries around the world. The company s chemical products included polyethylene, polypropylene, styrene and polystyrene as well as olefins, 1-hexene, aromatics, and fuel and lubricant additives. In 2006, revenue and after-tax earnings were $23.2 billion and $2.1 billion, respectively. Capital spending in petrochemicals was expected to grow in the near-term as several older facilities were sold or retired and replaced by newer, more efficient capacity. Much of the new investment would be undertaken by joint ventures outside the United States in which Midland s Petrochemicals Division owned a substantial minority interest. Midland s Financial and Investment Policies Midland s financial strategy in 2007 was founded on four pillars: (1) to fund significant overseas growth; (2) to invest in value-creating projects across all divisions; (3) to optimize its capital structure; and (4) to opportunistically repurchase undervalued shares. Overseas Growth The most easily exploited domestic resources had been put into production decades previously. Consequently, overseas investments were the main engine of growth for most large U.S. producers, and Midland was no exception. Midland usually invested in foreign projects alongside either a foreign government or a local business as partner. Often, these investments had specialized financial and contractual arrangements similar in many respects to project financing. In most cases, Midland acted as the lead developer of the project, for which it collected a management fee or royalty. Midland and its foreign partner shared the equity interest, with the foreign partner generally receiving at least 50% plus a preferred return. Despite the fact that the investments were located abroad, Midland analyzed and evaluated them in U.S. dollars by converting foreign currency cash flows to dollars and applying U.S. dollar discount rates. In 2006, Midland had earnings from equity affiliates of approximately $4.75 billion. The majority of these earnings, 77.7%, came from non-US investments. Value-creating Investments Midland used discounted cash flow methodologies to evaluate most prospective investments. Midland s DCF methods typically involved debt-free cash flows and a hurdle rate equal to or derived from the WACC for the project or division. However, Midland s interests in some overseas projects were instead analyzed as streams of future equity cash flows and discounted at a rate based on the cost of equity. The performance of a business or division over a given historical period was measured in two main ways. The first was performance against plan over 1-, 3-, and 5-year periods. The second was based on economic value added (EVA), in which debt-free cash flows¹ were reduced by a capital charge, and expressed in dollars.² The capital charge was computed as the WACC for the business or division times the amount of capital it employed during the period. Optimal Capital Structure Midland optimized its capital structure in large part by prudently exploiting the borrowing capacity inherent in its energy reserves and in long-lived productive assets such as refining facilities. Debt levels were regularly reevaluated and long-term targets set accordingly. In particular, changes in energy price levels were correlated with changes in Midland s stock price, and necessitated regular reassessments of optimal borrowing. In 2007 both oil prices and Midland s stock price were at historic highs, which-all else equal-increased the company s borrowing capacity. This in turn represented an opportunity to shield additional profits from taxes. Each of Midland s divisions had its own target debt ratio. Targets were set based on considerations involving each division s annual operating cash flow and the collateral value of its identifiable assets. Targets themselves tended to be sticky, but changes in the market value of specific collateral, such as oil reserves, or the market capitalization of the company as a whole could drive actual debt ratios away from corresponding targets. Mortensen s team did not set targets-they were set in consultations among division and corporate executives and the board-but Mortensen did estimate a debt rating for each division based on its target, and a corresponding spread over treasury bonds to estimate divisional and corporate costs of debt.3 Mortensen s preliminary estimates for 2007 are shown below in Table 1. Table 1 Business Segment: Consolidated Exploration & Production Refining & Marketing Petrochemicals Credit Rating A+ Maturity: 1-Year A+ BBB AA- 10-Year 30-Year Debt/ Spread to Value Treasury 42.2% 1.62% Note: Debt/Value is based on market values. 46.0% 31.0% 40.0% At December 31, 2006, the company s debt was rated A+ by Standard & Poor s. Table 2 gives yields to maturity for U.S. Treasury bonds in January 2007. Table 2 1.60% 1.80% 1.35% Rate: 4.54% 4.66% 4.98% Finally, although prudent use of Midland s debt capacity was a primary determinant of capital structure, other considerations played important roles as well. In particular, the strength of Midland s consolidated balance sheet and its access to global financial and commodity markets sometimes presented attractive opportunities to trade securities and commodities. Midland was conservative compared to some of its large competitors, but it did have a group of traders in-house who actively managed currency, interest rate, and commodity risks within a set of guidelines approved by the board. The desire to manage certain risks, or to take advantage of private information or unusual pricing relationships, was an additional reason that the actual capital structure sometimes departed, temporarily, from planned targets. Stock Repurchases In the past, Midland had repurchased its own shares on occasion, and had stated that it would do so again whenever attractive opportunities arose. Consequently, the company regularly estimated the intrinsic value of its shares by subtracting the market value of its debt from the fundamental value of the enterprise and dividing the result by the number of shares outstanding. The fundamental value of the consolidated enterprise was estimated using DCF analyses and a comparison of the company s trading multiples with those of its peers. When the stock price fell below the stock s intrinsic value, Midland considered repurchasing its shares. Small numbers of shares could be purchased on the open market; larger blocks would be bought via self-tenders. Midland had not repurchased shares in large numbers since 2002 and no large purchases were anticipated by analysts in the near future, given the company s high stock price. Nevertheless, Midland executives pointed out that the mere fact that the stock price had risen did not mean the shares were not undervalued - intrinsic value had clearly risen as well, and Midland remained committed to repurchasing shares when they were undervalued. Exhibit 4 shows Midland s historical stock prices, dividends per share, and selected financial data for the period 2001-06. Estimating the Cost of Capital Mortensen s primary calculations were based on the formula for WACC shown below. In this expression, D and E are the market values of the debt and equity respectively, and V is the firm s or division s enterprise value (V = D + E). Similarly, r and r are the costs of debt and equity, respectively, and t is the tax rate. (2)α-1) + r WACC=ra Cost of Debt Mortensen computed the cost of debt for each division by adding a premium, or spread, over U.S. Treasury securities of a similar maturity. The spread depended on a variety of factors, including the division s cash flow from operations, the collateral value of the division s assets, and overall credit market conditions. For some of Midland s operations, long-term expected cash flow and collateral value were affected by political risk. This risk was most apparent, for example, in the exploration and production division. A significant fraction of E&P s productive assets and proven reserves were located in politically volatile countries in which the risk of nationalization or a forced renegotiation of production rights was significant. All else equal, such properties supported less borrowing than might otherwise be expected. Cost of Equity To estimate the cost of equity, Mortensen used the Capital Asset Pricing Model (CAPM), shown below, in which r, denotes the risk-free rate of return, ß is a measure of systematic risk, and EMRP denotes the equity market risk premium, that is, the amount by which the return on a broadly diversified portfolio of risky assets is expected to exceed the risk-free return over a specific holding period. r = r + B(EMRP) Mortensen was aware that betas were measured, with error, from regressions of individual stock returns on market returns. She and her team used betas published in commercially available databases, rather than running their own regressions. Midland s beta was 1.25, for example. However, betas for Midland s divisions were not observable, since the divisions did not have traded shares of stock. To estimate betas for the divisions, Mortensen relied on published betas for publicly traded companies she deemed comparable to each division s business. A selection of these, along with related financial data, is presented in Exhibit 5. In 2006 idland used an equity market risk premium of 5.0%, but higher EMRPs-6.0% to 6.5%- had been used by Midland at various times in the past. Historical data on stock returns and bond yields, such as those presented in Exhibit 6, supported the higher estimates of the EMRP. Other data, such as the survey results shown in Exhibit 6, suggested lower figures. Midland adopted its current estimate of 5.0% after a review of recent research and in consultation with its professional advisors- primarily its bankers and auditors—as well as Wall Street analysts covering the industry. Midland Income Statements, Years ended December 31 ($ in millions) Operating Results: Operating Revenues Plus: Other Income Total Revenue & Other Income Less: Crude Oil & Product Purchases Less: Production & Manufacturing Less: Selling, General & Administrative Less: Depreciation & Depletion Less: Exploration Expense Less: Sales-Based Taxes Less: Other Taxes & Duties Operating Income Less: Interest Expense Less: Other Non-Operating Expenses Income Before Taxes Less: Taxes Net Income 2004 2005 2006 $201,425 $249,246 $248,518 1,239 2,817 3,524 202,664 252,062 252,042 125,949 124,131 18,237 20,079 9,793 9,706 6,972 7,763 656 803 94,672 15,793 9,417 6,642 747 18,539 20,905 20,659 27,849 28,257 26,658 29,005 41,294 42,243 10,568 8,028 11,081 528 543 715 30,447 11,747 $18,701 17,910 32,723 7,414 12,830 $10,496 $19,893 Exhibit 2 Midland Balance Sheets, at December 31 ($ in millions) Assets: Cash & Cash equivalents Restricted Cash Notes Receivable Inventory Prepaid Expenses Total Current Assets Investments & Advances Net Property, Plant & Equipment Other Assets Total Assets Liabilities & Owners Equity: Accounts Payable & Accrued Liabilities Current Portion of Long-Term Debt Taxes Payable Total Current Liabilities Long-Term Debt Post Retirement Benefit Obligations Accrued Liabilities Deferred Taxes Other Long-Term Liabilities Total Shareholders Equity Total Liabilities & Owners Equity 2005 $16,707 3,131 18,689 6,338 2,218 47,083 30,140 34,205 156,630 167,350 10,818 9,294 244,671 262,378 2006 $19,206 3,131 19,681 7,286 2,226 51,528 24,562 26,576 26,534 20,767 5,723 5,462 56,819 52,805 82,414 6,950 4,375 14,197 2,423 77,493 $244,671 81,078 9,473 4,839 14,179 2,725 97,280 $262,378 Exhibit 3 Midland Segment Data ($ in millions) Exploration & Production: Operating Revenue After-Tax Earnings Capital Expenditures Depreciation Total Assets Refining & Marketing: Operating Revenue After-Tax Earnings Capital Expenditures Depreciation Total Assets Petrochemicals: Operating Revenue After-Tax Earnings Capital Expenditures Depreciation Total Assets 2004 $15,931 6,781 6,000 4,444 $76,866 2005 2006 $20,870 $22,357 13,349 12,556 2004 2005 2006 $166,280 $206,719 $202,971 2,320 4,382 4,047 2004 $19,215 1,394 7,180 7,940 4,790 5,525 $125,042 $140,100 1,455 1,550 1,620 1,591 $60,688 $91,629 305 578 $19,943 2005 $21,657 2,162 330 591 $28,000 1,683 1,596 $93,829 2006 $23,189 2,097 436 642 $28,450 Exhibit 4 Stock Prices, Dividends and Selected Financial Data Stock Prices: Fourth Quarter Third Quarter Second Quarter First Quarter Dividends Per Share: Fourth Quarter Third Quarter Second Quarter First Quarter Annual Dividend Selected Financial Data: Net income ($ in millions) Shares Outstanding EPS Payout Ratio DPS 2001 2002 2003 2004 $27.16 $31.29 $32.59 $34.37 $27.90 $30.41 $29.42 $35.78 $28.33 $27.80 $32.45 $36.98 $24.13 $26.85 $31.57 $31.28 $0.28 $0.28 $0.28 $0.28 $1.11 $0.29 $0.29 $0.29 $0.29 $1.14 $0.30 $0.29 $0.29 $0.29 $1.17 $0.31 $0.31 $0.31 $0.31 $1.24 2005 $38.32 $40.29 $37.52 $34.58 $0.34 $0.34 $0.34 $0.34 $1.35 2006 $44.11 $39.75 $46.32 $38.81 $0.36 $0.36 $0.36 $0.36 $1.46 $15,303 $11,448 $11,848 $10,496 $19,893 $18,701 2,049 2,025 2,035 2,055 2,945 2,951 7.47 5.65 5.82 5.11 6.75 6.34 14.8% 20.2% 19.9% 24.2% 20.0% 23.0% $1.11 $1.14 $1.16 $1.24 $1.35 $1.46 Exhibit 5 Comparable Company Information ($ in millions) Exploration & Production: Jackson Energy, Inc. Wide Plain Petroleum Corsicana Energy Corp. Worthington Petroleum Average Refining & Marketing: Bexar Energy, Inc. Kirk Corp. White Point Energy Petrarch Fuel Services Arkana Petroleum Corp. Beaumont Energy, Inc. Dameron Fuel Services Average Midland Energy Resources Equity Market Value Net Debt $57,931 $6,480 46,089 39,375 42,263 6,442 27,591 13,098 6,200 3,017 1,925 60,356 15,567 9,204 2,460 18,363 32,662 6,743 48,796 24,525 (296) 5,931 $134,114 $79,508 D/E 11.2% 85.4% 15.2% 47.5% 39.8% 10.3% 19.4% 20.9% -12.0% 32.3% 20.6% 50.3% 20.3% 59.3% Equity Beta LTM LTM Revenue Earnings 0.89 $18,512 $4,981 1.21 17,827 8,495 1.11 14,505 4,467 1.39 12,820 3,506 1.15 1.70 160,708 0.94 67,751 1.78 31,682 0.24 1.2 1.04 1.42 1.20 18,874 49,117 59,989 58,750 9,560 1,713 1,402 112 3,353 1,467 4,646 1.25 $251,003 $18,888 Exhibit 6 The Equity Market Risk Premium-Selected Data and Studies A. Selected historical data on U.S. stock returns minus Treasury bond yields Average excess return US Equities - T-Bonds 6.4% 4.8% 7.1% 6.8% 5.9% 5.1% Period 1987-2006 1967-2006 1926-2006 1900-2006 1872-2006 1798-2006 B. Selected market risk premium survey results Source: Pratt & Grabowski, Cost of Capital, Applications and Examples, John Wiley & Sons, 2008. Data are extracted from Exhibit 9.1, p. 95. Researcher Welchª Graham & Harvey Greenwich Associates Survey Subjects Dates 500+ finance & economics 2001 professors ~400 U. S. CFOs Standard error Quarterly 2000-2006 US pension fund managers 2006 3.7% 2.6% 2.2% 1.9% 1.6% 1.2% Respondents Risk Premia Median: 3.6% Interquartile range: 2.6%-5.6% Range: 2.5% - 4.7% Most recent survey (4Q2006): 3.3% Range: 2% -4%
Expert Answer:


Valuation The Art and Science of Corporate Investment Decisions
ISBN: 978-0133479522
3rd edition
Authors: Sheridan Titman, John D. Martin
Students also viewed these general management questions
-
List three specific parts of the Case Guide, Objectives and Strategy Section (See below) that you had the most difficulty understanding. Describe your current understanding of these parts. Provide...
-
As the result of stockholder pressure, RJR Nabisco is considering spinning off its food division. You have been asked to estimate the beta for the division and decide to do so by obtaining the beta...
-
Managing Scope Changes Case Study Scope changes on a project can occur regardless of how well the project is planned or executed. Scope changes can be the result of something that was omitted during...
-
The following sequences of bits (rightmost bit first) appear at the inputs of a 4-bit parallel adder. Determine the resulting sequence of bits on each output. A1 1 0 0 1 A2 1 1 1 0 A3 0 0 0 0 A4 1 0...
-
The balance sheet of Consolidated Paper, Inc., included the following shareholders' equity accounts at December 31, 2010: During 2011, several events and transactions affected the retained earnings...
-
Crockett Corporation, a calendar year C corporation, reports net income of $2,000,000,000 on its 2023 audited financial statements (including financial statement depreciation of $250,000,000). Also,...
-
The following information was taken from the records of Underwood Company at June 30, 2007: Requirement Prepare a multistep income statement for Underwood Company for the fiscal year ended June 30,...
-
A random sample of 20 independent female college-aged dancers was obtained, and their heights (in inches) were measured. Assume the population distribution is Normal. a. What is the sample mean? Is...
-
Charlie Lee has invested in stock of Izepodd Enterprise, a company that\'s been in business for about three years but has such a strong product line they expect to continue to offer their products...
-
Bavarian Motor Company (BMC) manufacturers cars and SUVs in Europe and ships them to distributors in the U.S. Presently, BMC has an inventory of 200 cars and 140 SUVs in Newark, NJ and 300 cars and...
-
Alden Company's monthly data for the past year follow. Management wants to use these data to predict future variable and fixed costs. Honth Units Sold 315, 000 160,000 260,000 200,000 Total Cost $...
-
Question 1: List six (6) sources of external information to determine OHS requirements, policies and procedures. Question 2: Mention the eight (8) key sources of information for hazard...
-
... Project should be completed using Matlab software a) Find the Fourier Series expansion for the signals x(t) given in Figure 1, theoretically. b) Transfer the resulting Fourier Series in (a) into...
-
Diego Company manufactures one product that is sold for $71 per unit in two geographic regions-the East and West regions. The following information pertains to the company's first year of operations...
-
On March 31, 2024, Susquehanna Insurance purchased an office building for $13,200,000. Based on their relative fair values, one-third of the purchase price was allocated to the land and two-thirds to...
-
Consider the following two assets: J+D Chili stock, with expected return 6% and standard deviation 42% Maryanne's Hammocks stock, with expected return 2% and standard deviation 17%. The correlation...
-
5 . 7 4 % 2 0 2 6 GOI security is trading at 6 . 9 6 YTM . If the security experiences a 1 0 0 basis points hike. Calculate PV 0 1 for 6 9 such securities . NOTE: Assume the face value of the...
-
Refer to the situation described inBE 18-13, but assume a 2-for-1 stock split instead of the 5% stock dividend. Prepare the journal entry to record the stock split if it is to be effected in the form...
-
International Tile Importers Inc. is a rapidly growing firm that imports and markets floor tiles from around the world. The tiles are used in the construction of custom homes and commercial...
-
Highland Properties owns two adjacent four-unit apartment buildings that are both on 20,000 square feet of land near downtown Portland, Oregon. One of the properties is in very good condition, and...
-
In 2014, worldwide capacity of wind-powered generators was growing. Wind power still constitutes a small fraction of worldwide electricity use, but in Denmark, wind power provides over 20% of...
-
A steel cylinder containing air has a closely fitted piston and a set of stops as shown in Fig. 3.7. The piston is loaded with certain weights. The air inside the cylinder is initially at...
-
What is the difference between compressed liquid and saturated liquid?
-
Explain the significance of critical point and triple point.

Study smarter with the SolutionInn App