Changes in the consumer's opportunities lead to changes in the optimal consump- tion basket. Changes in...
Fantastic news! We've Found the answer you've been seeking!
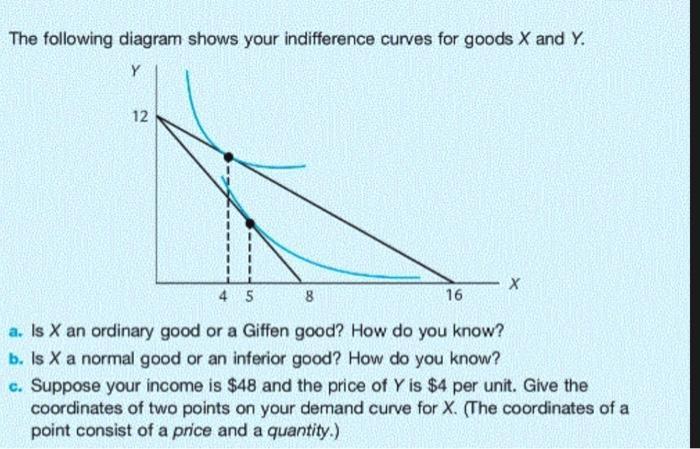
Question:
Transcribed Image Text:
Changes in the consumer's opportunities lead to changes in the optimal consump- tion basket. Changes in opportunities arise from changes in income and changes in prices. A change in income causes a parallel shift in the budget line. When income rises, consumption of the good X can either rise (in which case X is called a normal good) or fall (in which case X is called an inferior good). If we fix the prices of goods X and Y, we can draw budget lines corresponding to various levels of income. If we also know the consumer's indifference curves, we can find the optimal basket corresponding to each level of income and read off the quan- tity of X associated with each level of income. We can plot this information on a graph, with income on the horizontal axis and quantity of X on the vertical. The resulting curve is called an Engel curve. The Engel curve slopes upward for a normal good and downward for an inferior good. A change in the price of X causes the budget line to pivot around its Y-intercept-outward for a fall in price and inward for a rise in price. A rise in price can cause the quantity of X demanded to fall (in which case X is called an ordinary good) or rise (in which case X is called a Giffen good). If we fix the price of Y and the consumer's income, we can draw budget lines cor- responding to various prices of X. If we also know the consumer's indifference curves, we can find the optimal basket associated with each price of X and read off the quantity of X associated with each price. We can plot this information on a graph, with price on the vertical axis and quantity on the horizontal. The resulting curve is the demand curve for X. The demand curve slopes downward if X is not Giffen and upward if X is Giffen. When the price of X goes up, the consumer changes his consumption of X for two reasons. First, there is the substitution effect: Consumers will not purchase goods whose marginal value is below the price. Second, there is the income effect: Consumers are made effectively poorer when a price goes up. The substitution effect always reduces consumption of X. The income effect reduces consumption of X if X is a normal good, but increases consumption of X if X is an inferior good. For a normal good, the substitution and income effects work in the same direc- tion, ensuring that when the price goes up the quantity demanded goes down. Thus, a normal good cannot be Giffen. For an inferior good, the substitution and income effects work in opposite directions: If the substitution effect is greater, the good is not Giffen, but if the income effect is greater, the good is Giffen. The compensated demand curve shows, for each price, the quantity of X the consumer would demand if he were income-compensated for every price change. Thus, the compensated demand curve shows only the substitution effect and so must slope downward. Changes in the consumer's opportunities lead to changes in the optimal consump- tion basket. Changes in opportunities arise from changes in income and changes in prices. A change in income causes a parallel shift in the budget line. When income rises, consumption of the good X can either rise (in which case X is called a normal good) or fall (in which case X is called an inferior good). If we fix the prices of goods X and Y, we can draw budget lines corresponding to various levels of income. If we also know the consumer's indifference curves, we can find the optimal basket corresponding to each level of income and read off the quan- tity of X associated with each level of income. We can plot this information on a graph, with income on the horizontal axis and quantity of X on the vertical. The resulting curve is called an Engel curve. The Engel curve slopes upward for a normal good and downward for an inferior good. A change in the price of X causes the budget line to pivot around its Y-intercept-outward for a fall in price and inward for a rise in price. A rise in price can cause the quantity of X demanded to fall (in which case X is called an ordinary good) or rise (in which case X is called a Giffen good). If we fix the price of Y and the consumer's income, we can draw budget lines cor- responding to various prices of X. If we also know the consumer's indifference curves, we can find the optimal basket associated with each price of X and read off the quantity of X associated with each price. We can plot this information on a graph, with price on the vertical axis and quantity on the horizontal. The resulting curve is the demand curve for X. The demand curve slopes downward if X is not Giffen and upward if X is Giffen. When the price of X goes up, the consumer changes his consumption of X for two reasons. First, there is the substitution effect: Consumers will not purchase goods whose marginal value is below the price. Second, there is the income effect: Consumers are made effectively poorer when a price goes up. The substitution effect always reduces consumption of X. The income effect reduces consumption of X if X is a normal good, but increases consumption of X if X is an inferior good. For a normal good, the substitution and income effects work in the same direc- tion, ensuring that when the price goes up the quantity demanded goes down. Thus, a normal good cannot be Giffen. For an inferior good, the substitution and income effects work in opposite directions: If the substitution effect is greater, the good is not Giffen, but if the income effect is greater, the good is Giffen. The compensated demand curve shows, for each price, the quantity of X the consumer would demand if he were income-compensated for every price change. Thus, the compensated demand curve shows only the substitution effect and so must slope downward.
Expert Answer:
Answer rating: 100% (QA)
ANSWER a To determine whether X is an ordinary good or a Giffen good we need to examine how the dema... View the full answer
Related Book For
Macroeconomics Principles, Applications, and Tools
ISBN: 978-0132555234
7th Edition
Authors: Arthur O Sullivan, Steven M. Sheffrin, Stephen J. Perez
Posted Date:
Students also viewed these economics questions
-
In our development of consumer theory, we made a big point about the fact that neoclassical economics does not put much stock in the idea of cardinally measuring utility (in terms of units of...
-
Planning is one of the most important management functions in any business. A front office managers first step in planning should involve determine the departments goals. Planning also includes...
-
The Crazy Eddie fraud may appear smaller and gentler than the massive billion-dollar frauds exposed in recent times, such as Bernie Madoffs Ponzi scheme, frauds in the subprime mortgage market, the...
-
Do you agree or not? Specialization of labor and better use of capital goods can initially generate increasing marginal output (returns) for a firm in the production of a good.
-
Let P (t) be the performance level of someone learning a skill as a function of the training time t. The graph of P is called a learning curve. In Exercise 13 in Section 9.1 we proposed the...
-
The systems shown in Figure P5.21 are in equilibrium. If the spring scales are calibrated in newtons, what do they read? (Neglect the masses of the pulleys and strings, and assume the incline in part...
-
If a company had two units that cost \($1\) each in its beginning inventory and purchased two more units for \($2\) each, what would be the gross profit reported on the income statement under each of...
-
Determine the covariance and correlation for the following joint probability distribution: x 1 0.5 0.5 1 y 2 1 1 2 fXY (x, y) 1/8 1/8
-
Paediatric Orthopaedic Clinic at the Children's Hospital of Western Ontario The chief of pediatric orthopedic surgery was very concerned by long times that young patients (and their parents) were...
-
The first quarter tax return needs to be filed for Prevosti Farms and Sugarhouse by April 15, 2019. For the purpose of the taxes, assume the second February payroll amounts were duplicated for the...
-
Write a C++ program to show a randomized 30 results with the following characteristics: 25% show "Heads" 65% Show "Tails" 10% Show "No clear results" Attach your output. //Ex2 solution #include using...
-
ITEM Cost per Unit Classification Fabric $ 0 . 8 0 Product Interfacing $ 0 . 8 0 Product Hardware $ 0 . 8 0 Product Sewing Machine Monthly Cost Period Thread Monthly Cost Period Pliers One - time...
-
Use the following information for Cookies, Inc. to prepare an Income Statement, Statement of Changes in Stockholders' Equity and Balance Sheet at the end of the current year on this form. Common...
-
Fanshawe college Course Code : MGMT 6147 : Trends in Management & Leadership Module & Case: #10: Motivated reasoning, leadership, and team performance. 1) Please provide a brief summary of the case....
-
What are the six C's of the practice of Supervision Modelling?
-
Define an empty list named values (please note that in rest of the questions if you see this name of list then it means this same list created here). Run your cell so that this list gets defined by...
-
Q1 Auditing in the environment of computerized information systems requires the availability of many competencies in the auditors. Discuss this statement, explaining those competencies and their...
-
Copy and complete the statement. 3800 m ? km =
-
It is widely acknowledged that mobile phones promote economic development in less developed countries. In areas with unreliable transport and postal systems, mobile services can lead to substantial...
-
When the euro was launched, countries with typically weaker currencies or fiscal discipline benefited from the discipline of one currency and a strong, single central bank. No longer would investors...
-
1. Arrow up or down: When a gasoline tax is offset by an income-tax cut that makes a consumer s original choice just affordable, gasoline consumption will _____because the tax _____the bang per buck...
-
The heat of vaporization of ether is \(25.98 \mathrm{~kJ} / \mathrm{mol}\) at its boiling point, \(34.5^{\circ} \mathrm{C}\). (a) Calculate the rate of change of vapour pressure with temperature...
-
Show that the internal energy of an ideal gas is a function only of temperature.
-
For a gas obeying the equation of state \(V=B+\frac{R T}{P}\), the Joule-Thomson coefficient is given by \[ \mu_{\mathrm{JT}}=-\frac{1}{C_{P}}\left(T \frac{d B}{d T}-B ight) \]
Study smarter with the SolutionInn App