

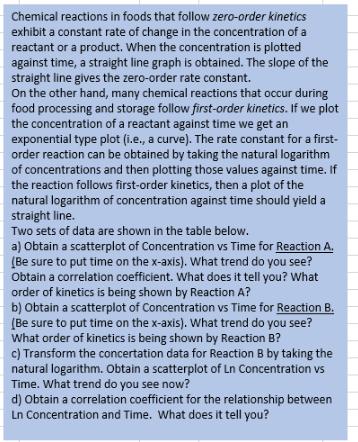
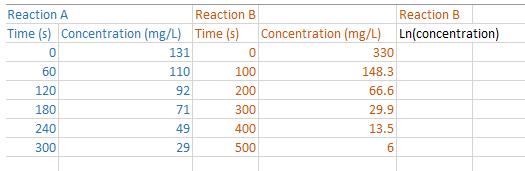
Chemical reactions in foods that follow zero-order kinetics exhibit a constant rate of change in the...
Fantastic news! We've Found the answer you've been seeking!
Expert Answer:
A Obtain a scatterplot of Concentration vs Time for Reaction A Be sure to put time on the xaxis What trend do you see Obtain a correlation coefficient ... View the full answer

Related Book For 
Posted Date:
