

Create a vertical (same-size) & horizontal analysis (change in dollars and percent of change) for Coca-Cola...
Fantastic news! We've Found the answer you've been seeking!
Question:
Transcribed Image Text:
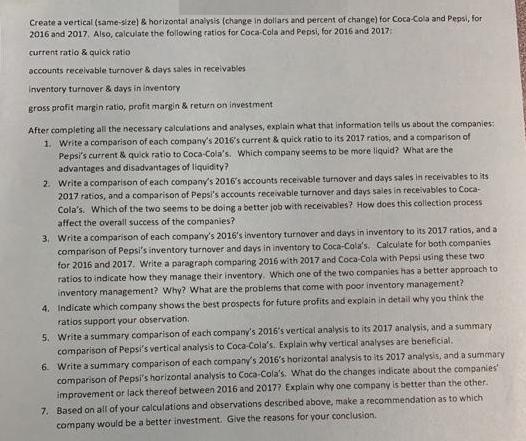
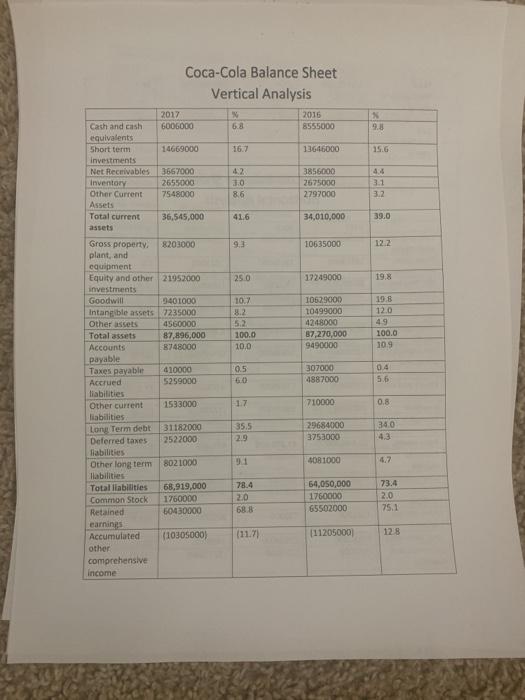
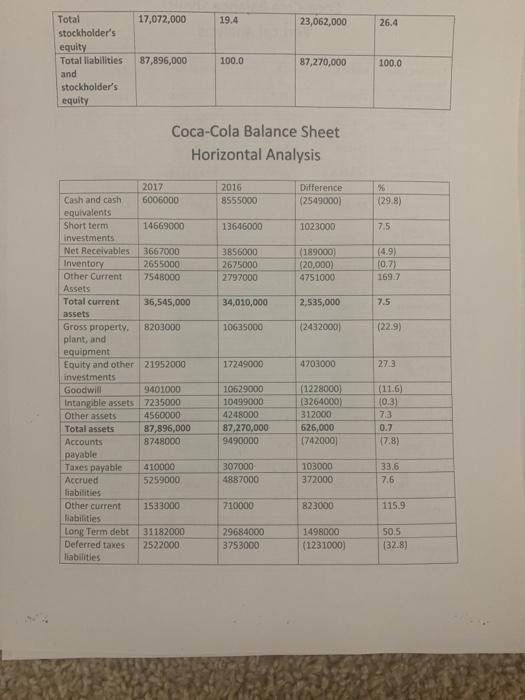
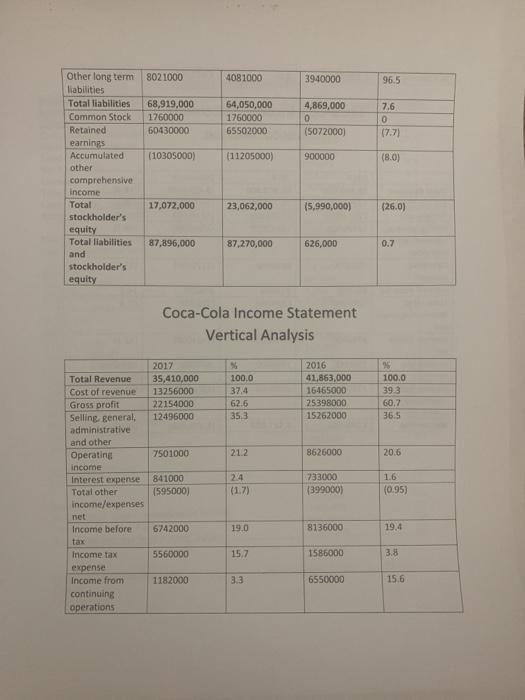
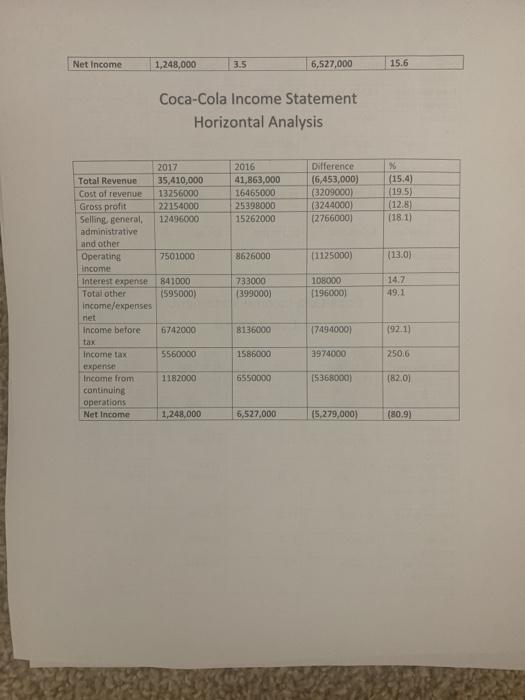
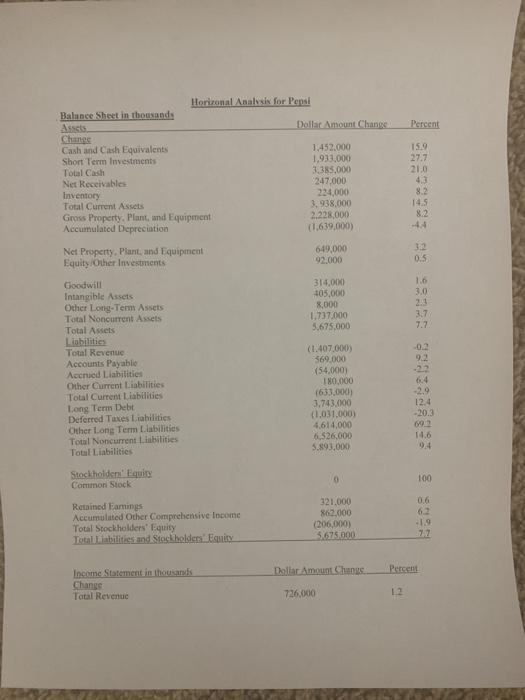
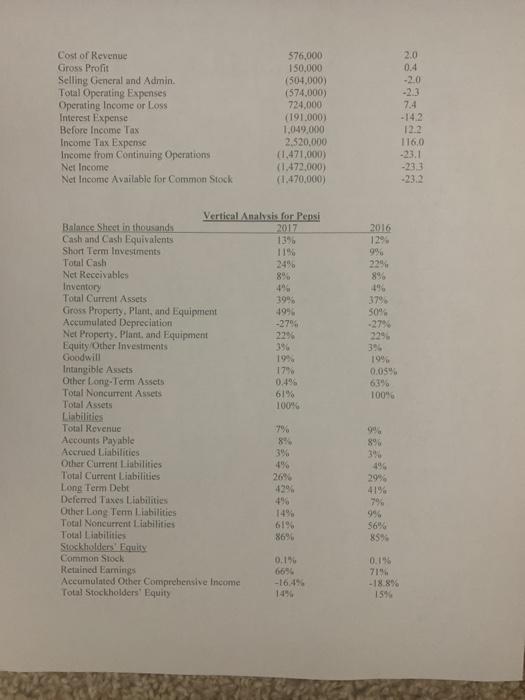
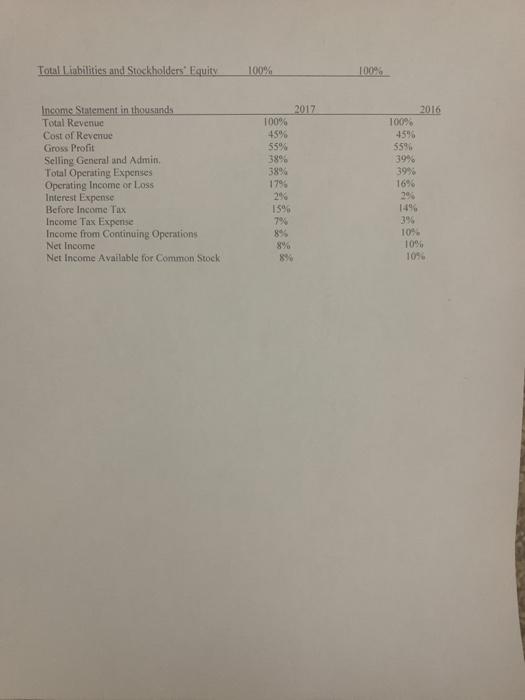
Create a vertical (same-size) & horizontal analysis (change in dollars and percent of change) for Coca-Cola and Pepsi, for 2016 and 2017. Also, calculate the following ratios for Coca-Cola and Pepsi, for 2016 and 2017: current ratio & quick ratio accounts receivable turnover & days sales in receivables Inventory turnover & days in inventory gross profit margin ratio, profit margin & return on investment After completing all the necessary calculations and analyses, explain what that information tells us about the companies: 1. Write a comparison of each company's 2016's current & quick ratio to its 2017 ratios, and a comparison of Pepsi's current & quick ratio to Coca-Cola's. Which company seems to be more liquid? What are the advantages and disadvantages of liquidity? 2. Write a comparison of each company's 2016's accounts receivable turnover and days sales in receivables to its 2017 ratios, and a comparison of Pepsi's accounts receivable turnover and days sales in receivables to Coca- Cola's. Which of the two seems to be doing a better job with receivables? How does this collection process affect the overall success of the companies? 3. Write a comparison of each company's 2016's inventory turnover and days in inventory to its 2017 ratios, and a comparison of Pepsi's inventory turnover and days in inventory to Coca-Cola's. Calculate for both companies for 2016 and 2017. Write a paragraph comparing 2016 with 2017 and Coca-Cola with Pepsi using these two ratios to indicate how they manage their inventory. Which one of the two companies has a better approach to inventory management? Why? What are the problems that come with poor inventory management? 4. Indicate which company shows the best prospects for future profits and explain in detail why you think the ratios support your observation. 5. Write a summary comparison of each company's 2016's vertical analysis to its 2017 analysis, and a summary comparison of Pepsi's vertical analysis to Coca-Cola's. Explain why vertical analyses are beneficial. 6. Write a summary comparison of each company's 2016's horizontal analysis to its 2017 analysis, and a summary comparison of Pepsi's horizontal analysis to Coca-Cola's. What do the changes indicate about the companies improvement or lack thereof between 2016 and 20177 Explain why one company is better than the other. 7. Based on all of your calculations and observations described above, make a recommendation as to which company would be a better investment. Give the reasons for your conclusion. Coca-Cola Balance Sheet Vertical Analysis 2017 2016 Cash and cash 6006000 6.8 8555000 9.8 equivalents Short term 14669000 16.7 13646000 15.6 investments Net Receivables Inventory Other Current Assets Total current 3667000 4.2 3856000 4.4 2655000 3.0 2675000 3.1 7548000 8.6 2797000 3.2 36,545,000 41.6 34,010,000 39.0 assets Gross property, plant, and 8203000 9.3 10635000 12.2 equipment Equity and other 21952000 investments 25.0 17249000 19.8 Goodwill 9401000 10.7 10629000 19.8 Intangible assets 7235000 Other assets Total assets Accounts 8.2 10499000 12.0 4560000 52 4248000 49 100.0 87,896.000 8748000 100.0 87,270,000 10.0 9490000 10.9 payable Taxes payable 307000 4887000 0.4 5.6 410000 0.5 Accrued 5259000 6.0 liabilities Other current liabilities 1533000 17 710000 0.8 29684000 34.0 Long Term debt Deferred taxes 31182000 2522000 35.5 2.9 53000 :4.3 liabilities 4081000 4.7 Other long term llabilities 8021000 73.4 64,050,000 1760000 65502000 68,919,000 78.4 Total liabilities Common Stock 1760000 20 2.0 75.1 Retained 60430000 68.8 earnings Accumulated (11.7) (11205000) 12.8 (1030s000) other comprehensive Income Total 17,072,000 19.4 23,062,000 26.4 stockholder's equity Total liabilities 87,896,000 100.0 87,270,000 100.0 and stockholder's equity Coca-Cola Balance Sheet Horizontal Analysis 2017 6006000 2016 Difference Cash and cash 8555000 (2549000) (29.8) equivalents Short term 14669000 13646000 1023000 7.5 investments Net Receivables 3667000 3856000 (189000) (20,000) 4751000 (4.9) (0.7) 169.7 2655000 Inventory Other Current 2675000 7548000 2797000 Assets Total current 36,545,000 34,010,000 2,535,000 7.5 assets Gross property. 8203000 10635000 (2432000) (22.9) plant, and equipment Equity and other 21952000 investments Goodwill 17249000 4703000 27.3 (1228000) (3264000) (11.6) 10.3) 9401000 10629000 Intangible assets 7235000 Other assets 10499000 4560000 4248000 87,270,000 9490000 312000 7.3 Total assets 87,896,000 626,000 0.7 Accounts 8748000 (742000) (7.8) payable Taxes payable 103000 410000 5259000 307000 4887000 33.6 Accrued 372000 7.6 liabilities Other current 1533000 710000 823000 115.9 iabilities Long Term debt Deferred taxes liabilities 31182000 2522000 29684000 1498000 50.5 3753000 (1231000) (32.8) Other long term liabilities 8021000 4081000 3940000 96.5 Total liabilities 68,919,000 64,050,000 4,869,000 7.6 Common Stock 1760000 1760000 Retained 60430000 65502000 (5072000) (7.7) earnings Accumulated (10305000) (11205000) 900000 (8.0) other comprehensive income Total 17,072,000 23,062,000 (5,990,000) (26.0) stockholder's equity Total liabilities 87,896,000 87,270,000 626,000 0.7 and stockholder's equity Coca-Cola Income Statement Vertical Analysis 2017 2016 35,410,000 13256000 100.0 41.863,000 16465000 25398000 100.0 Total Revenue Cost of revenue 37.4 39.3 Gross profit 22154000 62.6 60,7 Selling. general, administrative 12496000 35.3 15262000 36.5 and other 7501000 21.2 8626000 20.6 Operating incorne Interest expense Total other income/expenses 733000 (399000) 841000 2.4 1.6 (595000) (1.7) (0.95) net Income before 6742000 19.0 8136000 19.4 tax Income tax 5560000 15,7 1586000 3.8 еxpense Income from 1182000 3.3 6550000 15.6 continuing operations Net Income 1,248,000 3.5 6,527,000 15.6 Coca-Cola Income Statement Horizontal Analysis. 2017 2016 Dilference (6,453,000) (3209000) (3244000) (2766000) (15.4) (19.5) (12.8) (18.1) Total Revenue 35,410,000 13256000 41,863,000 16465000 Cost of revenue Gross profit Selling, general, administrative 22154000 25398000 12496000 15262000 and other Operating 7501000 8626000 (1125000) (13.0) income 14.7 Interest expense 841000 Total other income/expenses 733000 108000 (595000) (399000) (196000) 49.1 net Income before 6742000 8136000 (7494000) (92.1) tax Income tax 5560000 1586000 3974000 250.6 expense Income from continuing 1182000 6550000 (5368000) (82.0) operations Net Income 1,248,000 6,527,000 (5,279,000) (80.9) Horizonal Analvsis for Pepsi Balance Sheet in thousands Asssts Change Cash and Cash Equivalents Short Term Investments Total Cash Net Receivables Dollar Amount Change Percent 1,452.000 1,933,000 3,385,000 247,000 224,000 3, 938,000 2,228,000 (1.639,000) 15.9 27.7 21.0 4.3 8.2 Inventory Total Curent Assets 14.5 8.2 Gross Property. Plant, and Equipment Accumulated Depreciation 4.4 Net Property, Plant, and Equipment Equity/Other Investments 649,000 92.000 3.2 0.5 1.6 314,000 405,000 8,000 1,737,000 5,675,000 Goodwill 3.0 Intangible Assets Other Long-Tem Assets Total Noncurrent Assets 23 3.7 7.7 Total Assets Liabilities Total Revenue (1.407,000) 369.000 (54,000) 180,000 (633,000) 3,743,000 (1,031.000) 4.614,000 6,526,000 5.893,000 -0.2 9.2 Accounts Payable Accrued Liabilities Other Current Liabilities Total Current Liabilities Long Term Debt Deferred Taxes Liabilities Other Long Tem Liabilities Total Noncurrent Liabilities Total Liabilities -22 6.4 -2.9 12.4 -20.3 692 14.6 9.4 Stockholder Equity Common Stock 100 0.6 62 Retained Eamings Accumulated Other Comprehensive Income Total Stockholders' Equity Total Liabilities and Stackholders Equity 321,000 862,000 (206,000) 5.675.000 1.9 77 Dolar Amount Changs Percent Income Statement in thousands Change Total Revenue 726,000 12 Cost of Revenue Gross Profit 576,000 150,000 (504.000) 2.0 0.4 -2.0 Selling General and Admin. Total Operating Expenses Operating Income or Loss Interest Expense Before Income Tax -2.3 (574,000) 724,000 (191.000) 1,049,000 2,520,000 (1,471,000) (1.472,000) (1,470,000) 7.4 -14,2 12.2 Income Tax Expense Income from Continuing Operations Net Income Net Income Available for Common Stock 116,0 -23.1 -23.3 -23.2 Vertical Analysis for Pepsi 2017 13% 11% 24% 8% 4% 39% 49% -27% Balance Sheet in thousands Cash and Cash Equivalents Short Term Investments Total Cash 2016 12% 9% 22% 8% 4% 37% 50% -27% Net Receivables Inventory Total Current Assets Gross Property, Plant, and Equipment Accumulated Depreciation Net Property. Plant, and Equipment Equity Other Investments Goodwill Intangible Assets Other Long-Term Assets Total Noncurrent Assets Total Assets Liabilities Total Revenue Accounts Payable Accrued Liabilities Other Current Liabilities Total Current Liabilities Long Term Debt Deferred Taxes Liabilities Other Long Tenm Liabilities Total Noncurrent Liabilities Total Liabilities Stockholders Equity Common Stock Retained Earnings Accumulated Other Comprebensive Income Total Stockholders' Equity 22% 22% 3% 19% 17% 0.4% 61% 19% 0.05% 63% 100% 100% 7% 8% 3% 4% 26% 42% 4% 14% 61% 86% 3% 4% 29% 41% 7% 9% $6% 85% 0.1% 66% 0.1% 71% -16.4% -18.8% 14% 15% Total Liabilities and Stockholders' Equity 100% 100% ETT Income Statement in thousands Total Revenue Cost of Revenue Gross Profit Selling General and Admin. Total Operating Expenses Operating Income or Loss Interest Expense Before Income Tax Income Tax Expense Income from Continuing Operations 2017 100% 45% 55% 2016 100% 45% 55% 38% 38% 17% 2% 39% 39% 16% 2% 14% 3% 10% 10% 10% 15% 7% 8% Net Income Net Income Available for Common Stock 8% 8% Create a vertical (same-size) & horizontal analysis (change in dollars and percent of change) for Coca-Cola and Pepsi, for 2016 and 2017. Also, calculate the following ratios for Coca-Cola and Pepsi, for 2016 and 2017: current ratio & quick ratio accounts receivable turnover & days sales in receivables Inventory turnover & days in inventory gross profit margin ratio, profit margin & return on investment After completing all the necessary calculations and analyses, explain what that information tells us about the companies: 1. Write a comparison of each company's 2016's current & quick ratio to its 2017 ratios, and a comparison of Pepsi's current & quick ratio to Coca-Cola's. Which company seems to be more liquid? What are the advantages and disadvantages of liquidity? 2. Write a comparison of each company's 2016's accounts receivable turnover and days sales in receivables to its 2017 ratios, and a comparison of Pepsi's accounts receivable turnover and days sales in receivables to Coca- Cola's. Which of the two seems to be doing a better job with receivables? How does this collection process affect the overall success of the companies? 3. Write a comparison of each company's 2016's inventory turnover and days in inventory to its 2017 ratios, and a comparison of Pepsi's inventory turnover and days in inventory to Coca-Cola's. Calculate for both companies for 2016 and 2017. Write a paragraph comparing 2016 with 2017 and Coca-Cola with Pepsi using these two ratios to indicate how they manage their inventory. Which one of the two companies has a better approach to inventory management? Why? What are the problems that come with poor inventory management? 4. Indicate which company shows the best prospects for future profits and explain in detail why you think the ratios support your observation. 5. Write a summary comparison of each company's 2016's vertical analysis to its 2017 analysis, and a summary comparison of Pepsi's vertical analysis to Coca-Cola's. Explain why vertical analyses are beneficial. 6. Write a summary comparison of each company's 2016's horizontal analysis to its 2017 analysis, and a summary comparison of Pepsi's horizontal analysis to Coca-Cola's. What do the changes indicate about the companies improvement or lack thereof between 2016 and 20177 Explain why one company is better than the other. 7. Based on all of your calculations and observations described above, make a recommendation as to which company would be a better investment. Give the reasons for your conclusion. Coca-Cola Balance Sheet Vertical Analysis 2017 2016 Cash and cash 6006000 6.8 8555000 9.8 equivalents Short term 14669000 16.7 13646000 15.6 investments Net Receivables Inventory Other Current Assets Total current 3667000 4.2 3856000 4.4 2655000 3.0 2675000 3.1 7548000 8.6 2797000 3.2 36,545,000 41.6 34,010,000 39.0 assets Gross property, plant, and 8203000 9.3 10635000 12.2 equipment Equity and other 21952000 investments 25.0 17249000 19.8 Goodwill 9401000 10.7 10629000 19.8 Intangible assets 7235000 Other assets Total assets Accounts 8.2 10499000 12.0 4560000 52 4248000 49 100.0 87,896.000 8748000 100.0 87,270,000 10.0 9490000 10.9 payable Taxes payable 307000 4887000 0.4 5.6 410000 0.5 Accrued 5259000 6.0 liabilities Other current liabilities 1533000 17 710000 0.8 29684000 34.0 Long Term debt Deferred taxes 31182000 2522000 35.5 2.9 53000 :4.3 liabilities 4081000 4.7 Other long term llabilities 8021000 73.4 64,050,000 1760000 65502000 68,919,000 78.4 Total liabilities Common Stock 1760000 20 2.0 75.1 Retained 60430000 68.8 earnings Accumulated (11.7) (11205000) 12.8 (1030s000) other comprehensive Income Total 17,072,000 19.4 23,062,000 26.4 stockholder's equity Total liabilities 87,896,000 100.0 87,270,000 100.0 and stockholder's equity Coca-Cola Balance Sheet Horizontal Analysis 2017 6006000 2016 Difference Cash and cash 8555000 (2549000) (29.8) equivalents Short term 14669000 13646000 1023000 7.5 investments Net Receivables 3667000 3856000 (189000) (20,000) 4751000 (4.9) (0.7) 169.7 2655000 Inventory Other Current 2675000 7548000 2797000 Assets Total current 36,545,000 34,010,000 2,535,000 7.5 assets Gross property. 8203000 10635000 (2432000) (22.9) plant, and equipment Equity and other 21952000 investments Goodwill 17249000 4703000 27.3 (1228000) (3264000) (11.6) 10.3) 9401000 10629000 Intangible assets 7235000 Other assets 10499000 4560000 4248000 87,270,000 9490000 312000 7.3 Total assets 87,896,000 626,000 0.7 Accounts 8748000 (742000) (7.8) payable Taxes payable 103000 410000 5259000 307000 4887000 33.6 Accrued 372000 7.6 liabilities Other current 1533000 710000 823000 115.9 iabilities Long Term debt Deferred taxes liabilities 31182000 2522000 29684000 1498000 50.5 3753000 (1231000) (32.8) Other long term liabilities 8021000 4081000 3940000 96.5 Total liabilities 68,919,000 64,050,000 4,869,000 7.6 Common Stock 1760000 1760000 Retained 60430000 65502000 (5072000) (7.7) earnings Accumulated (10305000) (11205000) 900000 (8.0) other comprehensive income Total 17,072,000 23,062,000 (5,990,000) (26.0) stockholder's equity Total liabilities 87,896,000 87,270,000 626,000 0.7 and stockholder's equity Coca-Cola Income Statement Vertical Analysis 2017 2016 35,410,000 13256000 100.0 41.863,000 16465000 25398000 100.0 Total Revenue Cost of revenue 37.4 39.3 Gross profit 22154000 62.6 60,7 Selling. general, administrative 12496000 35.3 15262000 36.5 and other 7501000 21.2 8626000 20.6 Operating incorne Interest expense Total other income/expenses 733000 (399000) 841000 2.4 1.6 (595000) (1.7) (0.95) net Income before 6742000 19.0 8136000 19.4 tax Income tax 5560000 15,7 1586000 3.8 еxpense Income from 1182000 3.3 6550000 15.6 continuing operations Net Income 1,248,000 3.5 6,527,000 15.6 Coca-Cola Income Statement Horizontal Analysis. 2017 2016 Dilference (6,453,000) (3209000) (3244000) (2766000) (15.4) (19.5) (12.8) (18.1) Total Revenue 35,410,000 13256000 41,863,000 16465000 Cost of revenue Gross profit Selling, general, administrative 22154000 25398000 12496000 15262000 and other Operating 7501000 8626000 (1125000) (13.0) income 14.7 Interest expense 841000 Total other income/expenses 733000 108000 (595000) (399000) (196000) 49.1 net Income before 6742000 8136000 (7494000) (92.1) tax Income tax 5560000 1586000 3974000 250.6 expense Income from continuing 1182000 6550000 (5368000) (82.0) operations Net Income 1,248,000 6,527,000 (5,279,000) (80.9) Horizonal Analvsis for Pepsi Balance Sheet in thousands Asssts Change Cash and Cash Equivalents Short Term Investments Total Cash Net Receivables Dollar Amount Change Percent 1,452.000 1,933,000 3,385,000 247,000 224,000 3, 938,000 2,228,000 (1.639,000) 15.9 27.7 21.0 4.3 8.2 Inventory Total Curent Assets 14.5 8.2 Gross Property. Plant, and Equipment Accumulated Depreciation 4.4 Net Property, Plant, and Equipment Equity/Other Investments 649,000 92.000 3.2 0.5 1.6 314,000 405,000 8,000 1,737,000 5,675,000 Goodwill 3.0 Intangible Assets Other Long-Tem Assets Total Noncurrent Assets 23 3.7 7.7 Total Assets Liabilities Total Revenue (1.407,000) 369.000 (54,000) 180,000 (633,000) 3,743,000 (1,031.000) 4.614,000 6,526,000 5.893,000 -0.2 9.2 Accounts Payable Accrued Liabilities Other Current Liabilities Total Current Liabilities Long Term Debt Deferred Taxes Liabilities Other Long Tem Liabilities Total Noncurrent Liabilities Total Liabilities -22 6.4 -2.9 12.4 -20.3 692 14.6 9.4 Stockholder Equity Common Stock 100 0.6 62 Retained Eamings Accumulated Other Comprehensive Income Total Stockholders' Equity Total Liabilities and Stackholders Equity 321,000 862,000 (206,000) 5.675.000 1.9 77 Dolar Amount Changs Percent Income Statement in thousands Change Total Revenue 726,000 12 Cost of Revenue Gross Profit 576,000 150,000 (504.000) 2.0 0.4 -2.0 Selling General and Admin. Total Operating Expenses Operating Income or Loss Interest Expense Before Income Tax -2.3 (574,000) 724,000 (191.000) 1,049,000 2,520,000 (1,471,000) (1.472,000) (1,470,000) 7.4 -14,2 12.2 Income Tax Expense Income from Continuing Operations Net Income Net Income Available for Common Stock 116,0 -23.1 -23.3 -23.2 Vertical Analysis for Pepsi 2017 13% 11% 24% 8% 4% 39% 49% -27% Balance Sheet in thousands Cash and Cash Equivalents Short Term Investments Total Cash 2016 12% 9% 22% 8% 4% 37% 50% -27% Net Receivables Inventory Total Current Assets Gross Property, Plant, and Equipment Accumulated Depreciation Net Property. Plant, and Equipment Equity Other Investments Goodwill Intangible Assets Other Long-Term Assets Total Noncurrent Assets Total Assets Liabilities Total Revenue Accounts Payable Accrued Liabilities Other Current Liabilities Total Current Liabilities Long Term Debt Deferred Taxes Liabilities Other Long Tenm Liabilities Total Noncurrent Liabilities Total Liabilities Stockholders Equity Common Stock Retained Earnings Accumulated Other Comprebensive Income Total Stockholders' Equity 22% 22% 3% 19% 17% 0.4% 61% 19% 0.05% 63% 100% 100% 7% 8% 3% 4% 26% 42% 4% 14% 61% 86% 3% 4% 29% 41% 7% 9% $6% 85% 0.1% 66% 0.1% 71% -16.4% -18.8% 14% 15% Total Liabilities and Stockholders' Equity 100% 100% ETT Income Statement in thousands Total Revenue Cost of Revenue Gross Profit Selling General and Admin. Total Operating Expenses Operating Income or Loss Interest Expense Before Income Tax Income Tax Expense Income from Continuing Operations 2017 100% 45% 55% 2016 100% 45% 55% 38% 38% 17% 2% 39% 39% 16% 2% 14% 3% 10% 10% 10% 15% 7% 8% Net Income Net Income Available for Common Stock 8% 8% Create a vertical (same-size) & horizontal analysis (change in dollars and percent of change) for Coca-Cola and Pepsi, for 2016 and 2017. Also, calculate the following ratios for Coca-Cola and Pepsi, for 2016 and 2017: current ratio & quick ratio accounts receivable turnover & days sales in receivables Inventory turnover & days in inventory gross profit margin ratio, profit margin & return on investment After completing all the necessary calculations and analyses, explain what that information tells us about the companies: 1. Write a comparison of each company's 2016's current & quick ratio to its 2017 ratios, and a comparison of Pepsi's current & quick ratio to Coca-Cola's. Which company seems to be more liquid? What are the advantages and disadvantages of liquidity? 2. Write a comparison of each company's 2016's accounts receivable turnover and days sales in receivables to its 2017 ratios, and a comparison of Pepsi's accounts receivable turnover and days sales in receivables to Coca- Cola's. Which of the two seems to be doing a better job with receivables? How does this collection process affect the overall success of the companies? 3. Write a comparison of each company's 2016's inventory turnover and days in inventory to its 2017 ratios, and a comparison of Pepsi's inventory turnover and days in inventory to Coca-Cola's. Calculate for both companies for 2016 and 2017. Write a paragraph comparing 2016 with 2017 and Coca-Cola with Pepsi using these two ratios to indicate how they manage their inventory. Which one of the two companies has a better approach to inventory management? Why? What are the problems that come with poor inventory management? 4. Indicate which company shows the best prospects for future profits and explain in detail why you think the ratios support your observation. 5. Write a summary comparison of each company's 2016's vertical analysis to its 2017 analysis, and a summary comparison of Pepsi's vertical analysis to Coca-Cola's. Explain why vertical analyses are beneficial. 6. Write a summary comparison of each company's 2016's horizontal analysis to its 2017 analysis, and a summary comparison of Pepsi's horizontal analysis to Coca-Cola's. What do the changes indicate about the companies improvement or lack thereof between 2016 and 20177 Explain why one company is better than the other. 7. Based on all of your calculations and observations described above, make a recommendation as to which company would be a better investment. Give the reasons for your conclusion. Coca-Cola Balance Sheet Vertical Analysis 2017 2016 Cash and cash 6006000 6.8 8555000 9.8 equivalents Short term 14669000 16.7 13646000 15.6 investments Net Receivables Inventory Other Current Assets Total current 3667000 4.2 3856000 4.4 2655000 3.0 2675000 3.1 7548000 8.6 2797000 3.2 36,545,000 41.6 34,010,000 39.0 assets Gross property, plant, and 8203000 9.3 10635000 12.2 equipment Equity and other 21952000 investments 25.0 17249000 19.8 Goodwill 9401000 10.7 10629000 19.8 Intangible assets 7235000 Other assets Total assets Accounts 8.2 10499000 12.0 4560000 52 4248000 49 100.0 87,896.000 8748000 100.0 87,270,000 10.0 9490000 10.9 payable Taxes payable 307000 4887000 0.4 5.6 410000 0.5 Accrued 5259000 6.0 liabilities Other current liabilities 1533000 17 710000 0.8 29684000 34.0 Long Term debt Deferred taxes 31182000 2522000 35.5 2.9 53000 :4.3 liabilities 4081000 4.7 Other long term llabilities 8021000 73.4 64,050,000 1760000 65502000 68,919,000 78.4 Total liabilities Common Stock 1760000 20 2.0 75.1 Retained 60430000 68.8 earnings Accumulated (11.7) (11205000) 12.8 (1030s000) other comprehensive Income Total 17,072,000 19.4 23,062,000 26.4 stockholder's equity Total liabilities 87,896,000 100.0 87,270,000 100.0 and stockholder's equity Coca-Cola Balance Sheet Horizontal Analysis 2017 6006000 2016 Difference Cash and cash 8555000 (2549000) (29.8) equivalents Short term 14669000 13646000 1023000 7.5 investments Net Receivables 3667000 3856000 (189000) (20,000) 4751000 (4.9) (0.7) 169.7 2655000 Inventory Other Current 2675000 7548000 2797000 Assets Total current 36,545,000 34,010,000 2,535,000 7.5 assets Gross property. 8203000 10635000 (2432000) (22.9) plant, and equipment Equity and other 21952000 investments Goodwill 17249000 4703000 27.3 (1228000) (3264000) (11.6) 10.3) 9401000 10629000 Intangible assets 7235000 Other assets 10499000 4560000 4248000 87,270,000 9490000 312000 7.3 Total assets 87,896,000 626,000 0.7 Accounts 8748000 (742000) (7.8) payable Taxes payable 103000 410000 5259000 307000 4887000 33.6 Accrued 372000 7.6 liabilities Other current 1533000 710000 823000 115.9 iabilities Long Term debt Deferred taxes liabilities 31182000 2522000 29684000 1498000 50.5 3753000 (1231000) (32.8) Other long term liabilities 8021000 4081000 3940000 96.5 Total liabilities 68,919,000 64,050,000 4,869,000 7.6 Common Stock 1760000 1760000 Retained 60430000 65502000 (5072000) (7.7) earnings Accumulated (10305000) (11205000) 900000 (8.0) other comprehensive income Total 17,072,000 23,062,000 (5,990,000) (26.0) stockholder's equity Total liabilities 87,896,000 87,270,000 626,000 0.7 and stockholder's equity Coca-Cola Income Statement Vertical Analysis 2017 2016 35,410,000 13256000 100.0 41.863,000 16465000 25398000 100.0 Total Revenue Cost of revenue 37.4 39.3 Gross profit 22154000 62.6 60,7 Selling. general, administrative 12496000 35.3 15262000 36.5 and other 7501000 21.2 8626000 20.6 Operating incorne Interest expense Total other income/expenses 733000 (399000) 841000 2.4 1.6 (595000) (1.7) (0.95) net Income before 6742000 19.0 8136000 19.4 tax Income tax 5560000 15,7 1586000 3.8 еxpense Income from 1182000 3.3 6550000 15.6 continuing operations Net Income 1,248,000 3.5 6,527,000 15.6 Coca-Cola Income Statement Horizontal Analysis. 2017 2016 Dilference (6,453,000) (3209000) (3244000) (2766000) (15.4) (19.5) (12.8) (18.1) Total Revenue 35,410,000 13256000 41,863,000 16465000 Cost of revenue Gross profit Selling, general, administrative 22154000 25398000 12496000 15262000 and other Operating 7501000 8626000 (1125000) (13.0) income 14.7 Interest expense 841000 Total other income/expenses 733000 108000 (595000) (399000) (196000) 49.1 net Income before 6742000 8136000 (7494000) (92.1) tax Income tax 5560000 1586000 3974000 250.6 expense Income from continuing 1182000 6550000 (5368000) (82.0) operations Net Income 1,248,000 6,527,000 (5,279,000) (80.9) Horizonal Analvsis for Pepsi Balance Sheet in thousands Asssts Change Cash and Cash Equivalents Short Term Investments Total Cash Net Receivables Dollar Amount Change Percent 1,452.000 1,933,000 3,385,000 247,000 224,000 3, 938,000 2,228,000 (1.639,000) 15.9 27.7 21.0 4.3 8.2 Inventory Total Curent Assets 14.5 8.2 Gross Property. Plant, and Equipment Accumulated Depreciation 4.4 Net Property, Plant, and Equipment Equity/Other Investments 649,000 92.000 3.2 0.5 1.6 314,000 405,000 8,000 1,737,000 5,675,000 Goodwill 3.0 Intangible Assets Other Long-Tem Assets Total Noncurrent Assets 23 3.7 7.7 Total Assets Liabilities Total Revenue (1.407,000) 369.000 (54,000) 180,000 (633,000) 3,743,000 (1,031.000) 4.614,000 6,526,000 5.893,000 -0.2 9.2 Accounts Payable Accrued Liabilities Other Current Liabilities Total Current Liabilities Long Term Debt Deferred Taxes Liabilities Other Long Tem Liabilities Total Noncurrent Liabilities Total Liabilities -22 6.4 -2.9 12.4 -20.3 692 14.6 9.4 Stockholder Equity Common Stock 100 0.6 62 Retained Eamings Accumulated Other Comprehensive Income Total Stockholders' Equity Total Liabilities and Stackholders Equity 321,000 862,000 (206,000) 5.675.000 1.9 77 Dolar Amount Changs Percent Income Statement in thousands Change Total Revenue 726,000 12 Cost of Revenue Gross Profit 576,000 150,000 (504.000) 2.0 0.4 -2.0 Selling General and Admin. Total Operating Expenses Operating Income or Loss Interest Expense Before Income Tax -2.3 (574,000) 724,000 (191.000) 1,049,000 2,520,000 (1,471,000) (1.472,000) (1,470,000) 7.4 -14,2 12.2 Income Tax Expense Income from Continuing Operations Net Income Net Income Available for Common Stock 116,0 -23.1 -23.3 -23.2 Vertical Analysis for Pepsi 2017 13% 11% 24% 8% 4% 39% 49% -27% Balance Sheet in thousands Cash and Cash Equivalents Short Term Investments Total Cash 2016 12% 9% 22% 8% 4% 37% 50% -27% Net Receivables Inventory Total Current Assets Gross Property, Plant, and Equipment Accumulated Depreciation Net Property. Plant, and Equipment Equity Other Investments Goodwill Intangible Assets Other Long-Term Assets Total Noncurrent Assets Total Assets Liabilities Total Revenue Accounts Payable Accrued Liabilities Other Current Liabilities Total Current Liabilities Long Term Debt Deferred Taxes Liabilities Other Long Tenm Liabilities Total Noncurrent Liabilities Total Liabilities Stockholders Equity Common Stock Retained Earnings Accumulated Other Comprebensive Income Total Stockholders' Equity 22% 22% 3% 19% 17% 0.4% 61% 19% 0.05% 63% 100% 100% 7% 8% 3% 4% 26% 42% 4% 14% 61% 86% 3% 4% 29% 41% 7% 9% $6% 85% 0.1% 66% 0.1% 71% -16.4% -18.8% 14% 15% Total Liabilities and Stockholders' Equity 100% 100% ETT Income Statement in thousands Total Revenue Cost of Revenue Gross Profit Selling General and Admin. Total Operating Expenses Operating Income or Loss Interest Expense Before Income Tax Income Tax Expense Income from Continuing Operations 2017 100% 45% 55% 2016 100% 45% 55% 38% 38% 17% 2% 39% 39% 16% 2% 14% 3% 10% 10% 10% 15% 7% 8% Net Income Net Income Available for Common Stock 8% 8% Create a vertical (same-size) & horizontal analysis (change in dollars and percent of change) for Coca-Cola and Pepsi, for 2016 and 2017. Also, calculate the following ratios for Coca-Cola and Pepsi, for 2016 and 2017: current ratio & quick ratio accounts receivable turnover & days sales in receivables Inventory turnover & days in inventory gross profit margin ratio, profit margin & return on investment After completing all the necessary calculations and analyses, explain what that information tells us about the companies: 1. Write a comparison of each company's 2016's current & quick ratio to its 2017 ratios, and a comparison of Pepsi's current & quick ratio to Coca-Cola's. Which company seems to be more liquid? What are the advantages and disadvantages of liquidity? 2. Write a comparison of each company's 2016's accounts receivable turnover and days sales in receivables to its 2017 ratios, and a comparison of Pepsi's accounts receivable turnover and days sales in receivables to Coca- Cola's. Which of the two seems to be doing a better job with receivables? How does this collection process affect the overall success of the companies? 3. Write a comparison of each company's 2016's inventory turnover and days in inventory to its 2017 ratios, and a comparison of Pepsi's inventory turnover and days in inventory to Coca-Cola's. Calculate for both companies for 2016 and 2017. Write a paragraph comparing 2016 with 2017 and Coca-Cola with Pepsi using these two ratios to indicate how they manage their inventory. Which one of the two companies has a better approach to inventory management? Why? What are the problems that come with poor inventory management? 4. Indicate which company shows the best prospects for future profits and explain in detail why you think the ratios support your observation. 5. Write a summary comparison of each company's 2016's vertical analysis to its 2017 analysis, and a summary comparison of Pepsi's vertical analysis to Coca-Cola's. Explain why vertical analyses are beneficial. 6. Write a summary comparison of each company's 2016's horizontal analysis to its 2017 analysis, and a summary comparison of Pepsi's horizontal analysis to Coca-Cola's. What do the changes indicate about the companies improvement or lack thereof between 2016 and 20177 Explain why one company is better than the other. 7. Based on all of your calculations and observations described above, make a recommendation as to which company would be a better investment. Give the reasons for your conclusion. Coca-Cola Balance Sheet Vertical Analysis 2017 2016 Cash and cash 6006000 6.8 8555000 9.8 equivalents Short term 14669000 16.7 13646000 15.6 investments Net Receivables Inventory Other Current Assets Total current 3667000 4.2 3856000 4.4 2655000 3.0 2675000 3.1 7548000 8.6 2797000 3.2 36,545,000 41.6 34,010,000 39.0 assets Gross property, plant, and 8203000 9.3 10635000 12.2 equipment Equity and other 21952000 investments 25.0 17249000 19.8 Goodwill 9401000 10.7 10629000 19.8 Intangible assets 7235000 Other assets Total assets Accounts 8.2 10499000 12.0 4560000 52 4248000 49 100.0 87,896.000 8748000 100.0 87,270,000 10.0 9490000 10.9 payable Taxes payable 307000 4887000 0.4 5.6 410000 0.5 Accrued 5259000 6.0 liabilities Other current liabilities 1533000 17 710000 0.8 29684000 34.0 Long Term debt Deferred taxes 31182000 2522000 35.5 2.9 53000 :4.3 liabilities 4081000 4.7 Other long term llabilities 8021000 73.4 64,050,000 1760000 65502000 68,919,000 78.4 Total liabilities Common Stock 1760000 20 2.0 75.1 Retained 60430000 68.8 earnings Accumulated (11.7) (11205000) 12.8 (1030s000) other comprehensive Income Total 17,072,000 19.4 23,062,000 26.4 stockholder's equity Total liabilities 87,896,000 100.0 87,270,000 100.0 and stockholder's equity Coca-Cola Balance Sheet Horizontal Analysis 2017 6006000 2016 Difference Cash and cash 8555000 (2549000) (29.8) equivalents Short term 14669000 13646000 1023000 7.5 investments Net Receivables 3667000 3856000 (189000) (20,000) 4751000 (4.9) (0.7) 169.7 2655000 Inventory Other Current 2675000 7548000 2797000 Assets Total current 36,545,000 34,010,000 2,535,000 7.5 assets Gross property. 8203000 10635000 (2432000) (22.9) plant, and equipment Equity and other 21952000 investments Goodwill 17249000 4703000 27.3 (1228000) (3264000) (11.6) 10.3) 9401000 10629000 Intangible assets 7235000 Other assets 10499000 4560000 4248000 87,270,000 9490000 312000 7.3 Total assets 87,896,000 626,000 0.7 Accounts 8748000 (742000) (7.8) payable Taxes payable 103000 410000 5259000 307000 4887000 33.6 Accrued 372000 7.6 liabilities Other current 1533000 710000 823000 115.9 iabilities Long Term debt Deferred taxes liabilities 31182000 2522000 29684000 1498000 50.5 3753000 (1231000) (32.8) Other long term liabilities 8021000 4081000 3940000 96.5 Total liabilities 68,919,000 64,050,000 4,869,000 7.6 Common Stock 1760000 1760000 Retained 60430000 65502000 (5072000) (7.7) earnings Accumulated (10305000) (11205000) 900000 (8.0) other comprehensive income Total 17,072,000 23,062,000 (5,990,000) (26.0) stockholder's equity Total liabilities 87,896,000 87,270,000 626,000 0.7 and stockholder's equity Coca-Cola Income Statement Vertical Analysis 2017 2016 35,410,000 13256000 100.0 41.863,000 16465000 25398000 100.0 Total Revenue Cost of revenue 37.4 39.3 Gross profit 22154000 62.6 60,7 Selling. general, administrative 12496000 35.3 15262000 36.5 and other 7501000 21.2 8626000 20.6 Operating incorne Interest expense Total other income/expenses 733000 (399000) 841000 2.4 1.6 (595000) (1.7) (0.95) net Income before 6742000 19.0 8136000 19.4 tax Income tax 5560000 15,7 1586000 3.8 еxpense Income from 1182000 3.3 6550000 15.6 continuing operations Net Income 1,248,000 3.5 6,527,000 15.6 Coca-Cola Income Statement Horizontal Analysis. 2017 2016 Dilference (6,453,000) (3209000) (3244000) (2766000) (15.4) (19.5) (12.8) (18.1) Total Revenue 35,410,000 13256000 41,863,000 16465000 Cost of revenue Gross profit Selling, general, administrative 22154000 25398000 12496000 15262000 and other Operating 7501000 8626000 (1125000) (13.0) income 14.7 Interest expense 841000 Total other income/expenses 733000 108000 (595000) (399000) (196000) 49.1 net Income before 6742000 8136000 (7494000) (92.1) tax Income tax 5560000 1586000 3974000 250.6 expense Income from continuing 1182000 6550000 (5368000) (82.0) operations Net Income 1,248,000 6,527,000 (5,279,000) (80.9) Horizonal Analvsis for Pepsi Balance Sheet in thousands Asssts Change Cash and Cash Equivalents Short Term Investments Total Cash Net Receivables Dollar Amount Change Percent 1,452.000 1,933,000 3,385,000 247,000 224,000 3, 938,000 2,228,000 (1.639,000) 15.9 27.7 21.0 4.3 8.2 Inventory Total Curent Assets 14.5 8.2 Gross Property. Plant, and Equipment Accumulated Depreciation 4.4 Net Property, Plant, and Equipment Equity/Other Investments 649,000 92.000 3.2 0.5 1.6 314,000 405,000 8,000 1,737,000 5,675,000 Goodwill 3.0 Intangible Assets Other Long-Tem Assets Total Noncurrent Assets 23 3.7 7.7 Total Assets Liabilities Total Revenue (1.407,000) 369.000 (54,000) 180,000 (633,000) 3,743,000 (1,031.000) 4.614,000 6,526,000 5.893,000 -0.2 9.2 Accounts Payable Accrued Liabilities Other Current Liabilities Total Current Liabilities Long Term Debt Deferred Taxes Liabilities Other Long Tem Liabilities Total Noncurrent Liabilities Total Liabilities -22 6.4 -2.9 12.4 -20.3 692 14.6 9.4 Stockholder Equity Common Stock 100 0.6 62 Retained Eamings Accumulated Other Comprehensive Income Total Stockholders' Equity Total Liabilities and Stackholders Equity 321,000 862,000 (206,000) 5.675.000 1.9 77 Dolar Amount Changs Percent Income Statement in thousands Change Total Revenue 726,000 12 Cost of Revenue Gross Profit 576,000 150,000 (504.000) 2.0 0.4 -2.0 Selling General and Admin. Total Operating Expenses Operating Income or Loss Interest Expense Before Income Tax -2.3 (574,000) 724,000 (191.000) 1,049,000 2,520,000 (1,471,000) (1.472,000) (1,470,000) 7.4 -14,2 12.2 Income Tax Expense Income from Continuing Operations Net Income Net Income Available for Common Stock 116,0 -23.1 -23.3 -23.2 Vertical Analysis for Pepsi 2017 13% 11% 24% 8% 4% 39% 49% -27% Balance Sheet in thousands Cash and Cash Equivalents Short Term Investments Total Cash 2016 12% 9% 22% 8% 4% 37% 50% -27% Net Receivables Inventory Total Current Assets Gross Property, Plant, and Equipment Accumulated Depreciation Net Property. Plant, and Equipment Equity Other Investments Goodwill Intangible Assets Other Long-Term Assets Total Noncurrent Assets Total Assets Liabilities Total Revenue Accounts Payable Accrued Liabilities Other Current Liabilities Total Current Liabilities Long Term Debt Deferred Taxes Liabilities Other Long Tenm Liabilities Total Noncurrent Liabilities Total Liabilities Stockholders Equity Common Stock Retained Earnings Accumulated Other Comprebensive Income Total Stockholders' Equity 22% 22% 3% 19% 17% 0.4% 61% 19% 0.05% 63% 100% 100% 7% 8% 3% 4% 26% 42% 4% 14% 61% 86% 3% 4% 29% 41% 7% 9% $6% 85% 0.1% 66% 0.1% 71% -16.4% -18.8% 14% 15% Total Liabilities and Stockholders' Equity 100% 100% ETT Income Statement in thousands Total Revenue Cost of Revenue Gross Profit Selling General and Admin. Total Operating Expenses Operating Income or Loss Interest Expense Before Income Tax Income Tax Expense Income from Continuing Operations 2017 100% 45% 55% 2016 100% 45% 55% 38% 38% 17% 2% 39% 39% 16% 2% 14% 3% 10% 10% 10% 15% 7% 8% Net Income Net Income Available for Common Stock 8% 8%
Expert Answer:

Related Book For 

Managerial Accounting Tools for business decision making
ISBN: 978-1118096895
6th Edition
Authors: Jerry J. Weygandt, Paul D. Kimmel, Donald E. Kieso
Posted Date:
Students also viewed these accounting questions
-
Calculate the following ratios for Lake of Egypt Marina Inc. as of year-end 2016. Using these ratios for Lake of Egypt Marina, Inc., and the industry, what can you conclude about Lake of Egypt...
-
Manufacturing cost data for Banta Company are presented below. Option A Option B 85,500 (a) 47,000 46,000 46,500 175,575 (b) 197,075 Direct materials used Direct labor Manufacturing overhead Total...
-
Calculate the following ratios for Reitmans for 2011 and 2012: a. Profit margin b. Return on equity c. Current ratio d. Debt-to-equity ratio e. Gross margin FS3-
-
The operations manager of a company that produces frozen dinners had received numerous complaints from supermarkets about the companys Chick-n-Gravy dinners. The manager spilled/mixed items,...
-
Reconsider Prob. 10-80. Using EES (or other) software, study the effects of the gas cycle pressure ratio as it is varied from 10 to 20 on the ratio of gas flow rate to steam flow rate and cycle...
-
Mamlouk Design is an Egyptian manufacturer of handmade silk rugs. The company manufactures rugs in two different sizes: 1.5 x 2.5 meters and 2 x 3 meters. The manufacturing process depends mainly on...
-
What is the hedonic wage function? What does the slope of the hedonic wage function measure?
-
The Centrico Medical Laboratory, a government-sponsored charity, is located on the island of Ste. Lucretia. The laboratory has just finished its operations for September, which was a particularly...
-
1: In a short paragraph, examine what the term economics actually is. In your description, be sure to relate why scarcity exists, how society gets resources, and how people make decisions on how to...
-
Use the accounting equation to answer each of the following questions: (Round answers to the nearest whole dollar, e.g. 5,275.) (a) The liabilities of Sandhill Company are $122,000 and the owner's...
-
Dugar, A., Gujarathi, M. R. (2018). Toshiba's creative accounting for construction contracts. Issues in Accounting Education, 33 (3), 117-134 The FASB and the IASB have issued a joint standard on...
-
What is a side-channel attack? Please provide examples of sidechannel attacks!
-
For which architectures would you expect the largest benefits from a replacement of floating-point arithmetic by fixed-point arithmetic?
-
What is a (design) model?
-
How would you define the term cyber-physical system (CPS)? Do you see any difference between the terms embedded systems and cyber-physical systems?
-
Which challenges do you see for the security of embedded systems?
-
Does external growth provide a solution to the make-or-buy problem? Your answer should differentiate between horizontal, vertical and diversified growth.
-
Write an SQL statement to display all data on products having a QuantityOnHand greater than 0.
-
Duncan Company combines its operating expenses for budget purposes in a selling and administrative expense budget. For the first 6 months of 2014, the following data are available. 1. Sales: 20,000...
-
Degelman Company uses a job order cost system and applies overhead to production on the basis of direct labor costs. On January 1, 2014, Job No. 50 was the only job in process. The costs incurred...
-
The production budget of Justus Company calls for 80,000 units to be produced. If it takes 45 minutes to make one unit and the direct labor rate is $16 per hour, what is the total budgeted direct...
-
Using the transformation \(w=\sin (z)\), determine the equation for the stream function for flow inside the semi-infinite region \(y \geq 0,-\pi / 2 \leq x \leq \pi / 2\) shown in Figure P9.17. -/2...
-
The method of images uses precisely oriented collections of sources, sinks, and vortices to establish artificial walls and so simulate more complicated flow fields. One such flow field is formed by...
-
A stream function is given by: \[\psi=\sin \left(\frac{x}{L} ight) \sinh \left(\frac{y}{K} ight)\] where \(L\) and \(K\) are constants, \(0 \leq x \leq \pi L\) and \(y \geq 0\). a. Does \(\psi\)...

Study smarter with the SolutionInn App