Answered step by step
Verified Expert Solution
Question
1 Approved Answer
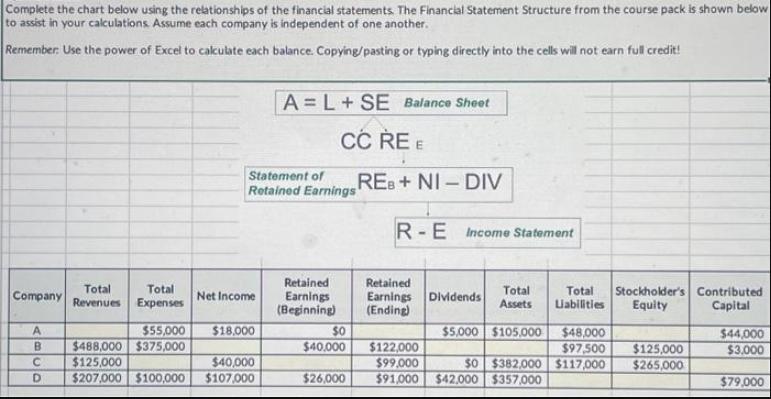
Complete the chart below using the relationships of the financial statements. The Financial Statement Structure from the course pack is shown below to assist

Complete the chart below using the relationships of the financial statements. The Financial Statement Structure from the course pack is shown below to assist in your calculations. Assume each company is independent of one another. Remember: Use the power of Excel to calculate each balance. Copying/pasting or typing directly into the cells will not earn full credit! Company ABCO $55,000 $488,000 $375,000 $125,000 D $207,000 Total Revenues Total Expenses Statement of Retained Earnings Net Income $18,000 A=L+SE Balance Sheet CC RE E $40,000 $100,000 $107.000 Retained Earnings (Beginning) $0 $40,000 $26,000 REB+ NI-DIV R-E Income Statement Retained Earnings (Ending) Dividends Total Assets Total Liabilities $5,000 $105,000 $48,000 $97,500 $122,000 $99,000 $0 $382,000 $117,000 $91,000 $42,000 $357,000 Stockholder's Contributed Equity Capital $125,000 $265,000 $44,000 $3.000 $79,000
Step by Step Solution
★★★★★
3.41 Rating (148 Votes )
There are 3 Steps involved in it
Step: 1
Basic formulae as given in the question Balance sheetALSE ieAsset Liabilities stockholders equitySE ...
Get Instant Access to Expert-Tailored Solutions
See step-by-step solutions with expert insights and AI powered tools for academic success
Step: 2

Step: 3

Ace Your Homework with AI
Get the answers you need in no time with our AI-driven, step-by-step assistance
Get Started


