

Compute the required rate of return on common equity capital and the weighted average cost of capital
Fantastic news! We've Found the answer you've been seeking!
Question:
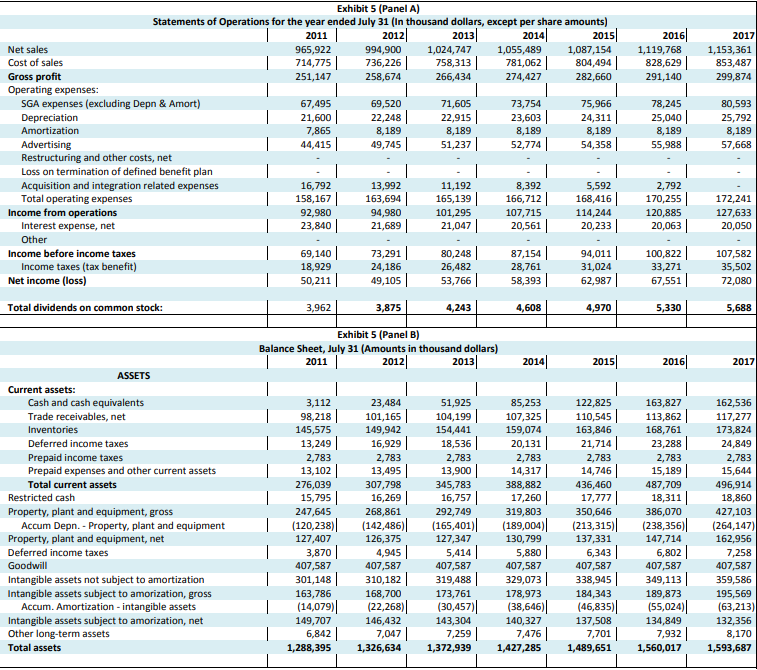
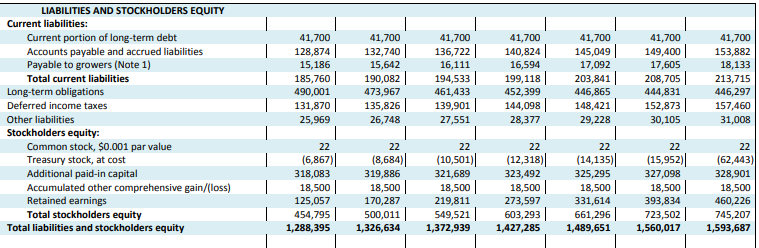
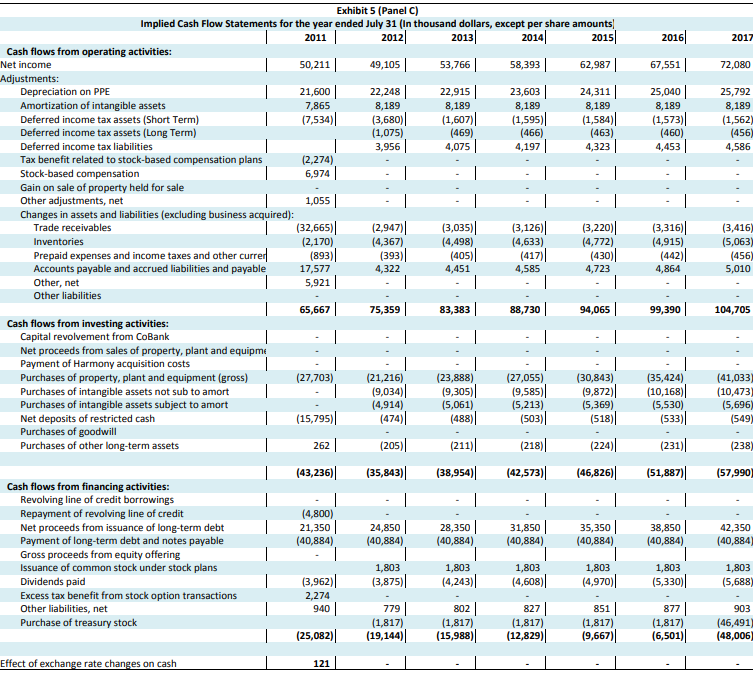
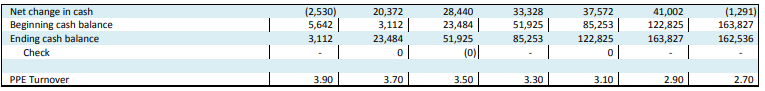
Compute the required rate of return on common equity capital and the weighted average cost of capital for Diamond at the start of fiscal year 2012
Transcribed Image Text:
Net sales Cost of sales Gross profit Operating expenses: SGA expenses (excluding Depn & Amort) Depreciation Amortization Advertising Restructuring and other costs, net Loss on termination of defined benefit plan Acquisition and integration related expenses Total operating expenses Income from operations Interest expense, net Other Income before income taxes Income taxes (tax benefit) Exhibit 5 (Panel A) Statements of Operations for the year ended July 31 (In thousand dollars, except per share amounts) 2011 2012 994,900 2013 1,024,747 758,313 2014 1,055,489 736,226 | 781,062 258,674 266,434 274,427 Net income (loss) Total dividends on common stock: Current assets: ASSETS Restricted cash Cash and cash equivalents Trade receivables, net Inventories Deferred income taxes Prepaid income taxes Prepaid expenses and other current assets Total current assets Property, plant and equipment, gross Accum Depn. - Property, plant and equipment Property, plant and equipment, net Deferred income taxes Goodwill Intangible assets not subject to amortization Intangible assets subject to amorization, gross Accum. Amortization - intangible assets Intangible assets subject to amorization, net Other long-term assets Total assets 965,922 714,775 251,147 67,495 21,600 7,865 44,415 16,792 158,167 92,980 23,840 69,140 18,929 50,211 3,962 3,112 98,218 145,575 13,249 2,783 13,102 276,039 15,795 247,645 (120,238) 127,407 3,870 407,587 301,148 69,520 22,248 8,189 49,745 163,786 (14,079) 149,707 6,842 1,288,395 13,992 163,694 94,980 21,689 73,291 24,186 49,105 3,875 Exhibit 5 (Panel B) Balance Sheet, July 31 (Amounts in thousand dollars) 2011 2012 2013 23,484 101,165 149,942 16,929 2,783 13,495 307,798 16,269 268,861 (142,486) 126,375 4,945 407,587 310,182 T 168,700 (22,268) 146,432 7,047 1,326,634 71,605 22,915 8,189 51,237 11,192 165,139 101,295 21,047 80,248 26,482 53,766 4,243 51,925 104,199 154,441 18,536 2,783 13,900 345,783 16,757 292,749 (165,401) 127,347 5,414 407,587 319,488 173,761 (30,457) 143,304 7,259 1,372,939 73,754 23,603 8,189 52,774 8,392 166,712 107,715 20,561 87,154 28,761 58,393 4,608 2014 85,253 107,325 159,074 20,131 2,783 14,317 2015 388,882 17,260 1,087,154 804,494 282,660 75,966 24,311 8,189 54,358 5,592 168,416 | 114,244 20,233 | 94,011 31,024 62,987 4,970 2015 2016 5,880 407,587 329,073 178,973 184,343 (38,646) (46,835) 140,327 137,508 7,476 7,701 1,427,285 1,489,651 1,119,768 828,629 291,140 78,245 25,040 8,189 55,988 2,792 170,255 120,885 20,063 100,822 33,271 67,551 122,825 163,827 110,545 113,862 163,846 168,761 21,714 23,288 2,783 2,783 14,746 15,189 436,460 487,709 17,777 18,311 319,803 350,646 386,070 (189,004) (213,315) (238,356) 130,799 137,331 147,714 6,343 407,587 338,945 5,330 2016 6,802 407,587 349,113 189,873 (55,024) 134,849 7,932 1,560,017 2017 1,153,361 853,487 299,874 80,593 25,792 8,189 57,668 172,241 127,633 20,050 107,582 35,502 72,080 5,688 2017 162,536 117,277 173,824 24,849 2,783 15,644 496,914 18,860 427,103 (264,147) 162,956 7,258 407,587 359,586 195,569 (63,213) 132,356 8,170 1,593,687 LIABILITIES AND STOCKHOLDERS EQUITY Current liabilities: Current portion of long-term debt Accounts payable and accrued liabilities Payable to growers (Note 1) Total current liabilities Long-term obligations Deferred income taxes Other liabilities Stockholders equity: Common stock, $0.001 par value Treasury stock, at cost Additional paid-in capital Accumulated other comprehensive gain/(loss) Retained earnings Total stockholders equity Total liabilities and stockholders equity 41,700 128,874 15,186 185,760 490,001 131,870 25,969 22 (6,867) 318,083 18,500 125,057 454,795 1,288,395 41,700 132,740 15,642 190,082 473,967 135,826 26,748 22 (8,684) 319,886 18,500 170,287 500,011 1,326,634 41,700 136,722 | 16,111 194,533 461,433 139,901 27,551 22 (10,501) 321,689 18,500 219,811 549,521 | 1,372,939 41,700 140,824 16,594 199,118 452,399 144,098 28,377 22 (12,318) 323,492 18,500 41,700 145,049 17,092 22 (14,135) 325,295 18,500 331,614 661,296 1,427,285 1,489,651 273,597 603,293 203,841 446,865 148,421 29,228 41,700 149,400 17,605 208,705 444,831 152,873 30,105 22 (15,952) 327,098 18,500 393,834 723,502 1,560,017 41,700 153,882 18,133 213,715 446,297 157,460 31,008 22 (62,443) 328,901 18,500 460,226 745,207 1,593,687 Exhibit 5 (Panel C) Implied Cash Flow Statements for the year ended July 31 (In thousand dollars, except per share amounts 2011 2012 2013 2014 2015 Cash flows from operating activities: Net income Adjustments: Depreciation on PPE Amortization of intangible assets Deferred income tax assets (Short Term) Deferred income tax assets (Long Term) Deferred income tax liabilities Tax benefit related to stock-based compensation plans Stock-based compensation Gain on sale of property held for sale Other adjustments, net Changes in assets and liabilities (excluding business acquired): Trade receivables Inventories Prepaid expenses and income taxes and other currer Accounts payable and accrued liabilities and payable Other, net Other liabilities Cash flows from investing activities: Capital revolvement from CoBank Net proceeds from sales of property, plant and equipme Payment of Harmony acquisition costs Purchases of property, plant and equipment (gross) Purchases of intangible assets not sub to amort Purchases of intangible assets subject to amort Net deposits of restricted cash Purchases of goodwill Purchases of other long-term assets Cash flows from financing activities: Revolving line of credit borrowings Repayment of revolving line of credit Net proceeds from issuance of long-term debt Payment of long-term debt and notes payable Gross proceeds from equity offering Issuance of common stock under stock plans Dividends paid Excess tax benefit from stock option transactions Other liabilities, net Purchase of treasury stock Effect of exchange rate changes on cash 50,211 21,600 7,865 (7,534) (2,274) 6,974 1,055 (32,665) (2,170) (893) 17,577 5,921 65,667 (27,703) (15,795) 262 | (43,236) (4,800) 21,350 (40,884) (3,962) 2,274 940 49,105 121 22,248 8,189 (3,680) (1,075) 3,956 (2,947) (4,367) (393) 4,322 75,359 (21,216) (9,034) (4,914) (474) (205) (35,843) 24,850 (40,884) 1,803 (3,875) 779 (1,817) (25,082)| (19,144) 53,766 22,915 8,189 (1,607) (469) 4,075 (3,035) (4,498) (405) 4,451 83,383 (23,888) (9,305) (5,061) (488) (211) (38,954) 28,350 (40,884) 1,803 (4,243) 802 (1,817) (15,988) 58,393 | 23,603 8,189 (1,595) (466) 4,197 (3,126) (4,633) (417) 4,585 88,730 31,850 (40,884) 1,803 (4,608) 62,987 24,311 8,189 (1,584) (463) 827 (1,817) (12,829) 4,323 (3,220) (4,772) (430) (27,055) (9,585) (5,213) (503) (218) (42,573) (46,826) 4,723 94,065 35,350 (40,884) 1,803 (4,970) 2016 851 (1,817) (9,667) 67,551 25,040 8,189 (1,573) (460) 4,453 (30,843) (35,424) (9,872) (10,168) (5,369) (518) (224) (3,316) (4,915) (442) 4,864 99,390 (5,530) (533) (231) (51,887) 38,850 (40,884) 1,803 (5,330) 877 (1,817) (6,501) 2017 72,080 25,792 8,189 (1,562) (456) 4,586 (3,416) (5,063) (456) 5,010 104,705 (41,033) (10,473) (5,696) (549) (238) (57,990) 42,350 (40,884) 1,803 (5,688) 903 (46,491) (48,006) Net change in cash Beginning cash balance Ending cash balance Check PPE Turnover (2,530) 5,642 3,112 3.90 20,372 3,112 23,484 0 3.70 28,440 23,484 51,925 (0)| 3.50 33,328 51,925 85,253 3.30 37,572 85,253 122,825 0 3.10 41,002 122,825 163,827 2.90 (1,291) 163,827 162,536 2.70 Net sales Cost of sales Gross profit Operating expenses: SGA expenses (excluding Depn & Amort) Depreciation Amortization Advertising Restructuring and other costs, net Loss on termination of defined benefit plan Acquisition and integration related expenses Total operating expenses Income from operations Interest expense, net Other Income before income taxes Income taxes (tax benefit) Exhibit 5 (Panel A) Statements of Operations for the year ended July 31 (In thousand dollars, except per share amounts) 2011 2012 994,900 2013 1,024,747 758,313 2014 1,055,489 736,226 | 781,062 258,674 266,434 274,427 Net income (loss) Total dividends on common stock: Current assets: ASSETS Restricted cash Cash and cash equivalents Trade receivables, net Inventories Deferred income taxes Prepaid income taxes Prepaid expenses and other current assets Total current assets Property, plant and equipment, gross Accum Depn. - Property, plant and equipment Property, plant and equipment, net Deferred income taxes Goodwill Intangible assets not subject to amortization Intangible assets subject to amorization, gross Accum. Amortization - intangible assets Intangible assets subject to amorization, net Other long-term assets Total assets 965,922 714,775 251,147 67,495 21,600 7,865 44,415 16,792 158,167 92,980 23,840 69,140 18,929 50,211 3,962 3,112 98,218 145,575 13,249 2,783 13,102 276,039 15,795 247,645 (120,238) 127,407 3,870 407,587 301,148 69,520 22,248 8,189 49,745 163,786 (14,079) 149,707 6,842 1,288,395 13,992 163,694 94,980 21,689 73,291 24,186 49,105 3,875 Exhibit 5 (Panel B) Balance Sheet, July 31 (Amounts in thousand dollars) 2011 2012 2013 23,484 101,165 149,942 16,929 2,783 13,495 307,798 16,269 268,861 (142,486) 126,375 4,945 407,587 310,182 T 168,700 (22,268) 146,432 7,047 1,326,634 71,605 22,915 8,189 51,237 11,192 165,139 101,295 21,047 80,248 26,482 53,766 4,243 51,925 104,199 154,441 18,536 2,783 13,900 345,783 16,757 292,749 (165,401) 127,347 5,414 407,587 319,488 173,761 (30,457) 143,304 7,259 1,372,939 73,754 23,603 8,189 52,774 8,392 166,712 107,715 20,561 87,154 28,761 58,393 4,608 2014 85,253 107,325 159,074 20,131 2,783 14,317 2015 388,882 17,260 1,087,154 804,494 282,660 75,966 24,311 8,189 54,358 5,592 168,416 | 114,244 20,233 | 94,011 31,024 62,987 4,970 2015 2016 5,880 407,587 329,073 178,973 184,343 (38,646) (46,835) 140,327 137,508 7,476 7,701 1,427,285 1,489,651 1,119,768 828,629 291,140 78,245 25,040 8,189 55,988 2,792 170,255 120,885 20,063 100,822 33,271 67,551 122,825 163,827 110,545 113,862 163,846 168,761 21,714 23,288 2,783 2,783 14,746 15,189 436,460 487,709 17,777 18,311 319,803 350,646 386,070 (189,004) (213,315) (238,356) 130,799 137,331 147,714 6,343 407,587 338,945 5,330 2016 6,802 407,587 349,113 189,873 (55,024) 134,849 7,932 1,560,017 2017 1,153,361 853,487 299,874 80,593 25,792 8,189 57,668 172,241 127,633 20,050 107,582 35,502 72,080 5,688 2017 162,536 117,277 173,824 24,849 2,783 15,644 496,914 18,860 427,103 (264,147) 162,956 7,258 407,587 359,586 195,569 (63,213) 132,356 8,170 1,593,687 LIABILITIES AND STOCKHOLDERS EQUITY Current liabilities: Current portion of long-term debt Accounts payable and accrued liabilities Payable to growers (Note 1) Total current liabilities Long-term obligations Deferred income taxes Other liabilities Stockholders equity: Common stock, $0.001 par value Treasury stock, at cost Additional paid-in capital Accumulated other comprehensive gain/(loss) Retained earnings Total stockholders equity Total liabilities and stockholders equity 41,700 128,874 15,186 185,760 490,001 131,870 25,969 22 (6,867) 318,083 18,500 125,057 454,795 1,288,395 41,700 132,740 15,642 190,082 473,967 135,826 26,748 22 (8,684) 319,886 18,500 170,287 500,011 1,326,634 41,700 136,722 | 16,111 194,533 461,433 139,901 27,551 22 (10,501) 321,689 18,500 219,811 549,521 | 1,372,939 41,700 140,824 16,594 199,118 452,399 144,098 28,377 22 (12,318) 323,492 18,500 41,700 145,049 17,092 22 (14,135) 325,295 18,500 331,614 661,296 1,427,285 1,489,651 273,597 603,293 203,841 446,865 148,421 29,228 41,700 149,400 17,605 208,705 444,831 152,873 30,105 22 (15,952) 327,098 18,500 393,834 723,502 1,560,017 41,700 153,882 18,133 213,715 446,297 157,460 31,008 22 (62,443) 328,901 18,500 460,226 745,207 1,593,687 Exhibit 5 (Panel C) Implied Cash Flow Statements for the year ended July 31 (In thousand dollars, except per share amounts 2011 2012 2013 2014 2015 Cash flows from operating activities: Net income Adjustments: Depreciation on PPE Amortization of intangible assets Deferred income tax assets (Short Term) Deferred income tax assets (Long Term) Deferred income tax liabilities Tax benefit related to stock-based compensation plans Stock-based compensation Gain on sale of property held for sale Other adjustments, net Changes in assets and liabilities (excluding business acquired): Trade receivables Inventories Prepaid expenses and income taxes and other currer Accounts payable and accrued liabilities and payable Other, net Other liabilities Cash flows from investing activities: Capital revolvement from CoBank Net proceeds from sales of property, plant and equipme Payment of Harmony acquisition costs Purchases of property, plant and equipment (gross) Purchases of intangible assets not sub to amort Purchases of intangible assets subject to amort Net deposits of restricted cash Purchases of goodwill Purchases of other long-term assets Cash flows from financing activities: Revolving line of credit borrowings Repayment of revolving line of credit Net proceeds from issuance of long-term debt Payment of long-term debt and notes payable Gross proceeds from equity offering Issuance of common stock under stock plans Dividends paid Excess tax benefit from stock option transactions Other liabilities, net Purchase of treasury stock Effect of exchange rate changes on cash 50,211 21,600 7,865 (7,534) (2,274) 6,974 1,055 (32,665) (2,170) (893) 17,577 5,921 65,667 (27,703) (15,795) 262 | (43,236) (4,800) 21,350 (40,884) (3,962) 2,274 940 49,105 121 22,248 8,189 (3,680) (1,075) 3,956 (2,947) (4,367) (393) 4,322 75,359 (21,216) (9,034) (4,914) (474) (205) (35,843) 24,850 (40,884) 1,803 (3,875) 779 (1,817) (25,082)| (19,144) 53,766 22,915 8,189 (1,607) (469) 4,075 (3,035) (4,498) (405) 4,451 83,383 (23,888) (9,305) (5,061) (488) (211) (38,954) 28,350 (40,884) 1,803 (4,243) 802 (1,817) (15,988) 58,393 | 23,603 8,189 (1,595) (466) 4,197 (3,126) (4,633) (417) 4,585 88,730 31,850 (40,884) 1,803 (4,608) 62,987 24,311 8,189 (1,584) (463) 827 (1,817) (12,829) 4,323 (3,220) (4,772) (430) (27,055) (9,585) (5,213) (503) (218) (42,573) (46,826) 4,723 94,065 35,350 (40,884) 1,803 (4,970) 2016 851 (1,817) (9,667) 67,551 25,040 8,189 (1,573) (460) 4,453 (30,843) (35,424) (9,872) (10,168) (5,369) (518) (224) (3,316) (4,915) (442) 4,864 99,390 (5,530) (533) (231) (51,887) 38,850 (40,884) 1,803 (5,330) 877 (1,817) (6,501) 2017 72,080 25,792 8,189 (1,562) (456) 4,586 (3,416) (5,063) (456) 5,010 104,705 (41,033) (10,473) (5,696) (549) (238) (57,990) 42,350 (40,884) 1,803 (5,688) 903 (46,491) (48,006) Net change in cash Beginning cash balance Ending cash balance Check PPE Turnover (2,530) 5,642 3,112 3.90 20,372 3,112 23,484 0 3.70 28,440 23,484 51,925 (0)| 3.50 33,328 51,925 85,253 3.30 37,572 85,253 122,825 0 3.10 41,002 122,825 163,827 2.90 (1,291) 163,827 162,536 2.70
Expert Answer:

Related Book For 
Posted Date:
Students also viewed these finance questions
-
The required rate of return for Ola Industries is 15.75 percent. The stock pays a current dividend of $1.30, and the expected growth rate is 11 percent. Calculate the estimated price.
-
Assume that the consensus required rate of return on common stocks is 14 percent. In addition, you read in Fortune that the expected rate of inflation is 5 percent and the estimated long-term real...
-
1. Suppose the required rate of return on stock is 11% and the growth rate is 5%. If the current price of stock is $20, then what is the value of D1 (next period's dividend)? 2. Suppose the required...
-
According to the American Red Cross, 11.6% of all Connecticut residents have Type B blood. A random sample of 28 Connecticut residents is taken. X = the number of Connecticut residents that have Type...
-
Find the slope of the tangent line to each of the following curves at 0 = rr/3. a. r = 2 cos b. r = 1 + sin c. r = sin 2 d. r = 4 - 3 cos
-
State whether each statement is true or false. If false, give a reason. {apple, orange, banana, pear} is equivalent to {tomato, corn, spinach, radish}
-
Plaintiff grounds manager sued a manufacturer, Monsanto, alleging that herbicide use caused his non-Hodgkins lymphoma. The jury awarded the plaintiff \($39.3\) million in compensatory damages and...
-
Stratford Company distributes a lightweight lawn chair that sells for $15 per unit. Variable costs are $6 per unit, and fixed costs total $180,000 annually. Required: Answer the following independent...
-
Description In this assignment we will implement the method of Least Squares fitting using a python script. For matrix routines, you may choose to use the linear algebra library routines in the numpy...
-
Paolo is a 50% partner in the Capri Partnership and has decided to terminate his partnership interest. Paolo is considering two options as potential exit strategies. The first is to sell his...
-
An organization's break-even point is 4,000 units at a sales price of $50 per unit, variable cost of $30 per unit, and total fixed costs of $80,000. If the company sells 500 additional units, by how...
-
Question a In chapter 14, we learn about the fraud triangle. Research the "fraud triangle". Do you think fraud can still occur if one of the elements of the fraud triangle is not present? Explain....
-
Two mining fields, Field A and Field B, of a coal mining company produce Lignite and Bituminous coal. The operating cost per day for Field A and Field B are $55,000 and $45,000, respectively. The...
-
A small object is projected from level ground with an initial velocity of magnitude 18.0 m/s and directed at an angle of 60.0 above the horizontal. Part A What is the horizontal displacement of the...
-
Faculty of Management, Law and Social Sciences Assessment Information Form DEPARTMENT Accounting, Finance and Economics MODULE TITLE Empirical Methods in Accounting and Finance MODULE CODE AFE6014-B...
-
In this group assignment, each team will collaboratively present comprehensive report and accompanying PowerPoint presentation to address the concerns of a prospective investor. As an investment...
-
A small organization wishes to setup a network management system to detect network failures and monitor the general network health. To avoid data overload, the organization wants to monitor no more...
-
If a test has high reliability. O the test measures what the authors of the test claim it measures O people who take the same test twice get approximately the same scores both times O scores on the...
-
The Parker Dental Supply Company sells at $32 per share, and Ray Parker, the CEO of this well known Research Triangle firm, estimates the latest 12-month earnings are $4 per share with a dividend...
-
What is meant by in-house trading? Who is likely to benefit from this activity?
-
What does it mean to say that YTM is a promised yield?
-
How does the exponential smoothing method of time series differ from the moving average method?
-
What is \(p\) th-order autocorrelation? How does it help in formulating an autoregressive model of trend fitting and forecasting?
-
What are the components of a time-series model? How can you determine which pattern exists over time and which model you should use?

Study smarter with the SolutionInn App