

Connect the waveform generator output of the oscilloscope to Channel 1 of the oscilloscope. After turning the
Question:
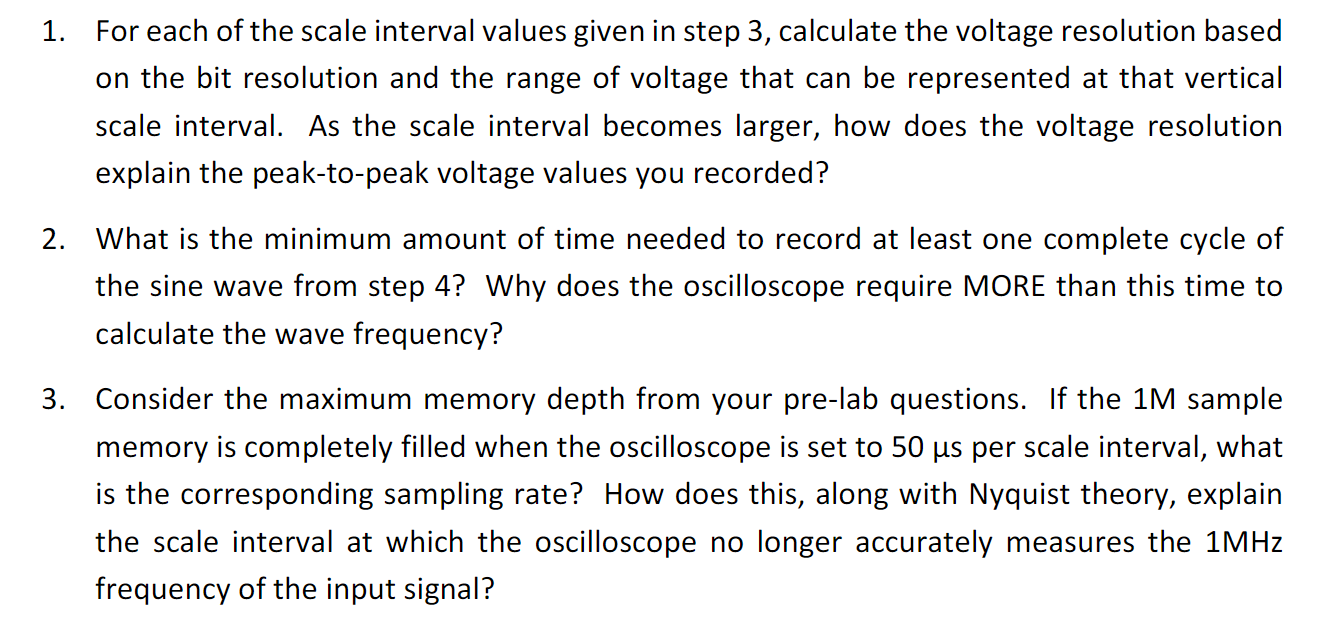
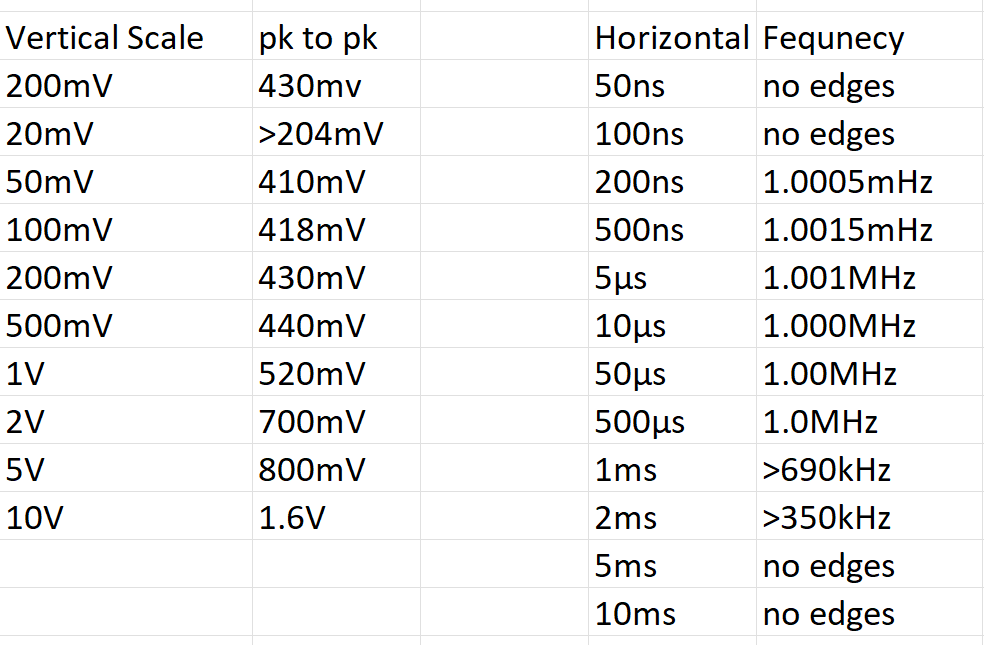
Connect the waveform generator output of the oscilloscope to Channel 1 of the oscilloscope. After turning the oscilloscope on, turn off the display for Channel 2. Make sure that Channel 1 is set to DC coupling. 2. Record the number of horizontal and vertical intervals represented in the plot area. The number of intervals is constant, but the scaling of these intervals can be set by the user. 3. In the waveform generator settings, set the output to be a sine wave of 200 Hz and an amplitude of 200 mV. Change the horizontal scale of the oscilloscope so that you can see 2-5 complete cycles of the sine wave on the screen. For each of the vertical scale intervals listed in the table below, use the Measure function of the oscilloscope and record the Peak-to-Peak voltage of Channel 1. At each vertical scale interval, observe the Peak-to- Peak measurement for a few seconds and record the observable resolution of the measurement.
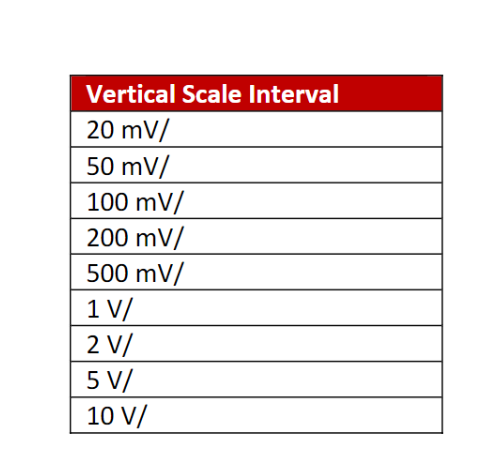
In the waveform generator settings, set the output to be a sine wave of 1 MHz and an amplitude of 1 V. Adjust the vertical scale of the oscilloscope to maximize the height of the sine wave while capturing both the top and bottom peaks on the screen. For each of the horizontal scale intervals listed in the table below, use the Measure function of the oscilloscope and record Frequency of Channel 1. At each horizontal scale interval, observe the Frequency measurement for a few seconds and record the observable resolution of the measurement.
Expert Answer:


Contemporary Human Resource Management Text And Cases
ISBN: 9780273757825
4th Edition
Authors: Tom Redman, Adrian Wilkinson
