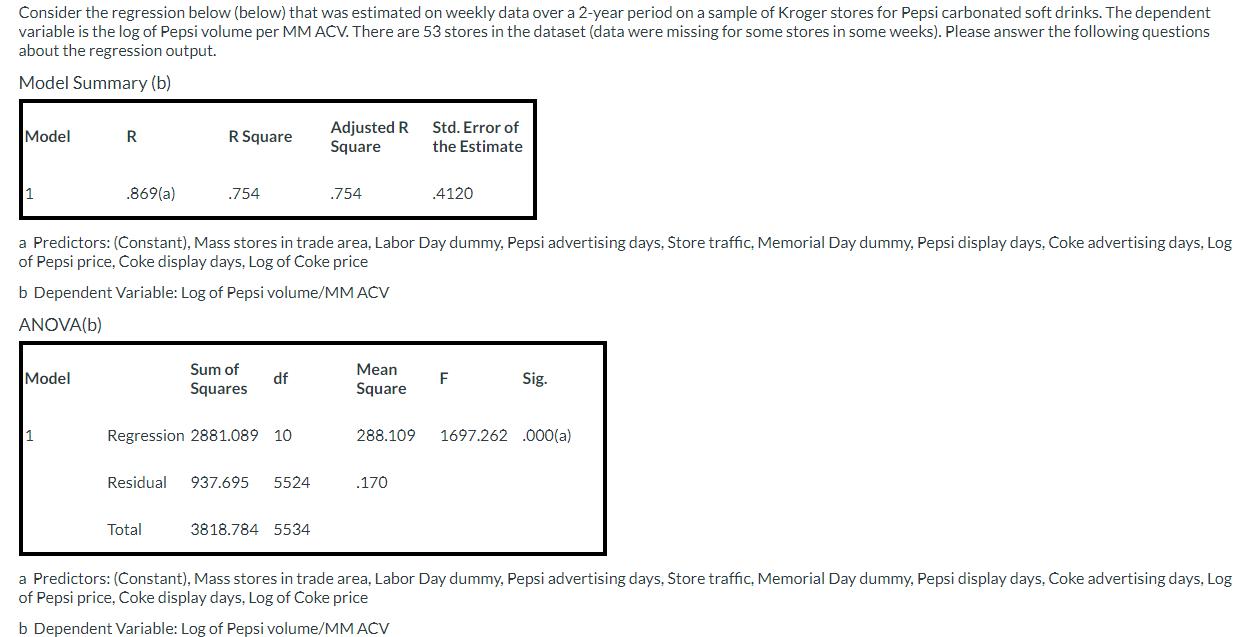
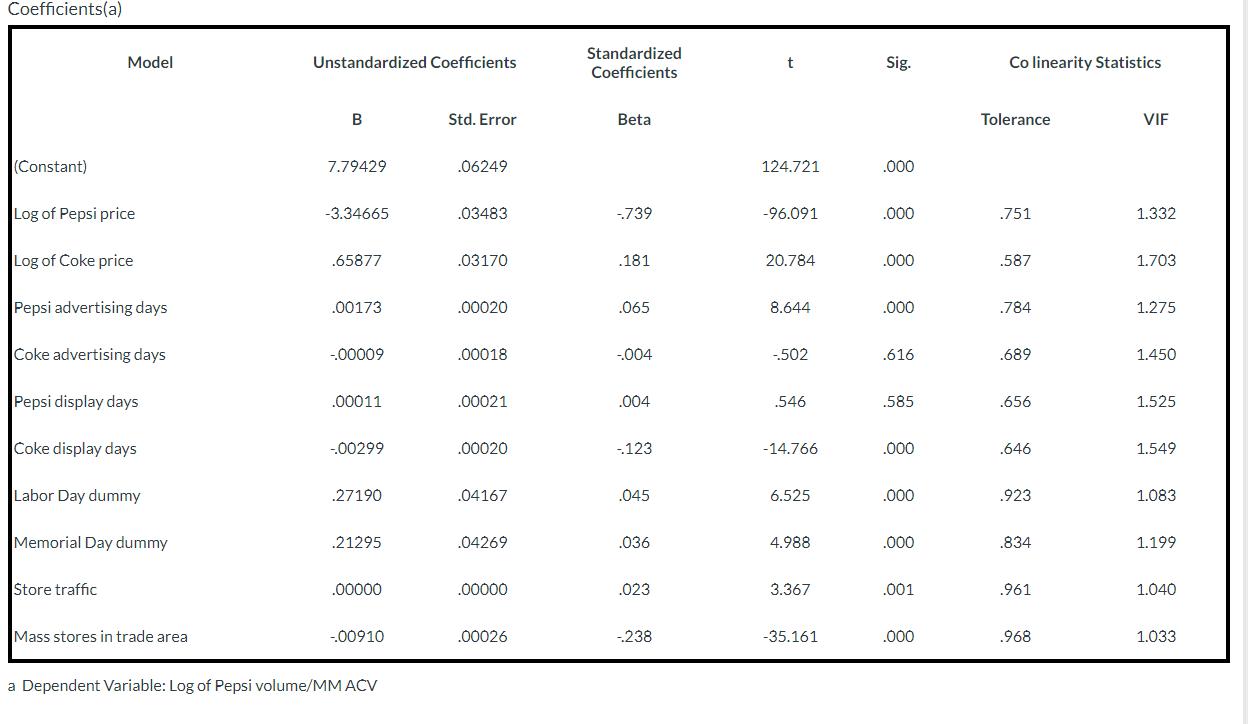
Consider the regression below (below) that was estimated on weekly data over a 2-year period on...
Fantastic news! We've Found the answer you've been seeking!
Question:
Transcribed Image Text:
Consider the regression below (below) that was estimated on weekly data over a 2-year period on a sample of Kroger stores for Pepsi carbonated soft drinks. The dependent variable is the log of Pepsi volume per MM ACV. There are 53 stores in the dataset (data were missing for some stores in some weeks). Please answer the following questions about the regression output. Model Summary (b) Model 1 Model R 1 .869(a) R Square .754 Sum of Squares Regression 2881.089 10 Total a Predictors: (Constant), Mass stores in trade area, Labor Day dummy, Pepsi advertising days, Store traffic, Memorial Day dummy, Pepsi display days, Coke advertising days, Log of Pepsi price, Coke display days, Log of Coke price b Dependent Variable: Log of Pepsi volume/MM ACV ANOVA(b) df Residual 937.695 5524 Adjusted R Square 3818.784 5534 .754 Mean Square Std. Error of the Estimate .4120 .170 F Sig. 288.109 1697.262 .000(a) a Predictors: (Constant), Mass stores in trade area, Labor Day dummy, Pepsi advertising days, Store traffic, Memorial Day dummy, Pepsi display days, Coke advertising days. Log of Pepsi price, Coke display days, Log of Coke price b Dependent Variable: Log of Pepsi volume/MM ACV Coefficients(a) (Constant) Model Log of Pepsi price Log of Coke price Pepsi advertising days Coke advertising days Pepsi display days Coke display days Labor Day dummy Memorial Day dummy Store traffic Mass stores in trade area Unstandardized Coefficients B 7.79429 -3.34665 .65877 .00173 -00009 ,00011 -00299 .27190 .21295 .00000 -00910 a Dependent Variable: Log of Pepsi volume/MM ACV Std. Error .06249 .03483 .03170 .00020 .00018 .00021 .00020 .04167 .04269 .00000 .00026 Standardized Coefficients Betal -.739 .181 .065 -.004 .004 -123 .045 .036 .023 -238 t 124.721 -96.091 20.784 8.644 -502 .546 -14.766 6.525 4.988 3.367 -35.161 Sig. .000 .000 .000 .000 .616 .585 .000 .000 .000 .001 .000 Co linearity Statistics Tolerance .751 .587 .784 .689 .656 .646 .923 .834 .961 .968 VIF 1.332 1.703 1.275 1.450 1.525 1.549 1.083 1.199 1.040 1.033 Questions (a) Comment on the goodness of fit and significance of the regression and of individual variables. What does the ANOVA table reveal? (b) Write out the equation and interpret the meaning of each of the parameters. (c) What is the price elasticity? The cross-price elasticity with respect to Coke price? Are these results reasonable? Explain. (d) What do the results tell you about the effectiveness of Pepsi and Coke display and advertising? (e) What are the 3 most important variables? Explain how you arrived at this conclusion. (f) What is collinearity? Is collinearity a problem for this regression? Explain. If it is a problem, what action would you take to deal with it? (g) What changes to this regression equation, if any, would you recommend? Explain Consider the regression below (below) that was estimated on weekly data over a 2-year period on a sample of Kroger stores for Pepsi carbonated soft drinks. The dependent variable is the log of Pepsi volume per MM ACV. There are 53 stores in the dataset (data were missing for some stores in some weeks). Please answer the following questions about the regression output. Model Summary (b) Model 1 Model R 1 .869(a) R Square .754 Sum of Squares Regression 2881.089 10 Total a Predictors: (Constant), Mass stores in trade area, Labor Day dummy, Pepsi advertising days, Store traffic, Memorial Day dummy, Pepsi display days, Coke advertising days, Log of Pepsi price, Coke display days, Log of Coke price b Dependent Variable: Log of Pepsi volume/MM ACV ANOVA(b) df Residual 937.695 5524 Adjusted R Square 3818.784 5534 .754 Mean Square Std. Error of the Estimate .4120 .170 F Sig. 288.109 1697.262 .000(a) a Predictors: (Constant), Mass stores in trade area, Labor Day dummy, Pepsi advertising days, Store traffic, Memorial Day dummy, Pepsi display days, Coke advertising days. Log of Pepsi price, Coke display days, Log of Coke price b Dependent Variable: Log of Pepsi volume/MM ACV Coefficients(a) (Constant) Model Log of Pepsi price Log of Coke price Pepsi advertising days Coke advertising days Pepsi display days Coke display days Labor Day dummy Memorial Day dummy Store traffic Mass stores in trade area Unstandardized Coefficients B 7.79429 -3.34665 .65877 .00173 -00009 ,00011 -00299 .27190 .21295 .00000 -00910 a Dependent Variable: Log of Pepsi volume/MM ACV Std. Error .06249 .03483 .03170 .00020 .00018 .00021 .00020 .04167 .04269 .00000 .00026 Standardized Coefficients Betal -.739 .181 .065 -.004 .004 -123 .045 .036 .023 -238 t 124.721 -96.091 20.784 8.644 -502 .546 -14.766 6.525 4.988 3.367 -35.161 Sig. .000 .000 .000 .000 .616 .585 .000 .000 .000 .001 .000 Co linearity Statistics Tolerance .751 .587 .784 .689 .656 .646 .923 .834 .961 .968 VIF 1.332 1.703 1.275 1.450 1.525 1.549 1.083 1.199 1.040 1.033 Questions (a) Comment on the goodness of fit and significance of the regression and of individual variables. What does the ANOVA table reveal? (b) Write out the equation and interpret the meaning of each of the parameters. (c) What is the price elasticity? The cross-price elasticity with respect to Coke price? Are these results reasonable? Explain. (d) What do the results tell you about the effectiveness of Pepsi and Coke display and advertising? (e) What are the 3 most important variables? Explain how you arrived at this conclusion. (f) What is collinearity? Is collinearity a problem for this regression? Explain. If it is a problem, what action would you take to deal with it? (g) What changes to this regression equation, if any, would you recommend? Explain
Expert Answer:
Answer rating: 100% (QA)
a With an Rsquared of 0754 the regression fits fairly well This suggests that 754 percent of the variance in the dependent variable can be explained by the predictor factors The regression model is si... View the full answer
Related Book For
Fundamentals of Cost Accounting
ISBN: 978-1259565403
5th edition
Authors: William Lanen, Shannon Anderson, Michael Maher
Posted Date:
Students also viewed these marketing questions
-
What are the opportunities that web sales offer the company? What challenges does this approach present? Identify at least two promotion tactics for the web site using Internet advertising techniques...
-
A regression analysis of data on n = 53 males considered the following variables: Y = SBPSL (estimated slope based on the straight-line regression of an individual's blood pressure over time) X1 =...
-
Salem Corporation designs and manufactures wind turbine power generating systems and sells them to private energy producers. Many of their sales are structured to allow their customers to pay for...
-
Match the phrase that follows with the term (a-e) it describes. estimates the number of units to be manufactured to meet sales and inventory levels integrated set of operating and financing budgets...
-
A heat transfer of 9.5 105 J is required to convert a block of ice at -15 C to water at 15 C. What was the mass of the block of ice?
-
On January 1, 2012, White Water issues $500,000 of 6% bonds, due in 20 years, with interest payable annually on December 31 each year. Required: Assuming the market interest rate on the issue date is...
-
A FedEx airplane costs $50 million and is expected to fly 500 million miles during its 10-year life. Residual value is expected to be zero because the plane was used when acquired. If the plane...
-
The financial statements for Fardy Limited are shown below: During the year, the company purchased a capital asset valued at $ 10,000; payment was made by issuing common shares. Additional capital...
-
How many dependents can be claimed by a married couple, ages 46 and 48, filing a joint return, who provided over half the support for their daughter, age 25, and grandson, age 2? The daughter had...
-
5 5 7 B 9 Problem Ithacor Training Inc. started as a single facility for job retraining in Ithaca, New York. The company recently expanded to a new, much larger, second facility in Cortland. The...
-
eGO would like to increase its US sales. Define, the management decision problem.
-
why is the inflow of cash from receiving dividends is considered an operating activity while the outflow of cash from paying dividends to stockholders is considered a financing activity. why aren't...
-
3. The springs (k25 lb/ft) are un- stretched when s = 0. The 50-lb weight is released from rest in the position s = 0. (a) (b) When the weight has fallen 1 ft, how much work has been done on it by...
-
what are the advantages of dual model as per ASC 8 4 2 leases . How is 8 4 2 dual model is better than IFRS 1 6
-
What ways does the unreliable narrator serve as a narrative device to challenge traditional notions of truth and reality in contemporary fiction ?
-
The requirements specify which entities and data are important to the business. Here are the requirements for this database. manager monitors employee data: e mployee name, salary, and addresses...
-
The main difference between job involvement and is that the former shows a positive attitude toward the job and the latter shows a positive attitude toward the organization. (a) organizational...
-
The figure shows a bolted lap joint that uses SAE grade 8 bolts. The members are made of cold-drawn AISI 1040 steel. Find the safe tensile shear load F that can be applied to this connection if the...
-
San Jose Company operates a Manufacturing Division and an Assembly Division. Both divisions are evaluated as profit centers. Assembly buys components from Manufacturing and assembles them for sale....
-
How does a value income statement differ from a gross margin income statement? From a contribution margin income statement?
-
A tornado struck the only manufacturing plant of Toledo Farm Implements (TFI) on June 1. All work-in-process inventory was destroyed, but a few records were salvaged from the wreckage and from the...
-
The transient part of the solution arises from a. forcing function b. initial conditions c. bounding conditions
-
Fill in the Blank. The response of a linear system under any periodic force can be found by ___________ appropriate harmonic responses.
-
Find the steady-state response of the hydraulic control valve shown in Fig. 4.4 (a) to the forcing functions obtained by replacing \(x(t)\) with \(F(t)\) and \(A\) with \(F_{0}\) in Figs. 1.115....
Beyond Marketing The Understanding Of Strategic Marketing 1st Edition - ISBN: B09ZQBPD6S - Free Book
Study smarter with the SolutionInn App