

construct a graph of the depth of the ocean floor, with oceandepth as the vertical axis and
No answer yet for this question.
Ask a Tutor
Question:
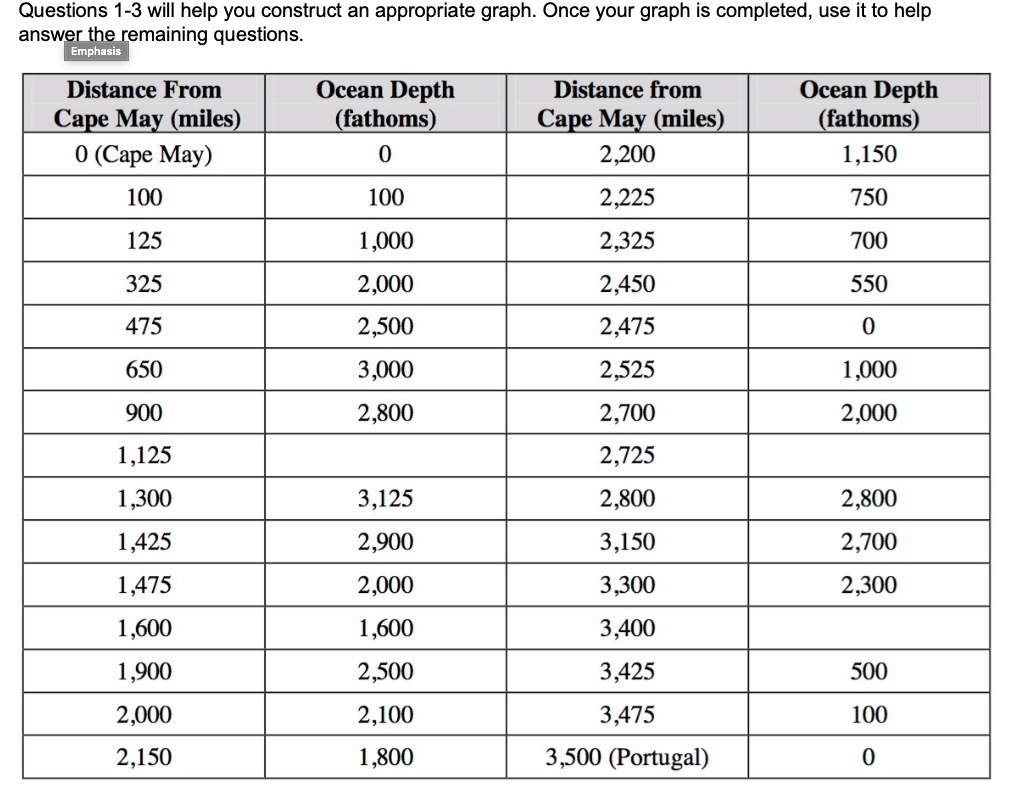
- construct a graph of the depth of the ocean floor, with oceandepth as the vertical axis and distance between New Jersey andPortugal as the horizontal axis. Do not connect the points on thegraph yet. Before making your graph, carefully consider whatintervals you will use for each axis and where sea level should belocated. Once you complete the graph, write a brief description ofit, in particular noting any significant changes in depth.
- Did you choose the same interval for both the vertical andhorizontal axes of your graph? Why or why not? What is the effectof your choice on the shape of the graph?
- The longest mountain range on Earth runs underwater, stretchingnearly 80,000 km through all of Earth’s oceans. In the AtlanticOcean, this mountain range is called the Mid-Atlantic Ridge. Locateand label this feature on your graph.
- (a) The Mariana Trench in the South Pacific is the deepestknown region of any ocean at about 36,200 feet. How much deeper isthis then the deepest point between New Jersey and Portugal?
- (b) Make a bar graph comparing the depth of the Mariana Trenchwith the height or depth of the following: Mt. Everest (29,035feet), the Grand Canyon (6,000 feet), and the Empire State Building(1,472 feet, including the TV antenna on top.) Use positive numbersfor all heights/depths.
- Oceanographers measure the depth of the deep ocean using sonar,a technology originally invented to detect submarines. Sonarequipment aboard a ship sends out sound waves, which bounce off theocean floor and return to the ship. The longer the time intervalfor the waves to return, the deeper is the ocean floor at thatpoint. Oceanographers use the formula: D = 1?2v *t, where D is theocean depth, v is the speed of sound in water (5,806 ft./sec), andt for the time interval in seconds between sending and receivingthe sound wave, to make this calculation. Use this formula tocomplete the following table of sonar data for two locations,rounding to the nearest 10 fathoms. Add the results to your graphand the table on the previous page. Then connect all the points onyour graph
Expert Answer:

Related Book For 

University Physics with Modern Physics
ISBN: 978-0321501219
12th Edition
Authors: Hugh D. Young, Roger A. Freedman, Lewis Ford
Posted Date:
