

Question: Construct a scatterplot for the given data.(5pts) x 0.33 0.92 | 0.36 | 0.29 | -0.09 | 0.97 | 0.39 0.3 y 0.5 0.49
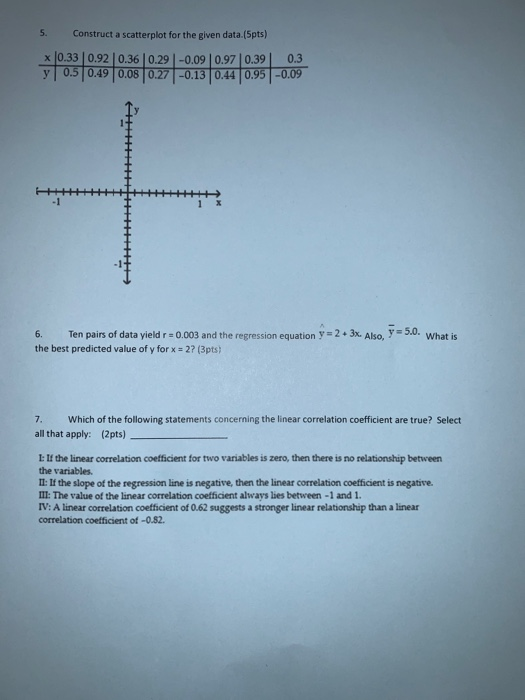
Construct a scatterplot for the given data.(5pts) x 0.33 0.92 | 0.36 | 0.29 | -0.09 | 0.97 | 0.39 0.3 y 0.5 0.49 0.08 0.27 -0.13 0.44 0.95 -0.09 5. -1 6. Ten pairs of data yield r = 0.003 and the regression equation y=2+ 3x. Also, y = 5.0. What is the best predicted value of y for x = 2? (3pts) 7. Which of the following statements concerning the linear correlation coefficient are true? Select all that apply: (2pts) I: If the linear correlation coefficient for two variables is zero, then there is no relationship between the variables. II: If the slope of the regression line is negative, then the linear correlation coefficient is negative. III: The value of the linear correlation coefficient always lies between -1 and 1. IV: A linear correlation coefficient of 0.62 suggests a stronger linear relationship than a linear correlation coefficient of -0.82.
Step by Step Solution
3.55 Rating (162 Votes )
There are 3 Steps involved in it
5 The scatter plot looks like this 100 075 050 025 000 ... View full answer

Get step-by-step solutions from verified subject matter experts