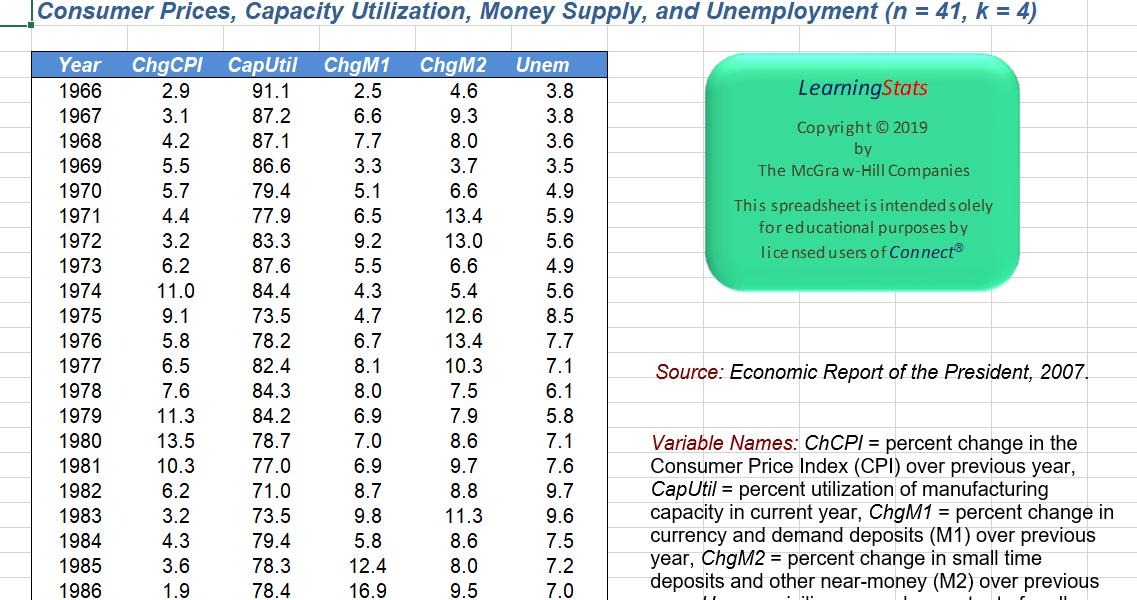
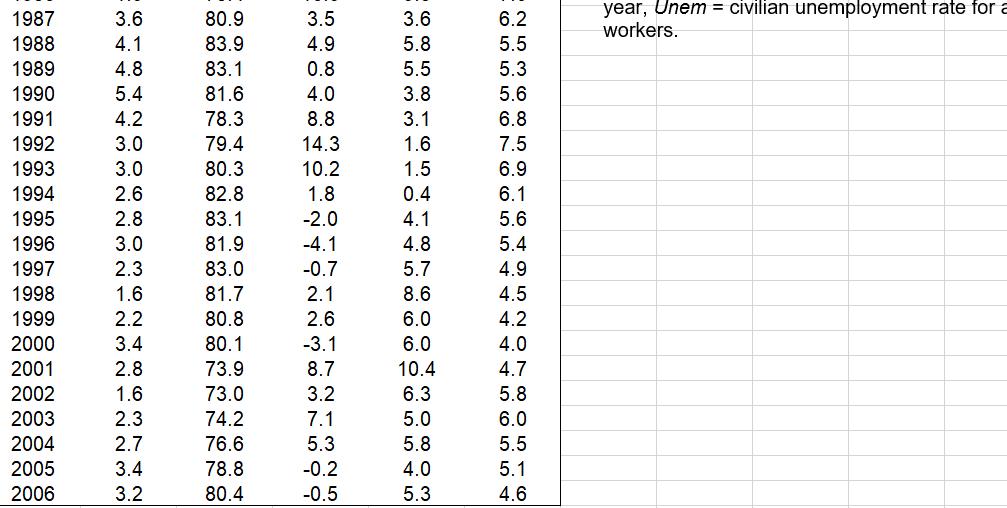
Consumer Prices, Capacity Utilization, Money Supply, and Unemployment (n = 41, k = 4) Year ChgCPI...
Fantastic news! We've Found the answer you've been seeking!
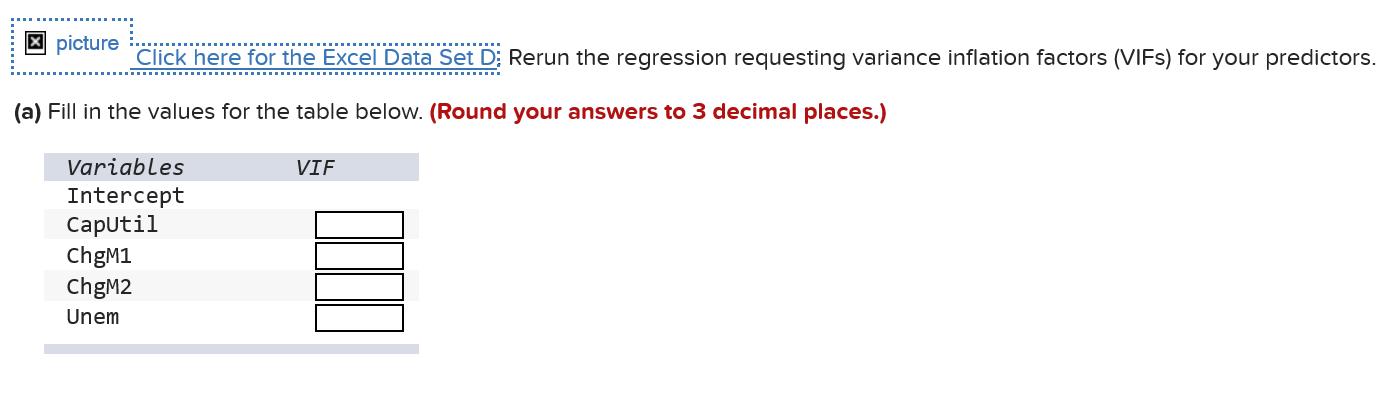
Question:
Transcribed Image Text:
Consumer Prices, Capacity Utilization, Money Supply, and Unemployment (n = 41, k = 4) Year ChgCPI CapUtil ChgM1 ChgM2 Unem 1966 2.9 91.1 2.5 4.6 3.8 LearningStats 1967 3.1 87.2 6.6 9.3 3.8 Copyright © 2019 by The McGra w-Hill Companies 1968 4.2 87.1 7.7 8.0 3.6 1969 5.5 86.6 3.3 3.7 3.5 1970 5.7 79.4 5.1 6.6 4.9 5.9 5.6 This spreadsheet is intended s olely foreducational purposes by 1971 4.4 77.9 6.5 13.4 83.3 87.6 1972 3.2 9.2 13.0 lice nsed u sers of Connect® 1973 6.2 5.5 6.6 4.9 1974 11.0 84.4 4.3 5.4 5.6 1975 9.1 73.5 4.7 12.6 8.5 1976 5.8 78.2 6.7 13.4 7.7 1977 6.5 82.4 8.1 10.3 7.1 Source: Economic Report of the President, 2007. 1978 7.6 84.3 8.0 7.5 6.1 1979 1980 5.8 7.1 11.3 84.2 6.9 7.9 Variable Names: CHCPI = percent change in the Consumer Price Index (CPI) over previous year, CapUtil = percent utilization of manufacturing capacity in current year, ChgM1 = percent change in currency and demand deposits (M1) over previous year, ChgM2 = percent change in small time deposits and other near-money (M2) over previous 13.5 78.7 7.0 8.6 1981 10.3 77.0 6.9 9.7 7.6 1982 6.2 71.0 8.7 8.8 9.7 1983 3.2 73.5 9.8 11.3 9.6 1984 4.3 79.4 5.8 8.6 7.5 1985 3.6 78.3 12.4 8.0 7.2 1986 1.9 78.4 16.9 9.5 7.0 . .. co co O LC co st o O O N o 00 c LO 7. LO CO 3o9 year, Unem = civilian unemployment rate for a workers. 1987 3.6 80.9 3.5 3.6 6.2 1988 4.1 83.9 4.9 5.8 5.5 1989 4.8 83.1 0.8 5.5 5.3 1990 5.4 81.6 4.0 3.8 5.6 1991 4.2 78.3 8.8 3.1 6.8 1992 3.0 79.4 14.3 1.6 7.5 1993 3.0 80.3 10.2 1.5 6.9 1994 2.6 82.8 1.8 0.4 6.1 1995 2.8 83.1 -2.0 4.1 5.6 1996 3.0 81.9 -4.1 4.8 5.4 1997 2.3 83.0 -0.7 5.7 4.9 1998 1.6 81.7 2.1 8.6 4.5 1999 2000 2.2 80.8 2.6 6.0 4.2 3.4 80.1 -3.1 6.0 4.0 2001 2.8 73.9 8.7 10.4 4.7 2002 1.6 73.0 3.2 6.3 5.8 2003 2.3 74.2 7.1 5.0 6.0 2004 2.7 76.6 5.3 5.8 5.5 2005 3.4 78.8 -0.2 4.0 5.1 2006 3.2 80.4 -0.5 5.3 4.6 5 cO N co cO 5 5 4 O 5 54. O LS O t st LO C LO LO mm M 750 O O 3 C O M 7 42 X picture Click here for the Excel Data Set D; Rerun the regression requesting variance inflation factors (VIFS) for your predictors. (a) Fill in the values for the table below. (Round your answers to 3 decimal places.) Variables VIF Intercept Caputil ChgM1 ChgM2 Unem Consumer Prices, Capacity Utilization, Money Supply, and Unemployment (n = 41, k = 4) Year ChgCPI CapUtil ChgM1 ChgM2 Unem 1966 2.9 91.1 2.5 4.6 3.8 LearningStats 1967 3.1 87.2 6.6 9.3 3.8 Copyright © 2019 by The McGra w-Hill Companies 1968 4.2 87.1 7.7 8.0 3.6 1969 5.5 86.6 3.3 3.7 3.5 1970 5.7 79.4 5.1 6.6 4.9 5.9 5.6 This spreadsheet is intended s olely foreducational purposes by 1971 4.4 77.9 6.5 13.4 83.3 87.6 1972 3.2 9.2 13.0 lice nsed u sers of Connect® 1973 6.2 5.5 6.6 4.9 1974 11.0 84.4 4.3 5.4 5.6 1975 9.1 73.5 4.7 12.6 8.5 1976 5.8 78.2 6.7 13.4 7.7 1977 6.5 82.4 8.1 10.3 7.1 Source: Economic Report of the President, 2007. 1978 7.6 84.3 8.0 7.5 6.1 1979 1980 5.8 7.1 11.3 84.2 6.9 7.9 Variable Names: CHCPI = percent change in the Consumer Price Index (CPI) over previous year, CapUtil = percent utilization of manufacturing capacity in current year, ChgM1 = percent change in currency and demand deposits (M1) over previous year, ChgM2 = percent change in small time deposits and other near-money (M2) over previous 13.5 78.7 7.0 8.6 1981 10.3 77.0 6.9 9.7 7.6 1982 6.2 71.0 8.7 8.8 9.7 1983 3.2 73.5 9.8 11.3 9.6 1984 4.3 79.4 5.8 8.6 7.5 1985 3.6 78.3 12.4 8.0 7.2 1986 1.9 78.4 16.9 9.5 7.0 . .. co co O LC co st o O O N o 00 c LO 7. LO CO 3o9 year, Unem = civilian unemployment rate for a workers. 1987 3.6 80.9 3.5 3.6 6.2 1988 4.1 83.9 4.9 5.8 5.5 1989 4.8 83.1 0.8 5.5 5.3 1990 5.4 81.6 4.0 3.8 5.6 1991 4.2 78.3 8.8 3.1 6.8 1992 3.0 79.4 14.3 1.6 7.5 1993 3.0 80.3 10.2 1.5 6.9 1994 2.6 82.8 1.8 0.4 6.1 1995 2.8 83.1 -2.0 4.1 5.6 1996 3.0 81.9 -4.1 4.8 5.4 1997 2.3 83.0 -0.7 5.7 4.9 1998 1.6 81.7 2.1 8.6 4.5 1999 2000 2.2 80.8 2.6 6.0 4.2 3.4 80.1 -3.1 6.0 4.0 2001 2.8 73.9 8.7 10.4 4.7 2002 1.6 73.0 3.2 6.3 5.8 2003 2.3 74.2 7.1 5.0 6.0 2004 2.7 76.6 5.3 5.8 5.5 2005 3.4 78.8 -0.2 4.0 5.1 2006 3.2 80.4 -0.5 5.3 4.6 5 cO N co cO 5 5 4 O 5 54. O LS O t st LO C LO LO mm M 750 O O 3 C O M 7 42 X picture Click here for the Excel Data Set D; Rerun the regression requesting variance inflation factors (VIFS) for your predictors. (a) Fill in the values for the table below. (Round your answers to 3 decimal places.) Variables VIF Intercept Caputil ChgM1 ChgM2 Unem
Expert Answer:
Answer rating: 100% (QA)
Use Excel Addin PhStat to fill in the table EXCEL PHSta... View the full answer
Related Book For
Statistics for Business and Economics
ISBN: 978-0134506593
13th edition
Authors: James T. McClave, P. George Benson, Terry Sincich
Posted Date:
Students also viewed these finance questions
-
Below is a partial balance sheet of WOU Berhad The company declared a 2 for 1 stock split. i) Calculate the new par value. ii) Calculate the new numbers of share outstanding. Common stock (RM 2)...
-
5 / 4 + 9 / 2x = 3 / 8 x 1 / 4
-
The composition T o S : U W of two linear transformations T : V W and S : U V is defined by Show that the composition transformation is also a linear transformation. (ToS)(i) = T(S(i)
-
This short exercise demonstrates the similarity and the difference between two ways to acquire plant assets. i (Click the icon to view the cases.) Compare the balances in all the accounts after...
-
Write polar equations to create each graph. For 3b and d, you'll need more than one equation. a. b. c. d. 90 180 270 90 180 0 270 180 152 270 90 180 270P
-
An orthopedic group practice has decided to develop a pediatric sports medicine program. Identify potential target markets for this new service. Describe the approach the group might take to assess...
-
Identify the most common kinds of divorce-related legal proceedings brought post-divorce.
-
The trial balance of The New Decors for the month ended September 30 is as follows: Data for the adjustments are as follows: a. Expired or used- up insurance, $ 425. b. Depreciation expense on...
-
Required: Prepare a process costing work sheet. Organic Fertilizer Inc manufactures fertilizer using a three stage composting system which improves the nutrient content in the soils and provide...
-
? ?? ? ? Assume that Alpha and Omega compete in the same four-digit SIC code industry and offer comparable products and services. The following table contains their reported financial performance and...
-
1. Which one(s) of the following matrices is (are) ill-conditioned? Why? [100 10-10] [00 10-10] [100 1010] [2 [10-1 Calculate the condition number of each matrix in 2-norm either by hand or using a...
-
Discuss the customer's role as a contributor to service quality and satisfaction. Describe a time when you played this role. Discuss the impact of this customer role on service firms. In your...
-
WORK the children are in high school and he will be 45 years old at that time. They have estimated that Sam and children would still need an income of $6000 per month after Mark's death. How much...
-
Crystal Limited manufactures photo frames. The photo frames are assembled in the Frame Division. The half-finished frames are then transferred to the Finishing Division, where the glass and other...
-
search box near the bottom of the screen. In the search box, instruct it to draft a contract between RJ Hunt, seller, and DJ March, buyer, for the sale of a house at 123 Jackson St., Macomb, IL...
-
Many whites and males believe there is "reverse discrimination" and, as a result, they receive fewer opportunities than minorities and women. Is this true? Why and Why not?
-
Green Marketing Legislation The European countries are way ahead of the United States in enforcing strict green marketing legislation (reducing packaging waste, recycling, etc. (read the short...
-
Suppose that you could invest in the following projects but have only $30,000 to invest. How would you make your decision and which projects would you invest in? Project Cost $ 8,000 11,000 9,000...
-
The editors of the Academy of Management Journal (April 2016) called for expanding management-related research of African countries by noting the diversity of the countries. They illustrated this...
-
Identity theft victims. According to The National Crime Victimization Survey (September 2015), published by the U.S. Department of Justice, about 17.6 million people were victims of identity theft...
-
The following sample data were collected on variables x and y: a. Specify the null and alternative hypotheses that should be used in conducting a hypothesis test to determine whether the variables x...
-
An analysis of the accounts of Beautiful Bottles Pty Ltd reveals the following manufacturing cost data for the month ended 30 June 2019. Required (a) Prepare the cost of goods manufactured schedule...
-
The following accounts and amounts (balances are normal balances) were taken from the records of Prider Manufacturers Ltd at 30 June 2019. Required (a) Prepare a cost of goods manufactured statement...
-
The following data were taken from the records of Manik Manufacturing Ltd for the year ended 30 June 2019. Required (a) Prepare the cost of goods manufactured schedule for the year ended 30 June...
Study smarter with the SolutionInn App