

Could anyone help me to type the code (Rstudio) ? Let X be a Possion(A) random variable.
Fantastic news! We've Found the answer you've been seeking!
Question:
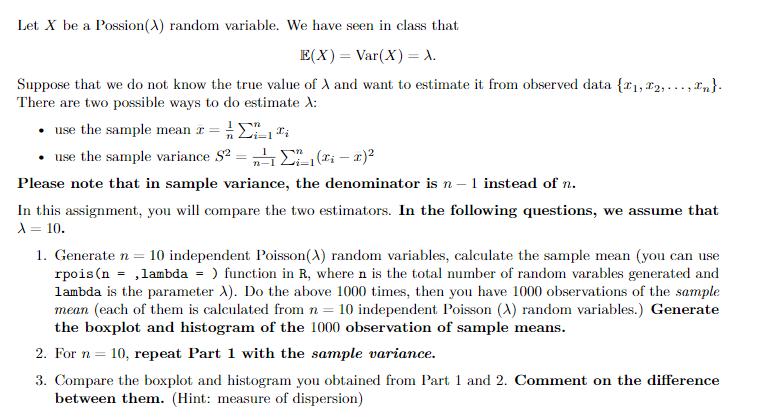
Could anyone help me to type the code (Rstudio) ?
Expert Answer:
Rcode For Analysis smeanrep01000 svariancerep01000 for j in 11000 genrpois10lambda 10 smeanjmeangen ... View the full answer

Related Book For 

Posted Date:
