

Question: Could I please get some help with the forms below? B D E M N 0 P Month Interest Investment Value 1 $0 $0 9
Could I please get some help with the forms below?
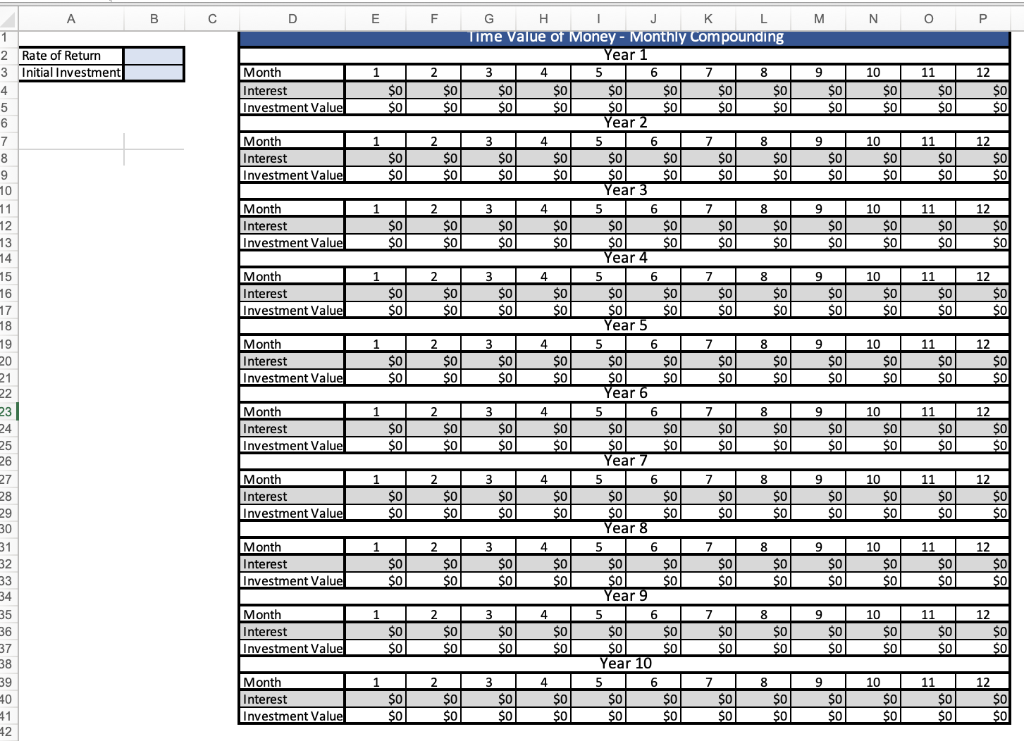
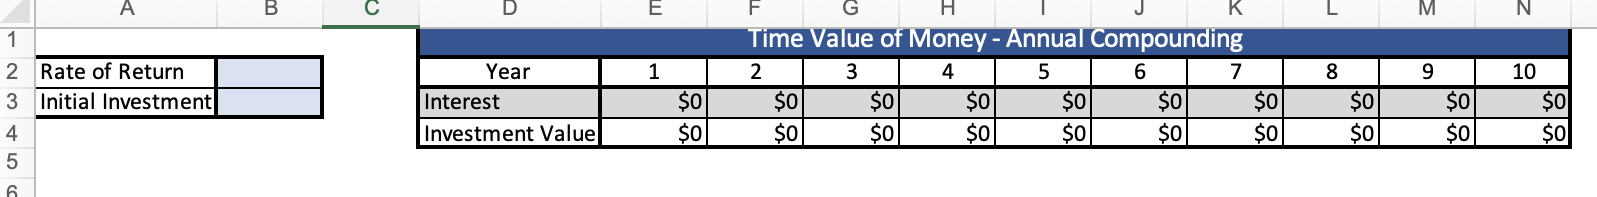
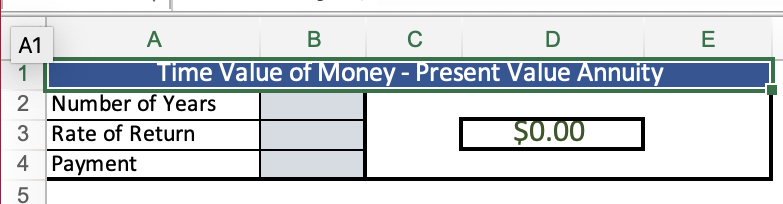
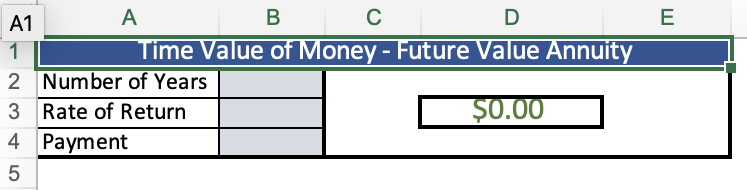
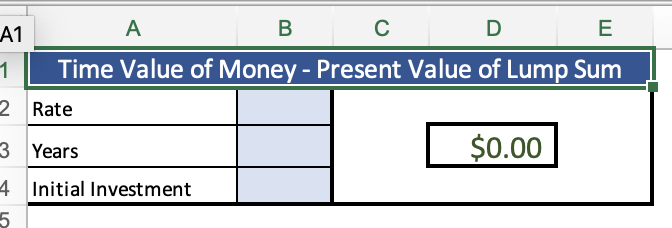
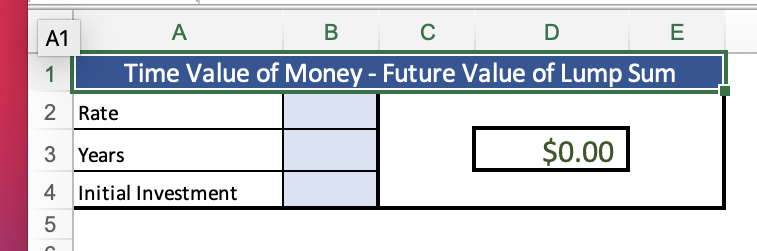
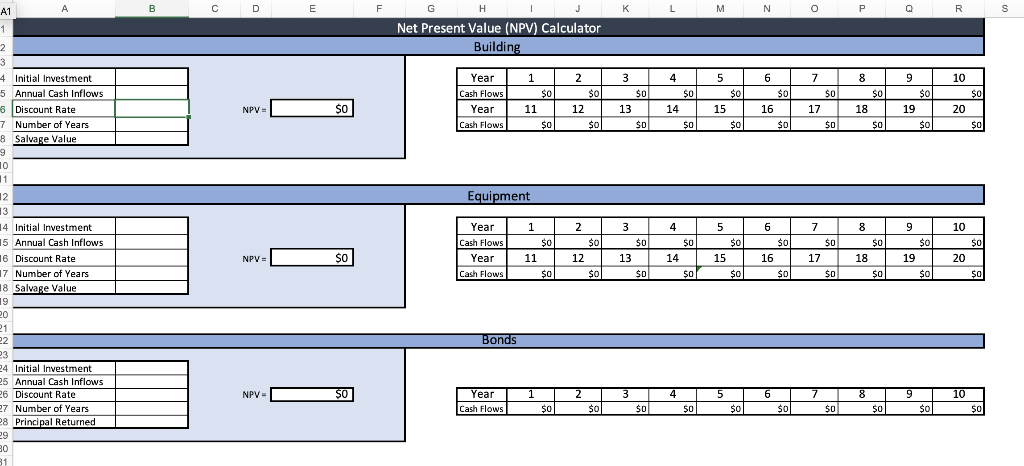
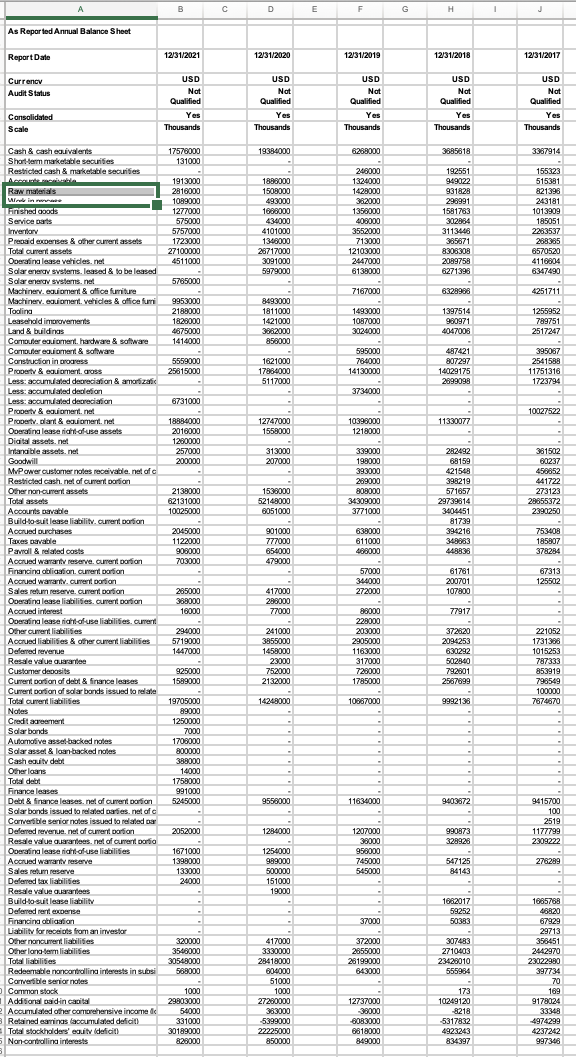
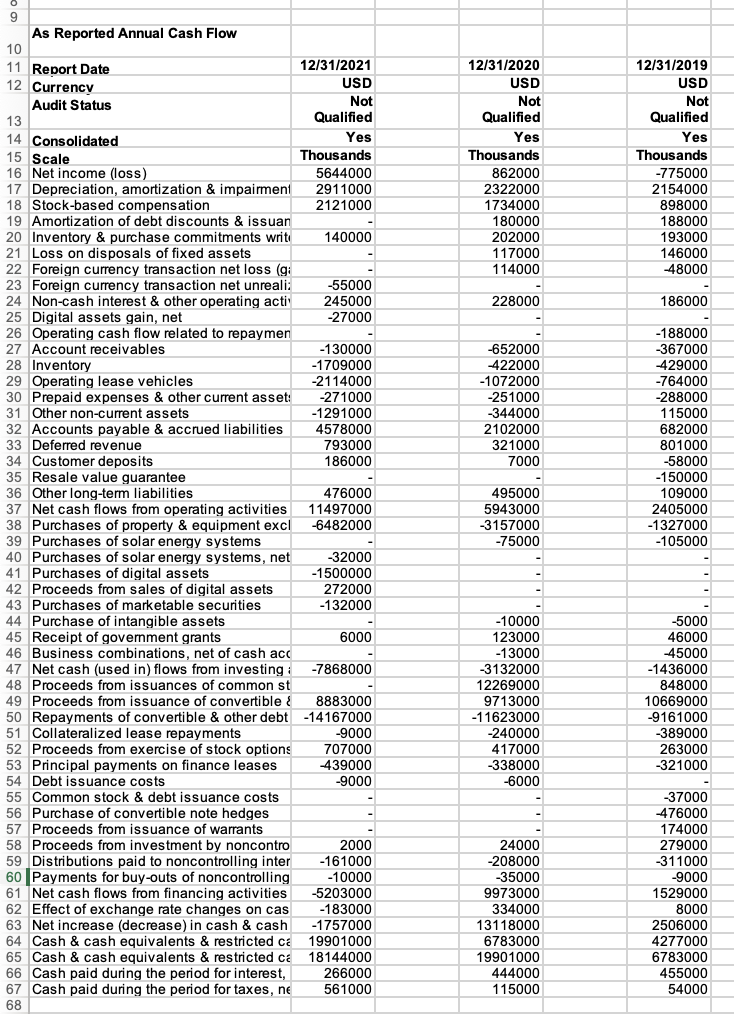
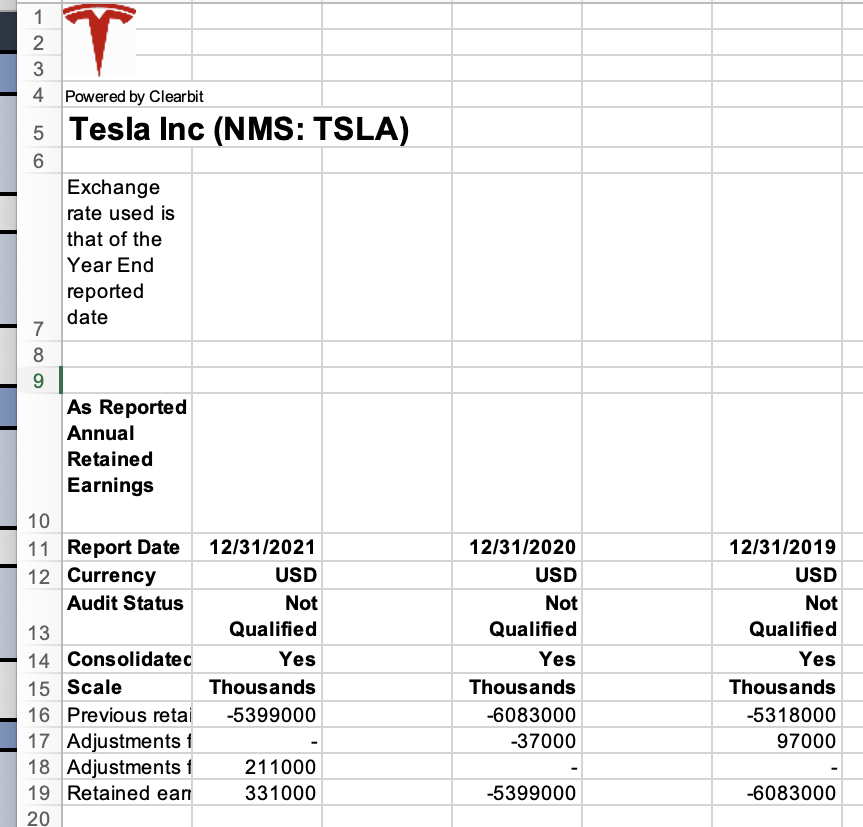
B D E M N 0 P Month Interest Investment Value 1 $0 $0 9 $0 $0 10 $0 $0 11 $0 $0 12 $0 $0 Month 1 9 Interest Investment Value $0 $0 $0 $0 10 $0 $0 11 $0 $0 12 $0 $0 1 9 9 Month Interest Investment Value $0 $0 $0 $0 10 $0 $0 $0 11 $0 $0 $ 12 $0 $0 Month Interest Investment Value 1 $0 $0 9 $0 $ol 10 $0 $0 11 $0 $0 12 $0 $0 A 1 2 Rate of Return 3 Initial Investment 4 5 6 7 8 9 10 11 12 13 14 15 16 17 18 19 20 21 22 231 24 25 26 27 28 29 30 31 32 33 34 35 36 37 38 39 40 41 42 Month Interest Investment Value 1 $0 0l $0 F G H 1 J K L L Time Value of Money - Monthly Compounding Year 1 2 3 4 5 6 7 8 $0 $0 0 $0 $0 $0 $0 $0 $0 $0 $0 $0 $ $0 SO $0 $0 Year 2 2 3 4 5 6 6 7 8 $0 $0 $0 $0 $0 $0 $0 $0 $0 $0 $0 $ $0 $0 $ $0 Year 3 2 3 4 5 6 7 8 $0 $0 $0 $0 $0 $0 $0 $0 $0 $0 $0 $0 $0 $0 Year 4 2 3 4 5 6 7 8 $0 $0 $0 0 so $0 $0 $0 $ol 0 $o $0 sol $ $0 $0 $0 Year 5 2 3 4 5 6 7 8 $0 $0 $0 $0 $0 $0 $0 $0 ol $0 $0 o $0 $0 $0 $o Year 6 2 3 4 5 6 7 8 $0 $0 $0 $0 $0 $0 $0 $0 $0 $0 $0 | $0 $0 $0 Year 7 2 3 4 5 6 7 7 8 8 $0 0 $0 0 $0 $0 $0 $0 $0 $0 $o $0 $0 $0 $0 $0 Year 8 2 3 4 5 7 7 8 $0 $0 $0 $0 SO $0 $0 $0 $0 $0 $01 $0 $0 $o Year 9 2 3 4 5 6 7 8 8 $0 $0 $0 0 $0 $0 $0 $0 $0 $0 $0 $0 $0 $0 $ $0 Year 10 2 2 3 4 4 5 6 7 8 $0 $0 $0 $0 $0 $0 $0 $ol $0 $0 $0l $0 $0 $0 9 $0 $0 10 $0 $0 11 $0 $0 12 $0 $0 9 Month Interest Investment Value 1 $0 $0 $o $0 10 $0 $0 11 $0 $0 12 $0 $0 1 Month Interest Investment Value $0 $0 9 9 $0 $0 10 $0 $0l 11 $0 $ol 12 $0 $0 Month Interest Investment Value 1 $0 $0 9 $0 0i $0 10 $0 $0 11 $0 $0l 12 $0 SO Month Interest Investment Value 1 $0 $0 9 $0 $0 10 $0 $0 11 $0 SO 12 $0 $0 12 Month Interest Investment Value $0 $ol 9 $0 $0 10 $0 $0 11 $0 $0 $0 $0 E M N 1 Year 1 F H Time Value of Money - Annual Compounding 2 3 4 5 6 7 $0 $0 $0 $0 $0 $0 $0 $0 $0 $0 $0 $0 00 9 2 Rate of Return 3 Initial Investment 10 Interest Investment Value $0 $0 8 $0 $0 1818 $0 $0 Oo @ $0 $0 4 5 6 E A1 A B D 1 Time Value of Money - Present Value Annuity 2 Number of Years 3 Rate of Return $0.00 4 Payment 5 E A1 A B D 1 Time Value of Money - Future Value Annuity 2 Number of Years 3 Rate of Return $0.00 4 Payment 5 A A1 B D E 1 Time Value of Money - Present Value of Lump Sum 2 Rate 3 Years $0.00 4. Initial Investment 5 A A1 B D E 1 Time Value of Money - Future Value of Lump Sum 2 Rate 3 Years $0.00 4 Initial Investment 5 A A1 B D E F G H J L M N o P Q R S 1 Net Present Value (NPV) Calculator Building 4 7 10 Year Cash Flows Year Cash Flows 1 1 $0 11 $0 2 2 $0 12 $0 3 $0 13 $0 14 5 $0 15 $0 6 $o 16 $0 8 $0 18 $0 $0 9 $0 19 $0 SO 17 $0 NPV = SO 20 $0 $D $0 $0 Equipment 1 4 8 10 $0 2 3 4 Initial Investment 5 Annual Cash Inflows 6 Discount Rate 7 Number of Years 8 Salvage Value 9 10 11 12 3 14 Initial Investment 15 Annual Cash Inflows 16 Discount Rate 17 Number of Years 18 Salvage Value 19 20 21 22 23 24 Initial Investment 25 Annual Cash Inflows 26 Discount Rate 27 Number of Years 28 Principal Returned 29 BO 31 Year Cash Flows Year Cash Flows 3 $0 13 $0 $0 11 $0 2 $0 12 0 $oll NPV = = 5 $0 15 $0 $0 6 $0 16 $0 $0 14 $0 7 $0 17 $0 $ $0 18 $0 9 $0 19 $0 20 $0 Bonds NPV- - 50 $ 2 3 6 8 9 10 Year Cash Flows 1 $0 4 50 5 $0 $0 $0 $0 $0 $0 $0 $0 As Reported Annual Balance Sheet Cash & cash aivalents Week in - TELETE THAT THE TIME TELE fiilit 15 Scale 12/31/2020 USD Not Qualified Yes Thousands 862000 2322000 1734000 180000 202000 117000 114000 12/31/2019 USD Not Qualified Yes Thousands -775000 2154000 898000 188000 193000 146000 48000 228000 186000 -652000 422000 -1072000 -251000 -344000 2102000 321000 7000 9 As Reported Annual Cash Flow 10 11 Report Date 12/31/2021 12 Currency USD Audit Status Not 13 Qualified 14 Consolidated Yes Thousands 16 Net income (oss) 5644000 17 Depreciation, amortization & impairment 2911000 18 Stock-based compensation 2121000 10 19 Amortization of debt discounts & issuan 20 Inventory & purchase commitments writy 140000 21 Loss on disposals of fixed assets 22 Foreign currency transaction net loss (g: 23 Foreign currency transaction net unreali: -55000 24 Non-cash interest & other operating acti 245000 - Natal -27000 26 Operating cash flow related to repaymen 25 Digitals gain, net 27 Account receivables -130000 26 A 28 Inventory -1709000 30 martin 29 Operating lease vehicles -2114000 30 Prepaid expenses & other current asset: -271000 31 Other non-current assets -1291000 were 32 Accounts payable & accrued liabilities 4578000 33 Deferred revenue 793000 34 Customer deposits 186000 35 Resale value guarantee 36 Other long-term liabilities 476000 37 Net cash flows from operating activities 11497000 38 Purchases of property & equipment excl -6482000 39 Purchases of solar energy systems 40 Purchases of solar energy systems, net -32000 41 Purchases of digital assets -1500000 22 Proceeds from sales of digital assets 42 272000 43 Purchases of marketable securities -132000 44 Purchase of intangible assets 45 Receipt of government and of government grants 6000 45 Receipt of 46 Business combinations, net of cash acc 47 Net cash (used in) flows from investing -7868000 48 Proceeds from issuances of common st issuance of convertible 8883000 of convertible & other debt -14167000 51 Collateralized lease lease repayments -9000 52 Proceeds from exerci of stock options 707000 53 Principal payments on finance leases 439000 54 Dent issuance cete 54 Debt issuance costs -9000 55 Common stock & debt issuance costs 56 Purchase of convertible note hedges 57 Proceeds from issuance of warrants 58 Proceeds from investment by noncontro 2000 59 Distributions paid to noncontrolling inter -161000 60 Payments for buy-outs of noncontrolling -10000 2000 61 Net cash flows from financing activities -5203000 62 Effect of exchange rate changes on cas -183000 63 Net increase (decrease) in cash & cash -1757000 64 Cash & cash equivalents & restricted ca 19901000 65 Cash & cash equivalents & restricted ca 18144000 66 Cash paid during the period for interest, 266000 67 Cash paid during the period for taxes, ne 561000 68 -188000 -367000 429000 -764000 -288000 2006 115000 100 682000 0400 801000 -58000 -150000 109000 2405000 -1327000 -105000 495000 5943000 -3157000 -75000 -10000 123000 -13000 -3132000 12269000 9713000 -11623000 -5000 46000 45000 -1436000 848000 10669000 -9161000 -389000 263000 49 Proceedte -240000 417000 -338000 -6000 -321000 o 24000 -208000 -35000 9973000 o 334000 13118000 6783000 19901000 444000 115000 -37000 -476000 174000 279000 -311000 -9000 1529000 2008 200 8000 2506000 4277000 6783000 455000 54000 AWN T 1 2 3 4 Powered by Clearbit 5 Tesla Inc (NMS: TSLA) 6 Exchange rate used is that of the Year End reported date 7 8 9 As Reported Annual Retained Earnings 10 11 Report Date 12/31/2021 12 Currency USD Audit Status Not Qualified 14 Consolidatec Yes 15 Scale Thousands 16 Previous retai -5399000 17 Adjustments 1 18 Adjustments i 211000 19 Retained eart 331000 20 13 12/31/2020 USD Not Qualified Yes Thousands -6083000 -37000 12/31/2019 USD Not Qualified Yes Thousands -5318000 97000 -5399000 -6083000 B D E M N 0 P Month Interest Investment Value 1 $0 $0 9 $0 $0 10 $0 $0 11 $0 $0 12 $0 $0 Month 1 9 Interest Investment Value $0 $0 $0 $0 10 $0 $0 11 $0 $0 12 $0 $0 1 9 9 Month Interest Investment Value $0 $0 $0 $0 10 $0 $0 $0 11 $0 $0 $ 12 $0 $0 Month Interest Investment Value 1 $0 $0 9 $0 $ol 10 $0 $0 11 $0 $0 12 $0 $0 A 1 2 Rate of Return 3 Initial Investment 4 5 6 7 8 9 10 11 12 13 14 15 16 17 18 19 20 21 22 231 24 25 26 27 28 29 30 31 32 33 34 35 36 37 38 39 40 41 42 Month Interest Investment Value 1 $0 0l $0 F G H 1 J K L L Time Value of Money - Monthly Compounding Year 1 2 3 4 5 6 7 8 $0 $0 0 $0 $0 $0 $0 $0 $0 $0 $0 $0 $ $0 SO $0 $0 Year 2 2 3 4 5 6 6 7 8 $0 $0 $0 $0 $0 $0 $0 $0 $0 $0 $0 $ $0 $0 $ $0 Year 3 2 3 4 5 6 7 8 $0 $0 $0 $0 $0 $0 $0 $0 $0 $0 $0 $0 $0 $0 Year 4 2 3 4 5 6 7 8 $0 $0 $0 0 so $0 $0 $0 $ol 0 $o $0 sol $ $0 $0 $0 Year 5 2 3 4 5 6 7 8 $0 $0 $0 $0 $0 $0 $0 $0 ol $0 $0 o $0 $0 $0 $o Year 6 2 3 4 5 6 7 8 $0 $0 $0 $0 $0 $0 $0 $0 $0 $0 $0 | $0 $0 $0 Year 7 2 3 4 5 6 7 7 8 8 $0 0 $0 0 $0 $0 $0 $0 $0 $0 $o $0 $0 $0 $0 $0 Year 8 2 3 4 5 7 7 8 $0 $0 $0 $0 SO $0 $0 $0 $0 $0 $01 $0 $0 $o Year 9 2 3 4 5 6 7 8 8 $0 $0 $0 0 $0 $0 $0 $0 $0 $0 $0 $0 $0 $0 $ $0 Year 10 2 2 3 4 4 5 6 7 8 $0 $0 $0 $0 $0 $0 $0 $ol $0 $0 $0l $0 $0 $0 9 $0 $0 10 $0 $0 11 $0 $0 12 $0 $0 9 Month Interest Investment Value 1 $0 $0 $o $0 10 $0 $0 11 $0 $0 12 $0 $0 1 Month Interest Investment Value $0 $0 9 9 $0 $0 10 $0 $0l 11 $0 $ol 12 $0 $0 Month Interest Investment Value 1 $0 $0 9 $0 0i $0 10 $0 $0 11 $0 $0l 12 $0 SO Month Interest Investment Value 1 $0 $0 9 $0 $0 10 $0 $0 11 $0 SO 12 $0 $0 12 Month Interest Investment Value $0 $ol 9 $0 $0 10 $0 $0 11 $0 $0 $0 $0 E M N 1 Year 1 F H Time Value of Money - Annual Compounding 2 3 4 5 6 7 $0 $0 $0 $0 $0 $0 $0 $0 $0 $0 $0 $0 00 9 2 Rate of Return 3 Initial Investment 10 Interest Investment Value $0 $0 8 $0 $0 1818 $0 $0 Oo @ $0 $0 4 5 6 E A1 A B D 1 Time Value of Money - Present Value Annuity 2 Number of Years 3 Rate of Return $0.00 4 Payment 5 E A1 A B D 1 Time Value of Money - Future Value Annuity 2 Number of Years 3 Rate of Return $0.00 4 Payment 5 A A1 B D E 1 Time Value of Money - Present Value of Lump Sum 2 Rate 3 Years $0.00 4. Initial Investment 5 A A1 B D E 1 Time Value of Money - Future Value of Lump Sum 2 Rate 3 Years $0.00 4 Initial Investment 5 A A1 B D E F G H J L M N o P Q R S 1 Net Present Value (NPV) Calculator Building 4 7 10 Year Cash Flows Year Cash Flows 1 1 $0 11 $0 2 2 $0 12 $0 3 $0 13 $0 14 5 $0 15 $0 6 $o 16 $0 8 $0 18 $0 $0 9 $0 19 $0 SO 17 $0 NPV = SO 20 $0 $D $0 $0 Equipment 1 4 8 10 $0 2 3 4 Initial Investment 5 Annual Cash Inflows 6 Discount Rate 7 Number of Years 8 Salvage Value 9 10 11 12 3 14 Initial Investment 15 Annual Cash Inflows 16 Discount Rate 17 Number of Years 18 Salvage Value 19 20 21 22 23 24 Initial Investment 25 Annual Cash Inflows 26 Discount Rate 27 Number of Years 28 Principal Returned 29 BO 31 Year Cash Flows Year Cash Flows 3 $0 13 $0 $0 11 $0 2 $0 12 0 $oll NPV = = 5 $0 15 $0 $0 6 $0 16 $0 $0 14 $0 7 $0 17 $0 $ $0 18 $0 9 $0 19 $0 20 $0 Bonds NPV- - 50 $ 2 3 6 8 9 10 Year Cash Flows 1 $0 4 50 5 $0 $0 $0 $0 $0 $0 $0 $0 As Reported Annual Balance Sheet Cash & cash aivalents Week in - TELETE THAT THE TIME TELE fiilit 15 Scale 12/31/2020 USD Not Qualified Yes Thousands 862000 2322000 1734000 180000 202000 117000 114000 12/31/2019 USD Not Qualified Yes Thousands -775000 2154000 898000 188000 193000 146000 48000 228000 186000 -652000 422000 -1072000 -251000 -344000 2102000 321000 7000 9 As Reported Annual Cash Flow 10 11 Report Date 12/31/2021 12 Currency USD Audit Status Not 13 Qualified 14 Consolidated Yes Thousands 16 Net income (oss) 5644000 17 Depreciation, amortization & impairment 2911000 18 Stock-based compensation 2121000 10 19 Amortization of debt discounts & issuan 20 Inventory & purchase commitments writy 140000 21 Loss on disposals of fixed assets 22 Foreign currency transaction net loss (g: 23 Foreign currency transaction net unreali: -55000 24 Non-cash interest & other operating acti 245000 - Natal -27000 26 Operating cash flow related to repaymen 25 Digitals gain, net 27 Account receivables -130000 26 A 28 Inventory -1709000 30 martin 29 Operating lease vehicles -2114000 30 Prepaid expenses & other current asset: -271000 31 Other non-current assets -1291000 were 32 Accounts payable & accrued liabilities 4578000 33 Deferred revenue 793000 34 Customer deposits 186000 35 Resale value guarantee 36 Other long-term liabilities 476000 37 Net cash flows from operating activities 11497000 38 Purchases of property & equipment excl -6482000 39 Purchases of solar energy systems 40 Purchases of solar energy systems, net -32000 41 Purchases of digital assets -1500000 22 Proceeds from sales of digital assets 42 272000 43 Purchases of marketable securities -132000 44 Purchase of intangible assets 45 Receipt of government and of government grants 6000 45 Receipt of 46 Business combinations, net of cash acc 47 Net cash (used in) flows from investing -7868000 48 Proceeds from issuances of common st issuance of convertible 8883000 of convertible & other debt -14167000 51 Collateralized lease lease repayments -9000 52 Proceeds from exerci of stock options 707000 53 Principal payments on finance leases 439000 54 Dent issuance cete 54 Debt issuance costs -9000 55 Common stock & debt issuance costs 56 Purchase of convertible note hedges 57 Proceeds from issuance of warrants 58 Proceeds from investment by noncontro 2000 59 Distributions paid to noncontrolling inter -161000 60 Payments for buy-outs of noncontrolling -10000 2000 61 Net cash flows from financing activities -5203000 62 Effect of exchange rate changes on cas -183000 63 Net increase (decrease) in cash & cash -1757000 64 Cash & cash equivalents & restricted ca 19901000 65 Cash & cash equivalents & restricted ca 18144000 66 Cash paid during the period for interest, 266000 67 Cash paid during the period for taxes, ne 561000 68 -188000 -367000 429000 -764000 -288000 2006 115000 100 682000 0400 801000 -58000 -150000 109000 2405000 -1327000 -105000 495000 5943000 -3157000 -75000 -10000 123000 -13000 -3132000 12269000 9713000 -11623000 -5000 46000 45000 -1436000 848000 10669000 -9161000 -389000 263000 49 Proceedte -240000 417000 -338000 -6000 -321000 o 24000 -208000 -35000 9973000 o 334000 13118000 6783000 19901000 444000 115000 -37000 -476000 174000 279000 -311000 -9000 1529000 2008 200 8000 2506000 4277000 6783000 455000 54000 AWN T 1 2 3 4 Powered by Clearbit 5 Tesla Inc (NMS: TSLA) 6 Exchange rate used is that of the Year End reported date 7 8 9 As Reported Annual Retained Earnings 10 11 Report Date 12/31/2021 12 Currency USD Audit Status Not Qualified 14 Consolidatec Yes 15 Scale Thousands 16 Previous retai -5399000 17 Adjustments 1 18 Adjustments i 211000 19 Retained eart 331000 20 13 12/31/2020 USD Not Qualified Yes Thousands -6083000 -37000 12/31/2019 USD Not Qualified Yes Thousands -5318000 97000 -5399000 -6083000
Step by Step Solution
There are 3 Steps involved in it

Get step-by-step solutions from verified subject matter experts