

count 15- 10 5- Midwest Private 20000 30000 40000 TuitionFees count 5- 15 Northeast Private 10000...
Fantastic news! We've Found the answer you've been seeking!
Question:


Transcribed Image Text:
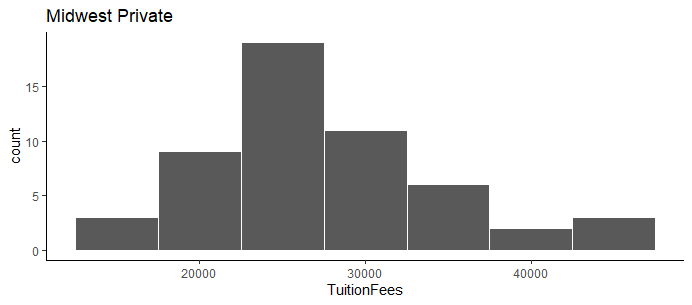
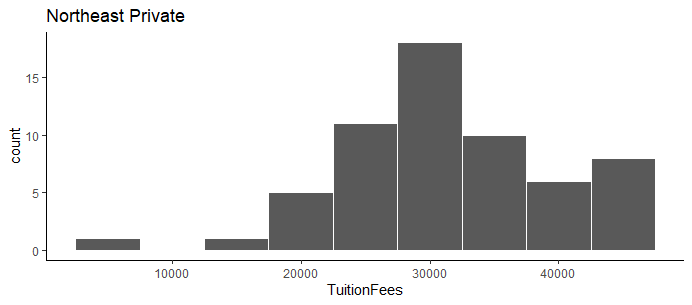
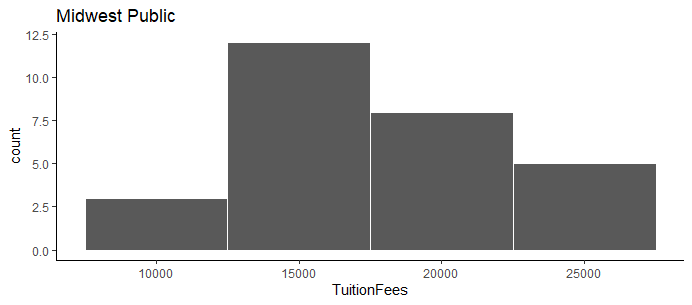
count 15- 10 5- Midwest Private 20000 30000 40000 TuitionFees count 5- 15 Northeast Private 10000 20000 30000 40000 TuitionFees count 12.51 10.0- 7.5- 5.0 2.5- 0.0 Midwest Public 10000 15000 20000 25000 TuitionFees count 5- 15 South Private 0 10000 20000 TuitionFees 30000 40000 count 15- 10 5 South Public 10000 TuitionFees 20000 30000 count 10 Northeast Public L 10000 20000 TuitionFees count 2 West Public 10000 15000 20000 TuitionFees 25000 30000 count 2 West Private 20000 30000 TuitionFees 40000 Tuition Fees 40000 30000 20000 10000 0 Tuition Fees Boxplot by Public/Private and Region Midwest Northeast South West BroadReg Public/Private Private Public score 80- 60- 40- 20 100 minutes 200 300 score 40 80- 60- 20 25 50 75 100 125 bill score 80- 60- 40 20 20 business 40 60 score 80- 60- 40- 20- 1 2 los 3 4 score 40 20 80- 60 40 50 60 income 70 80 90 Chi-Square Quantile 05 10 15 Adjusted Chi-Square Q-Q Plot Outliers (n=8) Non-outliers (n=142) 2 htile: 13.385 0 5 10 15 20 Robust Squared Mahalanobis Distance minutes minutes bill 1.0000000 0.5010116 business los income score 0.3513851 bill 0.5010116 1.0000000 0.23868602 0.3235762 0.4703984 0.28805312 0.1773513 0.28424393 0.51303730 business los 0.3513851 0.4703984 0.2386860 0.2880531 1.0000000 0.29819519 0.2252796 0.10007947 0.2981952 1.00000000 0.2509573 -0.04621609 income 0.3235762 0.1773513 0.2252796 0.25095732 1.0000000 0.24643473 score 0.5130373 0.2842439 0.1000795 -0.04621609 0.2464347 1.00000000 Residuals 0 -20 20 Residuals vs Fitted 10 011 o 128 000 98 25 30 35 40 45 50 55 - Fitted values Im(score minutes + bill + business +los+ income) Standardized residuals -202 Normal Q-Q 10 00001217.. -2 -101 Theoretical Quantiles 2 Im(score minutes + bill + business +los+ income) - Standardized residuals -202 Residuals vs Leverage 01 Cook's distances 0.00 0.04 0.08 0.12 - Leverage Im(score minutes + bill + business + los + income) bill business los income > vif(regA11) minutes 1.465837 1.567419 1.370593 1.175322 1.169937 > | Call: 1m(formula = score ~ minutes + bill + business + los + income, data = Cellb) Residuals: Min 1Q Median Coefficients: 3Q Max 29.2979 -21.5821 -6.3496 -0.7444 5.4398 Estimate Std. Error t value Pr(>|t|) (Intercept) 21.93097 5.72754 3.829 0.000196 *** minutes 0.13037 0.02269 5.747 5.71e-08 *** bill 0.06971 0.05222 1.335 0.184114 business -0.12470 0.10398 -1.199 0.232520 los -4.20744 1.58799 -2.650 0.009015 ** income 0.15070 0.08257 1.825 0.070162 Signif. codes: 0 '**** 0.001 **** 0.01 ** 0.05 '.' 0.1 ' 1 Residual standard error: 9.772 on 136 degrees of freedom Multiple R-squared: 0.3199, Adjusted R-squared: 0.2949 F-statistic: 12.79 on 5 and 136 DF, p-value: 3.391e-10 > FacAOVTution Fees summary(FacAOVTution Fees) BroadReg PubPriv BroadReg: PubPriv Residuals Df 3 3.100e+09 1.033+09 1 6.469e+09 6.469e+09 3 1.443e+09 4.811e+08 296 1.390e+10 4.697e+07 Sum Sq Mean Sq F value Pr(>F) BroadReg*PubPriv) 22.00 6.91e-13 *** 137.71 <2e-16 *** 10.24 1.95e-06 *** Signif. codes: 0 **** 0.001 **** 0.01 0.05 0.1 '1 > followups PubPriv = Private: BroadReg emmean SE df lower.CL upper.CL Midwest 941 296 Northeast 31570 885 296 27360 25508 29213 29828 33311 South 21643 900 296 19872 23414 West 34003 1713 296 30631 37375 PubPriv Public: BroadReg emmean SE df lower.CL upper.CL Midwest 17836 1295 296 15287 20385 Northeast 17258 1399 296 14505 20011 South 17150 989 296 15203 19097 > pairs(followups) PubPriv Private: contrast West 17634 1662 296 14362 20905 Midwest Northeast Midwest South Midwest West Northeast South Northeast West South - West estimate SE df t.ratio p.value -4209 1292 296 -3.258 0.0068 5718 1302 296 4.390 0.0001 -6643 1955 296 -3.398 0.0043 9927 1262 296 7.866 Call: 1m (formula = score ~ minutes los, data = Cellb) Residuals: Min 1Q Median -26.5236 -6.0120 -0.8028 5.8238 3Q Max 29.3942 Estimate Std. Error t value Pr(>|t|) Coefficients: (Intercept) 27.56922 minutes 0.14725 los -3.70476 Signif. codes: 4.56905 6.034 1.37e-08 *** 0.01945 1.52079 7.569 4.71e-12 *** -2.436 0.0161 * " 0 ***** 0.001 **** 0.01 *** 0.05 '.' 0.1' 1 Residual standard error: 9.852 on 139 degrees of freedom Multiple R-squared: 0.2934, Adjusted R-squared: 0.2832 F-statistic: 28.85 on 2 and 139 DF, p-value: 3.301e-11 = (los 2, minutes = 125) > predict(finalCellreg, 13, interval="confid") fit 1wr upr 1 38.566 35.85858 41.27342 > predict(final cellreg, 13, interval="predict") fit lwr upr 1 38.566 18.89943 58.23257 (los 1.5, minutes = 250) = > predict(final cellreg, 12, interval="confid") fit 1wr upr 1 58.82468 53.01167 64.63769 > predict(final cellreg, 12, interval="predict") fit 1wr upr 1 58.82468 38.4965 79.15286 count 15- 10 5- Midwest Private 20000 30000 40000 TuitionFees count 5- 15 Northeast Private 10000 20000 30000 40000 TuitionFees count 12.51 10.0- 7.5- 5.0 2.5- 0.0 Midwest Public 10000 15000 20000 25000 TuitionFees count 5- 15 South Private 0 10000 20000 TuitionFees 30000 40000 count 15- 10 5 South Public 10000 TuitionFees 20000 30000 count 10 Northeast Public L 10000 20000 TuitionFees count 2 West Public 10000 15000 20000 TuitionFees 25000 30000 count 2 West Private 20000 30000 TuitionFees 40000 Tuition Fees 40000 30000 20000 10000 0 Tuition Fees Boxplot by Public/Private and Region Midwest Northeast South West BroadReg Public/Private Private Public score 80- 60- 40- 20 100 minutes 200 300 score 40 80- 60- 20 25 50 75 100 125 bill score 80- 60- 40 20 20 business 40 60 score 80- 60- 40- 20- 1 2 los 3 4 score 40 20 80- 60 40 50 60 income 70 80 90 Chi-Square Quantile 05 10 15 Adjusted Chi-Square Q-Q Plot Outliers (n=8) Non-outliers (n=142) 2 htile: 13.385 0 5 10 15 20 Robust Squared Mahalanobis Distance minutes minutes bill 1.0000000 0.5010116 business los income score 0.3513851 bill 0.5010116 1.0000000 0.23868602 0.3235762 0.4703984 0.28805312 0.1773513 0.28424393 0.51303730 business los 0.3513851 0.4703984 0.2386860 0.2880531 1.0000000 0.29819519 0.2252796 0.10007947 0.2981952 1.00000000 0.2509573 -0.04621609 income 0.3235762 0.1773513 0.2252796 0.25095732 1.0000000 0.24643473 score 0.5130373 0.2842439 0.1000795 -0.04621609 0.2464347 1.00000000 Residuals 0 -20 20 Residuals vs Fitted 10 011 o 128 000 98 25 30 35 40 45 50 55 - Fitted values Im(score minutes + bill + business +los+ income) Standardized residuals -202 Normal Q-Q 10 00001217.. -2 -101 Theoretical Quantiles 2 Im(score minutes + bill + business +los+ income) - Standardized residuals -202 Residuals vs Leverage 01 Cook's distances 0.00 0.04 0.08 0.12 - Leverage Im(score minutes + bill + business + los + income) bill business los income > vif(regA11) minutes 1.465837 1.567419 1.370593 1.175322 1.169937 > | Call: 1m(formula = score ~ minutes + bill + business + los + income, data = Cellb) Residuals: Min 1Q Median Coefficients: 3Q Max 29.2979 -21.5821 -6.3496 -0.7444 5.4398 Estimate Std. Error t value Pr(>|t|) (Intercept) 21.93097 5.72754 3.829 0.000196 *** minutes 0.13037 0.02269 5.747 5.71e-08 *** bill 0.06971 0.05222 1.335 0.184114 business -0.12470 0.10398 -1.199 0.232520 los -4.20744 1.58799 -2.650 0.009015 ** income 0.15070 0.08257 1.825 0.070162 Signif. codes: 0 '**** 0.001 **** 0.01 ** 0.05 '.' 0.1 ' 1 Residual standard error: 9.772 on 136 degrees of freedom Multiple R-squared: 0.3199, Adjusted R-squared: 0.2949 F-statistic: 12.79 on 5 and 136 DF, p-value: 3.391e-10 > FacAOVTution Fees summary(FacAOVTution Fees) BroadReg PubPriv BroadReg: PubPriv Residuals Df 3 3.100e+09 1.033+09 1 6.469e+09 6.469e+09 3 1.443e+09 4.811e+08 296 1.390e+10 4.697e+07 Sum Sq Mean Sq F value Pr(>F) BroadReg*PubPriv) 22.00 6.91e-13 *** 137.71 <2e-16 *** 10.24 1.95e-06 *** Signif. codes: 0 **** 0.001 **** 0.01 0.05 0.1 '1 > followups PubPriv = Private: BroadReg emmean SE df lower.CL upper.CL Midwest 941 296 Northeast 31570 885 296 27360 25508 29213 29828 33311 South 21643 900 296 19872 23414 West 34003 1713 296 30631 37375 PubPriv Public: BroadReg emmean SE df lower.CL upper.CL Midwest 17836 1295 296 15287 20385 Northeast 17258 1399 296 14505 20011 South 17150 989 296 15203 19097 > pairs(followups) PubPriv Private: contrast West 17634 1662 296 14362 20905 Midwest Northeast Midwest South Midwest West Northeast South Northeast West South - West estimate SE df t.ratio p.value -4209 1292 296 -3.258 0.0068 5718 1302 296 4.390 0.0001 -6643 1955 296 -3.398 0.0043 9927 1262 296 7.866 Call: 1m (formula = score ~ minutes los, data = Cellb) Residuals: Min 1Q Median -26.5236 -6.0120 -0.8028 5.8238 3Q Max 29.3942 Estimate Std. Error t value Pr(>|t|) Coefficients: (Intercept) 27.56922 minutes 0.14725 los -3.70476 Signif. codes: 4.56905 6.034 1.37e-08 *** 0.01945 1.52079 7.569 4.71e-12 *** -2.436 0.0161 * " 0 ***** 0.001 **** 0.01 *** 0.05 '.' 0.1' 1 Residual standard error: 9.852 on 139 degrees of freedom Multiple R-squared: 0.2934, Adjusted R-squared: 0.2832 F-statistic: 28.85 on 2 and 139 DF, p-value: 3.301e-11 = (los 2, minutes = 125) > predict(finalCellreg, 13, interval="confid") fit 1wr upr 1 38.566 35.85858 41.27342 > predict(final cellreg, 13, interval="predict") fit lwr upr 1 38.566 18.89943 58.23257 (los 1.5, minutes = 250) = > predict(final cellreg, 12, interval="confid") fit 1wr upr 1 58.82468 53.01167 64.63769 > predict(final cellreg, 12, interval="predict") fit 1wr upr 1 58.82468 38.4965 79.15286
Expert Answer:

Posted Date:
Students also viewed these mathematics questions
-
To load and register a driver, creating a new instance of the Driver class method is better than using the Class.forName() method. (True/False)
-
Take a process that you encounter on a daily basis, such as the lunch cafeteria or the journey from your home to school/work, and identify the bottlenecks that limit the throughput of this process.
-
What were the red flags that suggested the bookkeeper was living beyond her means?
-
Stafford Company received a 150 day, eight percent note for \(\$ 15,000\) on December 1 . What adjusting entry is needed to accrue the interest due on December 31?
-
Bonds issued by the Coleman Manufacturing Company have a par value of $1,000, which of course is also the amount of principal to be paid at maturity. The bonds are currently selling for $690. They...
-
Trini Company set the following standard costs per unit for its single product Direct materials (30 pounds @ $4.00 per pound) Direct labor (7 hours @ $14 per hour) Variable overhead (7 hours @ $7 per...
-
Hi - Tech Computers leased cloud - computing server racks to RAND Company for five years. Hi Tech manufactured the server racks for $ 1 0 0 , 0 0 0 . The racks have a sales amount of $ 1 3 0 , 0 0 0...
-
Part E Let V = -6.0 +8.5 and 1 V = 4.5 + 4.4 . Determine the magnitude of V1+V2. Express your answer using two significant figures. |1+V2|= Submit Request Answer Part F Determine the direction of...
-
Larkspur Express reports the following costs and expenses in June 2022 for its delivery service. Indirect materials used $8,110 Drivers' salaries $20,160 Depreciation on delivery equipment 14,020...
-
On January 1, 2025, Sunland Company leased equipment to Carla Vista Corporation. The following information pertains to this lease. 1. The term of the non-cancelable lease is 6 years. At the end of...
-
4. Prepare the following entries: A. Co X made a Sale to an affiliate (Z) for goods $50,000 at a cost of $32,000. Co Z received the inventory. Co Z did not sell the inventory at the end of the...
-
tes On January 1, 2024, Rick's Pawn Shop leased a truck from Corey Motors for a six-year period with an option to extend the lease for three years. Rick's had no significant economic incentive as of...
-
One of our products is a public-facing web and mobile application which allows publishers to set up their own video ad campaigns. The following outlines a new feature thats been added after the...
-
What are the principal alloying elements in SAE 4340 steel?

Study smarter with the SolutionInn App