

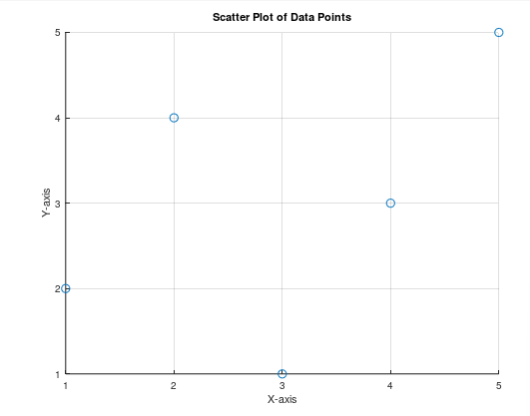
Create a MATLAB script that generates a scatter plot for the given data points and labels the
No answer yet for this question.
Ask a Tutor
Question:
Create a MATLAB script that generates a scatter plot for the given data points and labels the axes appropriately.
x
y
The data points are provided in the vectors x and y Ensure that the plot has a title and the axes are labeled.
Expert Answer:

Related Book For 

Practicing Statistics Guided Investigations For The Second Course
ISBN: 9780321586018
1st Edition
Authors: Shonda Kuiper, Jeff Sklar
Posted Date:
