

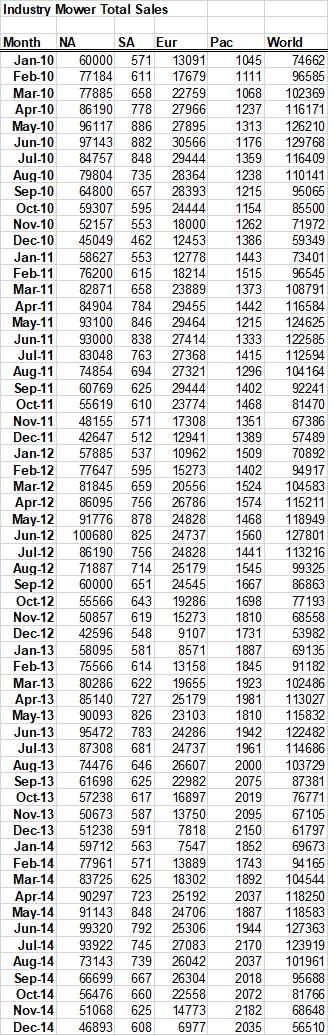
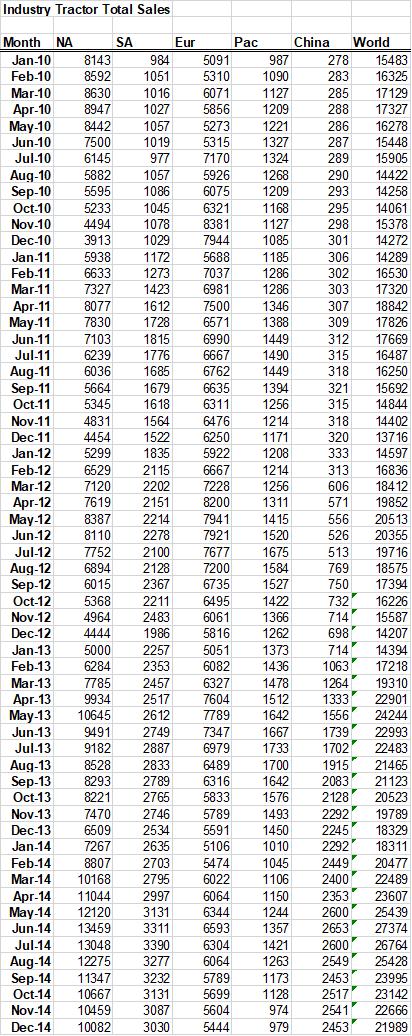
Create a new worksheet to show the market share for each product(Mower and Tractor) and region(NA, SA,
Fantastic news! We've Found the answer you've been seeking!
Question:
Create a new worksheet to show the market share for each product(Mower and Tractor) and region(NA, SA, EUR, PAC) based on the PLE and industry sales data in the database
PLE Data
| Year | Mower Price ($) | Tractor Price ($) |
| 2010 | 150 | 3250 |
| 2011 | 175 | 3400 |
| 2012 | 180 | 3600 |
| 2013 | 185 | 3700 |
| 2014 | 190 | 3800 |
Expert Answer:
Solution I will give you a guide for this question please see the belowattached images ... View the full answer

Posted Date:
