

Create applet that will draw a pie chart, you are given the values of pie slices...
Fantastic news! We've Found the answer you've been seeking!
Question:
Transcribed Image Text:
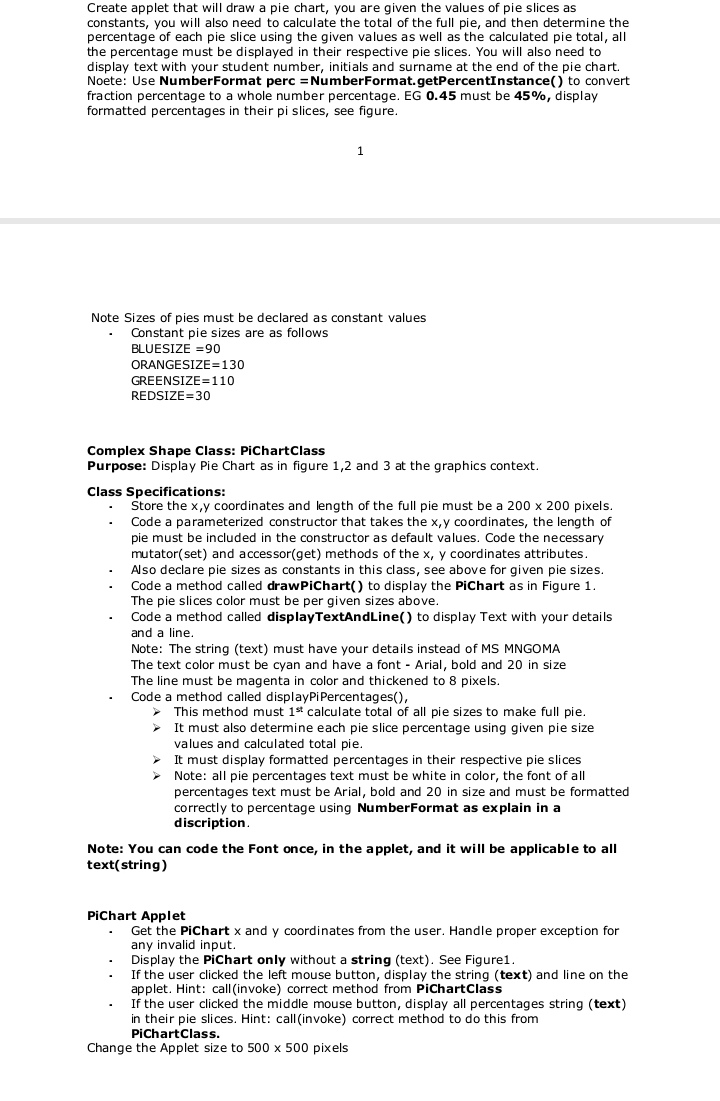
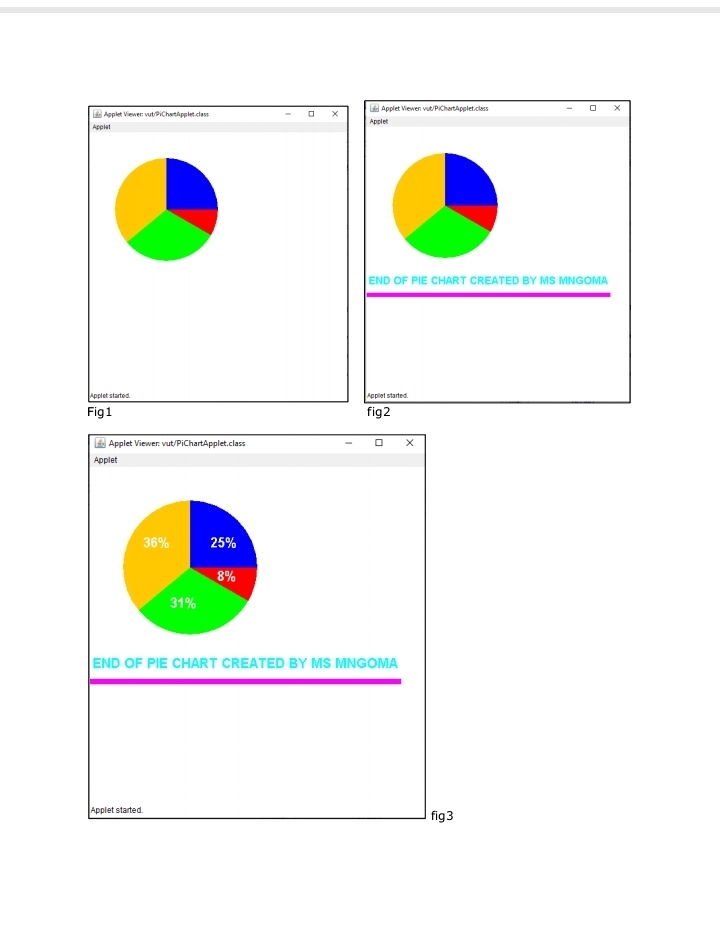
Create applet that will draw a pie chart, you are given the values of pie slices as constants, you will also need to calculate the total of the full pie, and then determine the percentage of each pie slice using the given values as well as the calculated pie total, all the percentage must be displayed in their respective pie slices. You will also need to display text with your student number, initials and surname at the end of the pie chart. Noete: Use NumberFormat perc = NumberFormat.getPercentInstance() to convert fraction percentage to a whole number percentage. EG 0.45 must be 45%, display formatted percentages in their pi slices, see figure. Note Sizes of pies must be declared as constant values Constant pie sizes are as follows BLUESIZE = 90 ORANGESIZE=130 GREENSIZE=110 REDSIZE=30 Complex Shape Class: PiChart Class Purpose: Display Pie Chart as in figure 1,2 and 3 at the graphics context. 1 Class Specifications: Store the x,y coordinates and length of the full pie must be a 200 x 200 pixels. Code a parameterized constructor that takes the x,y coordinates, the length of pie must be included in the constructor as default values. Code the necessary mutator(set) and accessor(get) methods of the x, y coordinates attributes. Also declare pie sizes as constants in this class, see above for given pie sizes. Code a method called drawPiChart() to display the PiChart as in Figure 1. The pie slices color must be per given sizes above. We prese Code a method called displayTextAndLine() to display Text with your details and a line. NAN Note: The string (text) must have your details instead of MS MNGOMA The text color must be cyan and have a font- Arial, bold and 20 in size w The line must be magenta in color and thickened to 8 pixels. Code a method called displayPi Percentages(), . This method must 1st calculate total of all pie sizes to make full pie. TA > It must also determine each pie slice percentage using given pie size velice and lated total ni values and calculated total pie. TL It must display formatted percentages in their respective pie slices Note: all pie percentages text must be white in color, the font of all percentages text must be Arial, bold and 20 in size and must be formatted correctly to percentage using NumberFormat as explain in a discription. Note: You can code the Font once, in the applet, and it will be applicable to all text(string) PiChart Applet Get the PiChart x and y coordinates from the user. Handle proper exception for any invalid input. Display the PiChart only without a string (text). See Figure1. If the user clicked the left mouse button, display the string (text) and line on the applet. Hint: call (invoke) correct method from PiChartClass If the user clicked the middle mouse button, display all percentages string (text) in their pie slices. Hint: call (invoke) correct method to do this from PiChartClass. Change the Applet size to 500 x 500 pixels Applet Viewer: vut/PiChatApplet.class Applet Applet started Fig1 Applet Viewer: vut/PiChartApplet.class Applet 36% 31% Applet started. 25% 8% Applet Viewen vut/PiChartApplet.class Applet END OF PIE CHART CREATED BY MS MNGOMA Applet started. fig2 END OF PIE CHART CREATED BY MS MNGOMA X fig3 X Create applet that will draw a pie chart, you are given the values of pie slices as constants, you will also need to calculate the total of the full pie, and then determine the percentage of each pie slice using the given values as well as the calculated pie total, all the percentage must be displayed in their respective pie slices. You will also need to display text with your student number, initials and surname at the end of the pie chart. Noete: Use NumberFormat perc = NumberFormat.getPercentInstance() to convert fraction percentage to a whole number percentage. EG 0.45 must be 45%, display formatted percentages in their pi slices, see figure. Note Sizes of pies must be declared as constant values Constant pie sizes are as follows BLUESIZE = 90 ORANGESIZE=130 GREENSIZE=110 REDSIZE=30 Complex Shape Class: PiChart Class Purpose: Display Pie Chart as in figure 1,2 and 3 at the graphics context. 1 Class Specifications: Store the x,y coordinates and length of the full pie must be a 200 x 200 pixels. Code a parameterized constructor that takes the x,y coordinates, the length of pie must be included in the constructor as default values. Code the necessary mutator(set) and accessor(get) methods of the x, y coordinates attributes. Also declare pie sizes as constants in this class, see above for given pie sizes. Code a method called drawPiChart() to display the PiChart as in Figure 1. The pie slices color must be per given sizes above. We prese Code a method called displayTextAndLine() to display Text with your details and a line. NAN Note: The string (text) must have your details instead of MS MNGOMA The text color must be cyan and have a font- Arial, bold and 20 in size w The line must be magenta in color and thickened to 8 pixels. Code a method called displayPi Percentages(), . This method must 1st calculate total of all pie sizes to make full pie. TA > It must also determine each pie slice percentage using given pie size velice and lated total ni values and calculated total pie. TL It must display formatted percentages in their respective pie slices Note: all pie percentages text must be white in color, the font of all percentages text must be Arial, bold and 20 in size and must be formatted correctly to percentage using NumberFormat as explain in a discription. Note: You can code the Font once, in the applet, and it will be applicable to all text(string) PiChart Applet Get the PiChart x and y coordinates from the user. Handle proper exception for any invalid input. Display the PiChart only without a string (text). See Figure1. If the user clicked the left mouse button, display the string (text) and line on the applet. Hint: call (invoke) correct method from PiChartClass If the user clicked the middle mouse button, display all percentages string (text) in their pie slices. Hint: call (invoke) correct method to do this from PiChartClass. Change the Applet size to 500 x 500 pixels Create applet that will draw a pie chart, you are given the values of pie slices as constants, you will also need to calculate the total of the full pie, and then determine the percentage of each pie slice using the given values as well as the calculated pie total, all the percentage must be displayed in their respective pie slices. You will also need to display text with your student number, initials and surname at the end of the pie chart. Noete: Use NumberFormat perc = NumberFormat.getPercentInstance() to convert fraction percentage to a whole number percentage. EG 0.45 must be 45%, display formatted percentages in their pi slices, see figure. Note Sizes of pies must be declared as constant values Constant pie sizes are as follows BLUESIZE = 90 ORANGESIZE=130 GREENSIZE=110 REDSIZE=30 Complex Shape Class: PiChart Class Purpose: Display Pie Chart as in figure 1,2 and 3 at the graphics context. 1 Class Specifications: Store the x,y coordinates and length of the full pie must be a 200 x 200 pixels. Code a parameterized constructor that takes the x,y coordinates, the length of pie must be included in the constructor as default values. Code the necessary mutator(set) and accessor(get) methods of the x, y coordinates attributes. Also declare pie sizes as constants in this class, see above for given pie sizes. Code a method called drawPiChart() to display the PiChart as in Figure 1. The pie slices color must be per given sizes above. We prese Code a method called displayTextAndLine() to display Text with your details and a line. NAN Note: The string (text) must have your details instead of MS MNGOMA The text color must be cyan and have a font- Arial, bold and 20 in size w The line must be magenta in color and thickened to 8 pixels. Code a method called displayPi Percentages(), . This method must 1st calculate total of all pie sizes to make full pie. TA > It must also determine each pie slice percentage using given pie size velice and lated total ni values and calculated total pie. TL It must display formatted percentages in their respective pie slices Note: all pie percentages text must be white in color, the font of all percentages text must be Arial, bold and 20 in size and must be formatted correctly to percentage using NumberFormat as explain in a discription. Note: You can code the Font once, in the applet, and it will be applicable to all text(string) PiChart Applet Get the PiChart x and y coordinates from the user. Handle proper exception for any invalid input. Display the PiChart only without a string (text). See Figure1. If the user clicked the left mouse button, display the string (text) and line on the applet. Hint: call (invoke) correct method from PiChartClass If the user clicked the middle mouse button, display all percentages string (text) in their pie slices. Hint: call (invoke) correct method to do this from PiChartClass. Change the Applet size to 500 x 500 pixels Create applet that will draw a pie chart, you are given the values of pie slices as constants, you will also need to calculate the total of the full pie, and then determine the percentage of each pie slice using the given values as well as the calculated pie total, all the percentage must be displayed in their respective pie slices. You will also need to display text with your student number, initials and surname at the end of the pie chart. Noete: Use NumberFormat perc = NumberFormat.getPercentInstance() to convert fraction percentage to a whole number percentage. EG 0.45 must be 45%, display formatted percentages in their pi slices, see figure. Note Sizes of pies must be declared as constant values Constant pie sizes are as follows BLUESIZE = 90 ORANGESIZE=130 GREENSIZE=110 REDSIZE=30 Complex Shape Class: PiChart Class Purpose: Display Pie Chart as in figure 1,2 and 3 at the graphics context. 1 Class Specifications: Store the x,y coordinates and length of the full pie must be a 200 x 200 pixels. Code a parameterized constructor that takes the x,y coordinates, the length of pie must be included in the constructor as default values. Code the necessary mutator(set) and accessor(get) methods of the x, y coordinates attributes. Also declare pie sizes as constants in this class, see above for given pie sizes. Code a method called drawPiChart() to display the PiChart as in Figure 1. The pie slices color must be per given sizes above. We prese Code a method called displayTextAndLine() to display Text with your details and a line. NAN Note: The string (text) must have your details instead of MS MNGOMA The text color must be cyan and have a font- Arial, bold and 20 in size w The line must be magenta in color and thickened to 8 pixels. Code a method called displayPi Percentages(), . This method must 1st calculate total of all pie sizes to make full pie. TA > It must also determine each pie slice percentage using given pie size velice and lated total ni values and calculated total pie. TL It must display formatted percentages in their respective pie slices Note: all pie percentages text must be white in color, the font of all percentages text must be Arial, bold and 20 in size and must be formatted correctly to percentage using NumberFormat as explain in a discription. Note: You can code the Font once, in the applet, and it will be applicable to all text(string) PiChart Applet Get the PiChart x and y coordinates from the user. Handle proper exception for any invalid input. Display the PiChart only without a string (text). See Figure1. If the user clicked the left mouse button, display the string (text) and line on the applet. Hint: call (invoke) correct method from PiChartClass If the user clicked the middle mouse button, display all percentages string (text) in their pie slices. Hint: call (invoke) correct method to do this from PiChartClass. Change the Applet size to 500 x 500 pixels Applet Viewer: vut/PiChatApplet.class Applet Applet started Fig1 Applet Viewer: vut/PiChartApplet.class Applet 36% 31% Applet started. 25% 8% Applet Viewen vut/PiChartApplet.class Applet END OF PIE CHART CREATED BY MS MNGOMA Applet started. fig2 END OF PIE CHART CREATED BY MS MNGOMA X fig3 X Applet Viewer: vut/PiChatApplet.class Applet Applet started Fig1 Applet Viewer: vut/PiChartApplet.class Applet 36% 31% Applet started. 25% 8% Applet Viewen vut/PiChartApplet.class Applet END OF PIE CHART CREATED BY MS MNGOMA Applet started. fig2 END OF PIE CHART CREATED BY MS MNGOMA X fig3 X Applet Viewer: vut/PiChatApplet.class Applet Applet started Fig1 Applet Viewer: vut/PiChartApplet.class Applet 36% 31% Applet started. 25% 8% Applet Viewen vut/PiChartApplet.class Applet END OF PIE CHART CREATED BY MS MNGOMA Applet started. fig2 END OF PIE CHART CREATED BY MS MNGOMA X fig3 X
Expert Answer:

Related Book For 

Introduction to Operations Research
ISBN: 978-1259162985
10th edition
Authors: Frederick S. Hillier, Gerald J. Lieberman
Posted Date:
Students also viewed these programming questions
-
123 Compare the purely graphical properties of these two notations, and the ways in which the graphical properties of each display correspond to the information structure being defined. Describe...
-
Define the contextual-equivalence relation ` M =ctx M0 : for pairs of PCF terms M, M0 , PCF types , and PCF type environments . [3 marks] (ii) For PCF terms M and N with respective typings ` M : and...
-
The Illinois State University Alumni Association is having two Baseball Day events this year. The purpose of the events is to both foster relationships between ISU alums and to also raise money for...
-
Translate into dollars the balance sheet of Ohio Leather Goods' Greek subsidiary. When Ohio Leather Goods acquired the foreign subsidiary, a euro was worth $1.06. The current exchange rate is $1.36....
-
Jarvene Corporation uses the FIFO method in its process costing system. The following data are for the most recent month of operations in one of the company s processing departments: Units in...
-
When you should file a notice of lien?
-
Your partner drafted the following auditors report yesterday. You need to describe the reporting deficiencies, explain the reasons for them, and discuss with the partner how the report should be...
-
Based on the information that follows: Sales $86,800 Sales Returns and Allowances 2,310 Sales Discounts 1,736 Required: Prepare the revenue section of a multiple-step income statement.
-
An automatic machine produces (thousands of) units of a product per day. As increases, the proportion of defectives, p, goes up according to the following probability density function Each...
-
1- Explain how multithreading is implemented in Java. How are threads created in Java? How threads may be used to run multi-tasks? 2- Write a simple Java application to create three independent...
-
Holton Company makes three products in a single facility. Data concerning these products follow: Selling price per unit Direct materials Direct labor Variable manufacturing overhead Variable selling...
-
1. Suppose a wheel first starts spinning from rest with an angular acceleration of 70.4 rad/s 2 . Then after 20 s, the wheel starts to stop causing an angular acceleration of -45.6 rad/s 2 . How long...
-
All of Pershing Electronics' customers take their discount from their credit terms of 2/10 net 30 days. If they invoiced $500,000 over the last quarter, how much did their customers save by prompt...
-
1) List and describe each of the seven interlinking functions of human resource management (HRM) b) Describe why HRM is critical to organizations Question 2) Why is it important for HR management to...
-
What are the one key organizational behavior factor contributing to the high turnover, and suggest a brief strategy to address it?
-
It is year end and for each of the following separate issues, state the type of change, change in accounting principle, change in accounting estimate, or an error, how it would be accounting for,...
-
What are the risks and liability factors in an audit? What are the implications to the auditor? What are the implications to the organization? How can the auditor mitigate these risks and liability...
-
A machine shop makes two products. Each unit of the first product requires 3 hours on machine 1 and 2 hours on machine 2. Each unit of the second product requires 2 hours on machine 1 and 3 hours on...
-
The comptroller of the Macrosoft Corporation has $100 million of excess funds to invest. She has been instructed to invest the entire amount for one year in either stocks or bonds (but not both) and...
-
Suppose that there exist three different types of components, with two units of each type. Each unit operates independently, and each type has probability pi of performing successfully. Either one or...
-
Figure P18-39 shows two similar unit pulse waveforms. The only difference is that the first pulse is positive from \(-T / 2\) to \(T / 2\), while the second pulse goes from \(+\mathrm{A}\) to...
-
Describe the principal types of audits performed by independent auditors and indicate the established criteria and primary users of each tyr
-
Contrast the activities of independent, internal, and governmental auditors.

Study smarter with the SolutionInn App