

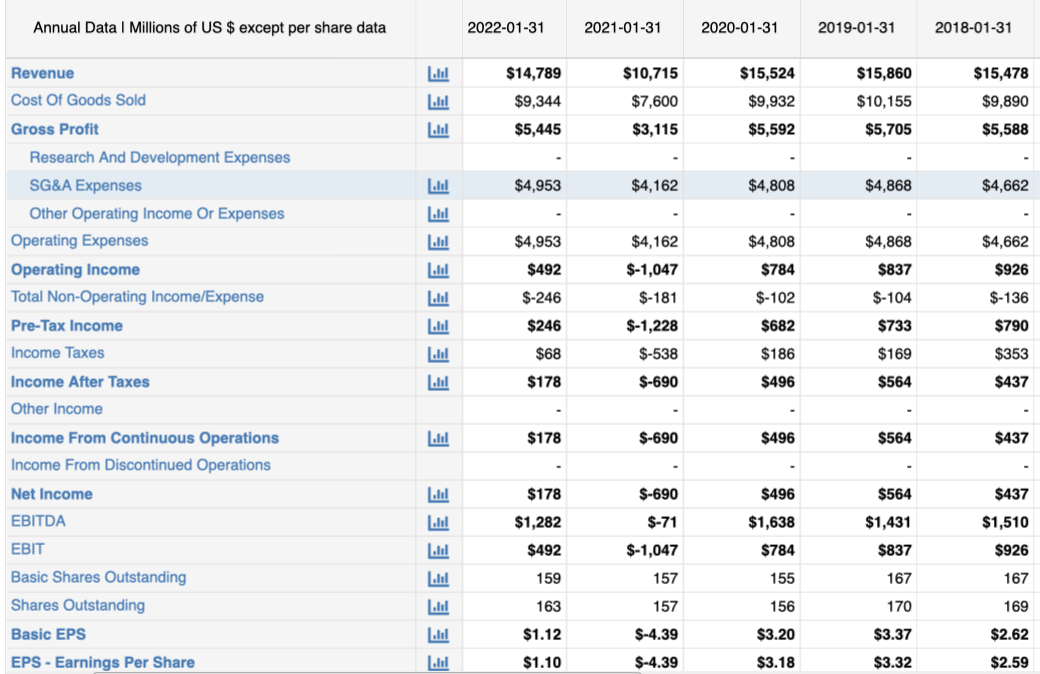
create The Spreadsheet in Excel for Nordstrom INC. JWN data. Historical financial information for the income statement,
Fantastic news! We've Found the answer you've been seeking!
Question:
create The Spreadsheet in Excel for Nordstrom INC. JWN data.
- Historical financial information for the income statement, balance sheet and statement of cash flows is complete, well-collated and sufficient to understand historical behavior of cash flows (FCFF, FCFE, UCF etc.).
- Analytics (common-size financials, growth rates, ratios) are complete, are correctly computed, and used to analyze both the historical data and the forecast financials.
- Forecast financial statements are dynamic (e.g. subtotals are computed from data in the same year) and the computations are correct.
- The balance sheet ties out: Assets = Liabilities + Equity.
- Interest expense is derived from debt on the balance sheet.
- Retained earnings is derived from net income and dividends/buybacks.
- Cash on the balance sheet is driven by the statement of cash flows.
- Statement of cash flows pulls net income from the income statement and shows effects of changes in assets & liabilities driven by balance sheet figures.
- Forecast financial figures are driven by reasonable assumptions.
- Forecast assumptions are not too simplistic (e.g. not everything grows at the same rate as revenue, avoided rolling averages and blind extrapolations of growth).
- Patterns shown in the analytics support a consistent understanding of past and forecast financial performance.
- Terminal growth rate seems sensible (e.g. less than costs of capital, less than SGR, appropriate for the sector of the economy and for the company, etc.).
- Computations of cash flows (FCFF, FCFE, etc.) for historical and forecast periods link to financial statement data and computations are correct.
- Computations of change in Net Working Capital (NWC) include all appropriate operating items and exclude non-operating items.
- Computations of change in Gross Fixed Assets include all appropriate items and exclude non-operating items.
- Costs of capital are correctly computed.
- Unlevered cost of capital (Ku) is driven by unlevered beta of comparable firms and cost of equity (Ke) is driven by re-levered beta.
- The costs of capital follow a logical order (i.e. inflation < Rf < Kd < WACC < Ku < Ke).
- The costs of capital appropriately reflect the riskiness of the company and the uncertainty of cash flows being discounted.
- DCF valuations are correctly computed: correct discount rate is used, cash flows in the explicit forecast period are discounted correctly.
- Terminal value is correctly computed based on perpetuity of cash flows (can also be a multiple of forecast earnings, sales or EBITDA).
- The market value of debt is driven by debt on and off the balance sheet (e.g. operating lease obligations are treated as off balance sheet debt).
- The market value of debt is appropriately valued based on timing and the pre-tax cost of debt (Kd).
- Relative valuations based on P/E, P/S and EV/EBITDA ratios are correctly computed.
- A sufficient number of peer companies were used to determine baseline ratios (I recommend 10-12 comparable firms).
- Comparable firms seem appropriate for the subject company based on industry, economic exposure, size, condition, etc., and the same comparable firms were used to determine multiples as were used in determining unlevered beta.
Expert Answer:

Related Book For 
Intermediate Accounting
ISBN: 978-0470161012
9th Canadian Edition, Volume 2
Authors: Donald E. Kieso, Jerry J. Weygandt, Terry D. Warfield.
Posted Date:
