

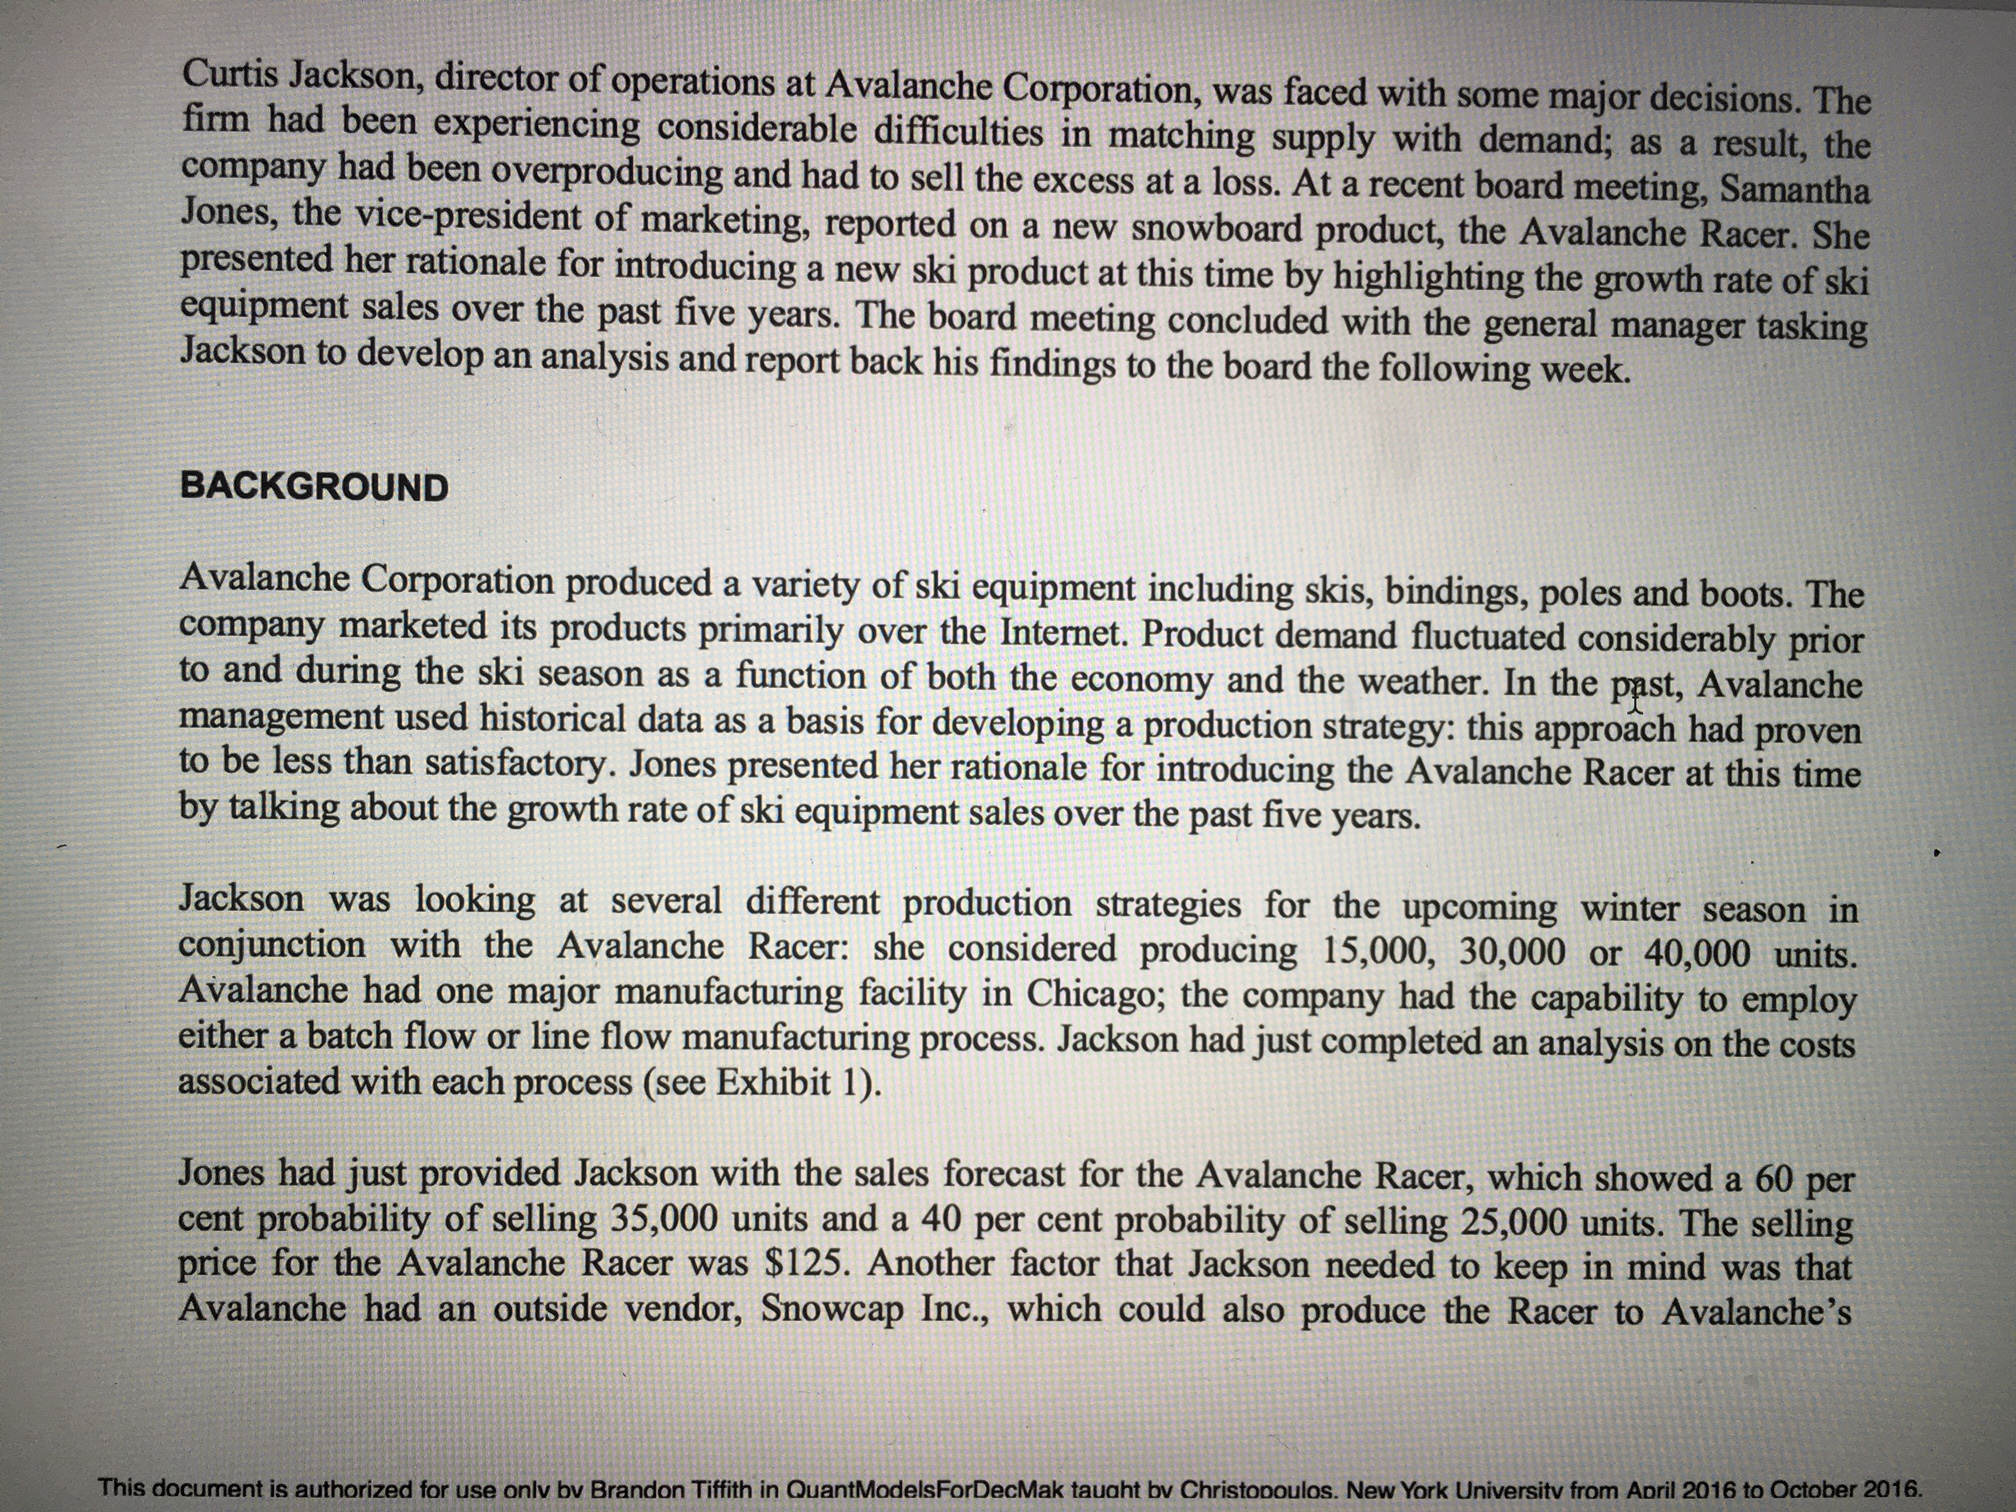
Curtis Jackson, director of operations at Avalanche Corporation, was faced with some major decisions. The firm...
Fantastic news! We've Found the answer you've been seeking!
Question:

Transcribed Image Text:
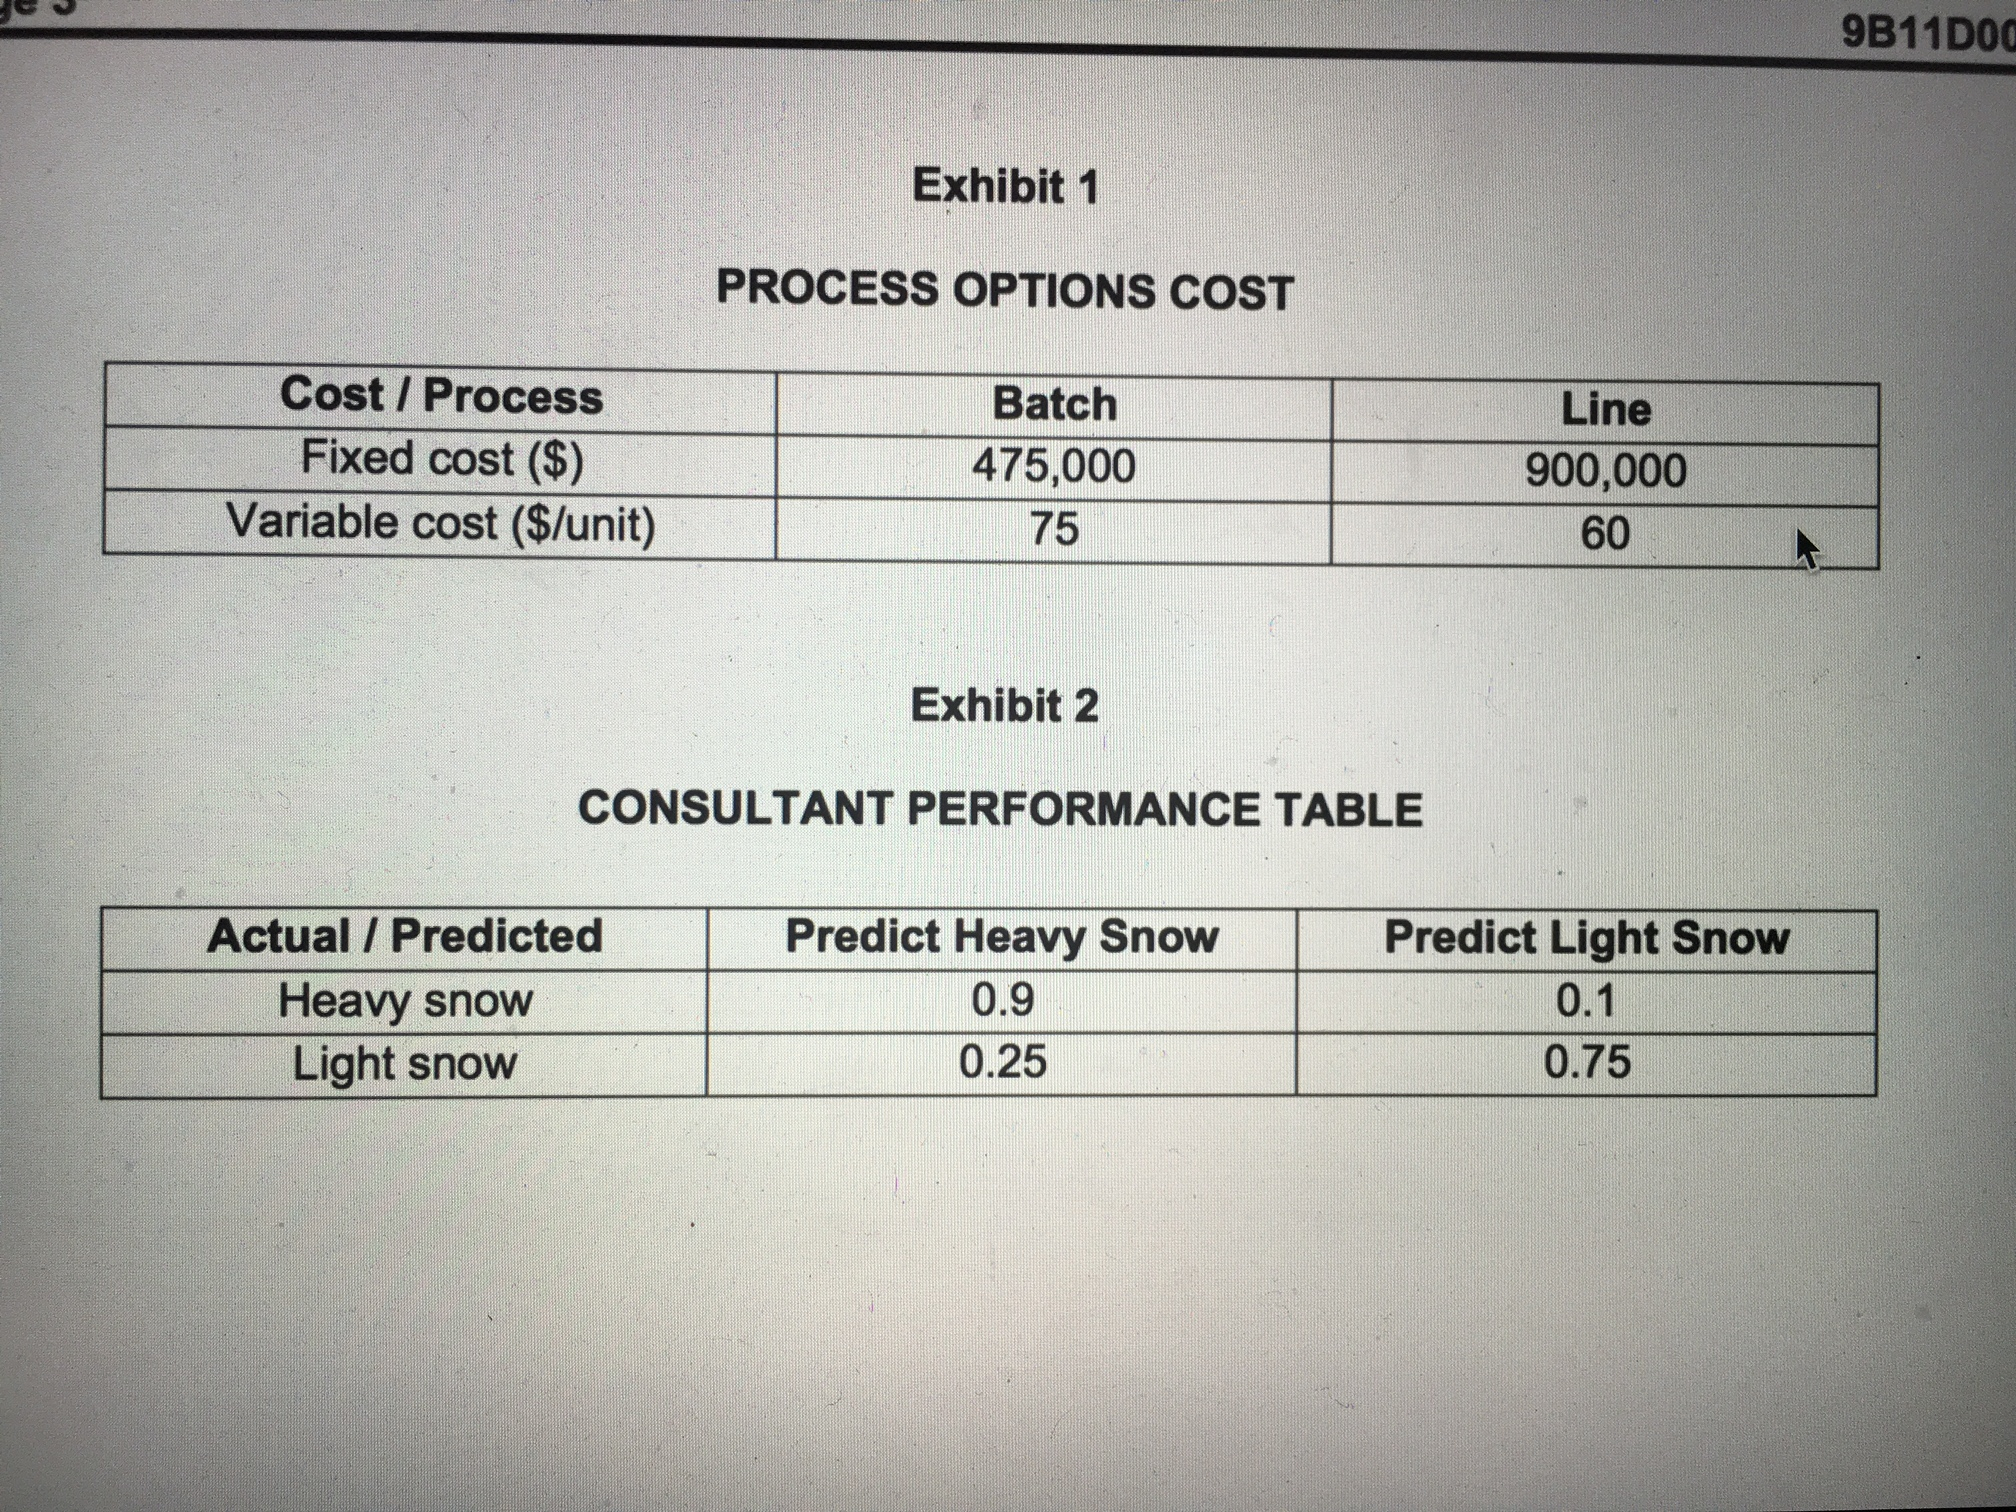
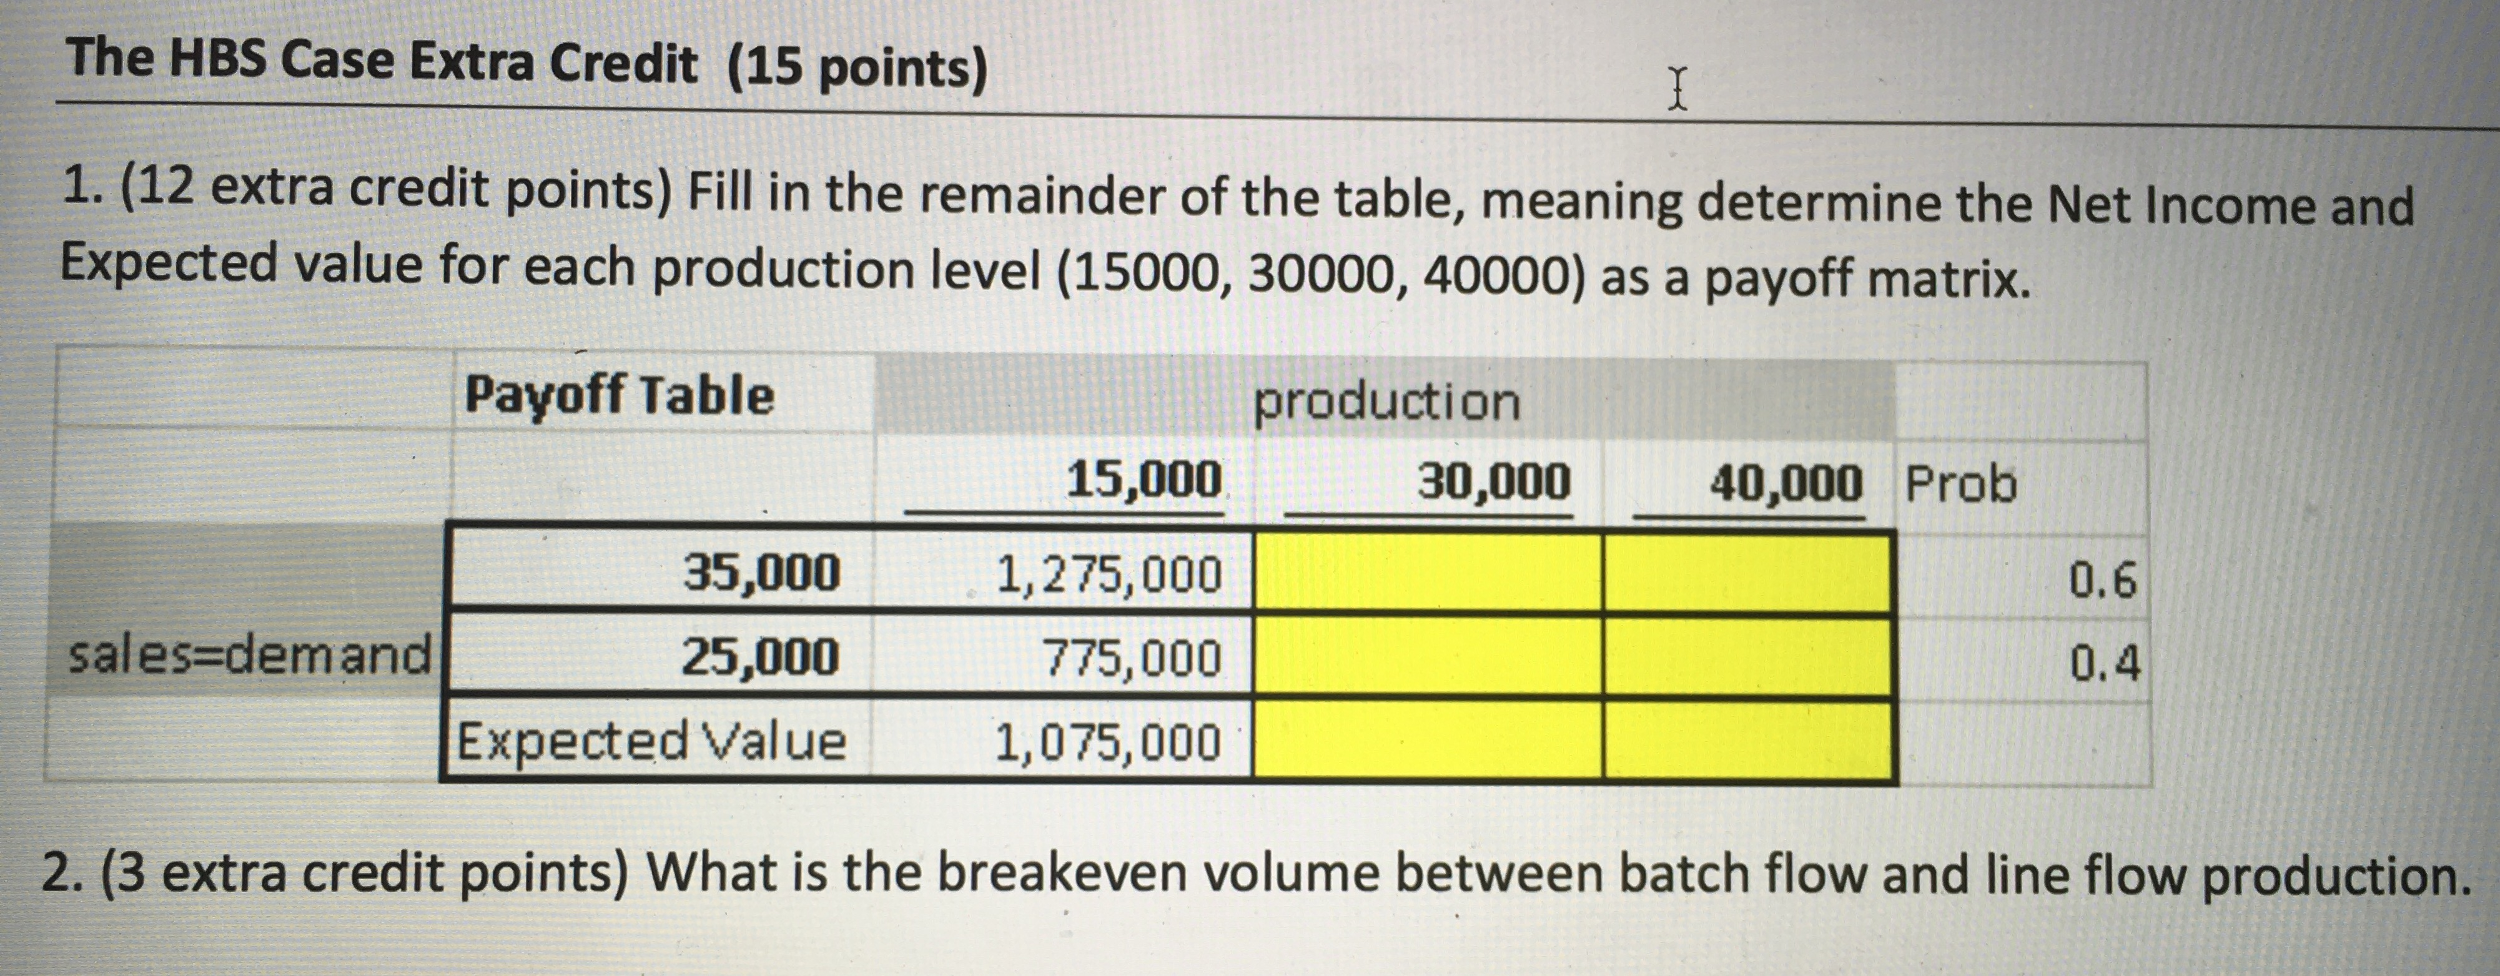
Curtis Jackson, director of operations at Avalanche Corporation, was faced with some major decisions. The firm had been experiencing considerable difficulties in matching supply with demand; as a result, the company had been overproducing and had to sell the excess at a loss. At a recent board meeting, Samantha Jones, the vice-president of marketing, reported on a new snowboard product, the Avalanche Racer. She presented her rationale for introducing a new ski product at this time by highlighting the growth rate of ski equipment sales over the past five years. The board meeting concluded with the general manager tasking Jackson to develop an analysis and report back his findings to the board the following week. BACKGROUND Avalanche Corporation produced a variety of ski equipment including skis, bindings, poles and boots. The company marketed its products primarily over the Internet. Product demand fluctuated considerably prior to and during the ski season as a function of both the economy and the weather. In the past, Avalanche management used historical data as a basis for developing a production strategy: this approach had proven to be less than satisfactory. Jones presented her rationale for introducing the Avalanche Racer at this time by talking about the growth rate of ski equipment sales over the past five years. Jackson was looking at several different production strategies for the upcoming winter season in conjunction with the Avalanche Racer: she considered producing 15,000, 30,000 or 40,000 units. Avalanche had one major manufacturing facility in Chicago; the company had the capability to employ either a batch flow or line flow manufacturing process. Jackson had just completed an analysis on the costs associated with each process (see Exhibit 1). Jones had just provided Jackson with the sales forecast for the Avalanche Racer, which showed a 60 per cent probability of selling 35,000 units and a 40 per cent probability of selling 25,000 units. The selling price for the Avalanche Racer was $125. Another factor that Jackson needed to keep in mind was that Avalanche had an outside vendor, Snowcap Inc., which could also produce the Racer to Avalanche's This document is authorized for use onlv bv Brandon Tiffith in QuantModelsForDecMak tauaht bv Christopoulos. New York University from April 2016 to October 2016. 9B11D006 specifications for a cost of $75 each. Avalanche had a contract with its union workers which clearly specified that outside vendors could only be used in the event that demand exceeded production. Furthermore, unsold units could be sold at a clearance sale for $50. Given all of this information, Jackson decided to use an analytics-based approach to determine the optimal production level. To further compound the situation, Jackson had recently received a proposal from a local consulting firm named Fantastic Forecasters (see Exhibit 2). Jackson knew that this firm had a good track record for predicting upcoming weather conditions – valuable information for a winter sports manufacturing company. The fee for developing a forecast was $20,000. Jackson wanted to first figure out the maximum amount that he would be willing to pay for additional information under ideal conditions. He also realized that he would have to incorporate the consulting firm's cost and performance numbers into the analysis. After that, he could determine how much the sample information was worth so that he could decide whether or not to hire Fantastic Forecasters. Jackson had a lot of work to do and he was eager to get started. His first step was to decide on the best production process; he would need to determine the break-even volume for the two production options (batch and line). Once that task had been accomplished, he planned to determine the net income (revenue - cost) for each of the six demand and production options (e.g. demand = 35,000 and production = 15,000) based on the most appropriate production process (batch or line). Having assembled the payoff table, he could then determine the optimal production strategy based on the production level that maximized expected value based on prior marketing probabilities. These steps were reasonably clear; however, assessing the bid from Fantastic Forecasters was another thing entirely. Jackson recalled a lecture from his graduate days involving a process for revising past probabilities using additional information. A quick Google search revealed that Bayesian analysis would do the trick; specifically, Bayesian analysis is an analytical methodology for updating a marketing department's demand probabilities with information supplied by a forecasting consultant. Jackson was also worried about the accuracy of some of the estimates, so he planned to perform sensitivity analysis on some of the more uncertain estimates. %3D %3D 9B11D00 Exhibit 1 PROCESS OPTIONS COST Cost / Process Fixed cost ($) Variable cost ($/unit) Batch Line 475,000 900,000 75 60 Exhibit 2 CONSULTANT PERFORMANCE TABLE Actual / Predicted Predict Heavy Snow Predict Light Snow 0.1 0.9 Heavy snow Light snow 0.25 0.75 The HBS Case Extra Credit (15 points) 1. (12 extra credit points) Fill in the remainder of the table, meaning determine the Net Income and Expected value for each production level (15000, 30000, 40000) as a payoff matrix. Payoff Table production 15,000 30,000 40,000 Prob 35,000 1,275,000 0.6 sales=demand 25,000 775,000 0.4 Expected Value 1,075,000 2. (3 extra credit points) What is the breakeven volume between batch flow and line flow production. Curtis Jackson, director of operations at Avalanche Corporation, was faced with some major decisions. The firm had been experiencing considerable difficulties in matching supply with demand; as a result, the company had been overproducing and had to sell the excess at a loss. At a recent board meeting, Samantha Jones, the vice-president of marketing, reported on a new snowboard product, the Avalanche Racer. She presented her rationale for introducing a new ski product at this time by highlighting the growth rate of ski equipment sales over the past five years. The board meeting concluded with the general manager tasking Jackson to develop an analysis and report back his findings to the board the following week. BACKGROUND Avalanche Corporation produced a variety of ski equipment including skis, bindings, poles and boots. The company marketed its products primarily over the Internet. Product demand fluctuated considerably prior to and during the ski season as a function of both the economy and the weather. In the past, Avalanche management used historical data as a basis for developing a production strategy: this approach had proven to be less than satisfactory. Jones presented her rationale for introducing the Avalanche Racer at this time by talking about the growth rate of ski equipment sales over the past five years. Jackson was looking at several different production strategies for the upcoming winter season in conjunction with the Avalanche Racer: she considered producing 15,000, 30,000 or 40,000 units. Avalanche had one major manufacturing facility in Chicago; the company had the capability to employ either a batch flow or line flow manufacturing process. Jackson had just completed an analysis on the costs associated with each process (see Exhibit 1). Jones had just provided Jackson with the sales forecast for the Avalanche Racer, which showed a 60 per cent probability of selling 35,000 units and a 40 per cent probability of selling 25,000 units. The selling price for the Avalanche Racer was $125. Another factor that Jackson needed to keep in mind was that Avalanche had an outside vendor, Snowcap Inc., which could also produce the Racer to Avalanche's This document is authorized for use onlv bv Brandon Tiffith in QuantModelsForDecMak tauaht bv Christopoulos. New York University from April 2016 to October 2016. 9B11D006 specifications for a cost of $75 each. Avalanche had a contract with its union workers which clearly specified that outside vendors could only be used in the event that demand exceeded production. Furthermore, unsold units could be sold at a clearance sale for $50. Given all of this information, Jackson decided to use an analytics-based approach to determine the optimal production level. To further compound the situation, Jackson had recently received a proposal from a local consulting firm named Fantastic Forecasters (see Exhibit 2). Jackson knew that this firm had a good track record for predicting upcoming weather conditions – valuable information for a winter sports manufacturing company. The fee for developing a forecast was $20,000. Jackson wanted to first figure out the maximum amount that he would be willing to pay for additional information under ideal conditions. He also realized that he would have to incorporate the consulting firm's cost and performance numbers into the analysis. After that, he could determine how much the sample information was worth so that he could decide whether or not to hire Fantastic Forecasters. Jackson had a lot of work to do and he was eager to get started. His first step was to decide on the best production process; he would need to determine the break-even volume for the two production options (batch and line). Once that task had been accomplished, he planned to determine the net income (revenue - cost) for each of the six demand and production options (e.g. demand = 35,000 and production = 15,000) based on the most appropriate production process (batch or line). Having assembled the payoff table, he could then determine the optimal production strategy based on the production level that maximized expected value based on prior marketing probabilities. These steps were reasonably clear; however, assessing the bid from Fantastic Forecasters was another thing entirely. Jackson recalled a lecture from his graduate days involving a process for revising past probabilities using additional information. A quick Google search revealed that Bayesian analysis would do the trick; specifically, Bayesian analysis is an analytical methodology for updating a marketing department's demand probabilities with information supplied by a forecasting consultant. Jackson was also worried about the accuracy of some of the estimates, so he planned to perform sensitivity analysis on some of the more uncertain estimates. %3D %3D 9B11D00 Exhibit 1 PROCESS OPTIONS COST Cost / Process Fixed cost ($) Variable cost ($/unit) Batch Line 475,000 900,000 75 60 Exhibit 2 CONSULTANT PERFORMANCE TABLE Actual / Predicted Predict Heavy Snow Predict Light Snow 0.1 0.9 Heavy snow Light snow 0.25 0.75 The HBS Case Extra Credit (15 points) 1. (12 extra credit points) Fill in the remainder of the table, meaning determine the Net Income and Expected value for each production level (15000, 30000, 40000) as a payoff matrix. Payoff Table production 15,000 30,000 40,000 Prob 35,000 1,275,000 0.6 sales=demand 25,000 775,000 0.4 Expected Value 1,075,000 2. (3 extra credit points) What is the breakeven volume between batch flow and line flow production.
Expert Answer:

Related Book For 
OM operations management
ISBN: 978-1285451374
5th edition
Authors: David Alan Collier, James R. Evans
Posted Date:
Students also viewed these general management questions
-
Over the past five years the United States has become the worlds largest producer of natural gas. But gas producers have struggled to find methods to liquefy natural gas so that it can be exported...
-
Baxmedical stock has increased over the past five years by the following percentages: 8, 12, 14, 26, and 5. Compute the geometric mean of the percentage increases.
-
Rita Sharp, Director of Operations at the Farnsworth Museum of Industrial Arts, has gathered weekly visitor data for the past year. Rita is interested in explaining why the number of visitors (NUMV)...
-
In Exercises 1-2, the augmented matrix of a linear system has been reduced by row operations to the form shown. In each case, continue the appropriate row operations and describe the solution set of...
-
Shirrell Blackthorn is the accountant for several pizza restaurants based in a tri-city area. The president of the chain wanted some help with budgeting and cost control, so Shirrell decided to...
-
Bromination of 3-methyl-2-butanone yielded two compounds, each having the molecular formula C5H9BrO, in a 95:5 ratio. The 1H NMR spectrum of the major isomer A was characterized by a doublet at 1.2...
-
Find the critical value for the ???? = 0.01 level of significance. Exercises 1015 refer to the following data: Anthropologists can estimate the birthrate of an ancient society by studying the age...
-
EZ, Inc., manufactures two products that require both machine processing and labor operations. Although there is unlimited demand for both products, EZ could devote all its capacities to a single...
-
5. The following applies to Donte Corporation for the month of September. All materials are added at the beginning of the production process and the company uses FIFO. Beginning Inventory 2,350...
-
1. What is your assessment of the financial performance of Nelson Nurseries? 2. Do you agree with Christine Barton?s accounts-payable policy? 3. What explains the erosion of the cash balance? 4. What...
-
Using the phase-gate process, How does understanding consumer wants and needs impact the process of generating and developing successful product ideas, and how can companies help ensure that the...
-
Before issuing a report on the compilation of financial statements of a nonpublic entity, the accountant should a. Apply analytical procedures to selected financial data to discover any material...
-
Under which of the following circumstances would a disclaimer of opinion not be appropriate? a. The auditor is engaged after fiscal year-end and is unable to observe physical inventories or apply...
-
In what reporting situations covered in this chapter can an auditor provide each of the following levels of assurance? a. An opinion b. Negative/limited assurance
-
Discuss the different methods of improving decision making in organizations. Which of these methods do you expect to find widely used in organizations? Discuss differences in how easy it is to use...
-
You are in charge of the audit of the financial statements of Parat, Inc., and consolidated subsidiaries covering the two years ended December 31, 2003. Another public accounting firm is auditing...
-
Find the equation of the tangent line to the curve y=xx +5 at the point (2,6).
-
The Alert Company is a closely held investment-services group that has been very successful over the past five years, consistently providing most members of the top management group with 50% bonuses....
-
A restaurant wants to forecast its weekly sales. Historical data (in dollars) for fifteen weeks are shown below and can be found on the worksheet C11P6 in the OM5 Data & Calculations Workbook. a....
-
How does Procter & Gamble use the competitive priority quality to its competitive advantage? Research, then explain and provide examples in a short paper (maximum of two typed pages).
-
Research and write a short paper (two pages maximum) on how efficient vehicle scheduling and routing are accomplished. If possible, provide some examples of commercial software that are used for...
-
Derive the expression for the natural frequency of the system shown in Fig. 2.60. Note that the load \(W\) is applied at the tip of beam 1 and midpoint of beam 2. , E, I W 12, E2, 12 FIGURE 2.60 Load...
-
A weight is suspended using six rigid links and two springs in two different ways, as shown in Fig. 2.64. Find the natural frequencies of vibration of the two arrangements. 00000 W (a) 00000 k 00000...
-
A scissors jack is used to lift a load \(W\). The links of the jack are rigid and the collars can slide freely on the shaft against the springs of stiffnesses \(k_{1}\) and \(k_{2}\) (see Fig. 2.63)....

Study smarter with the SolutionInn App