

Dain's Diamond Bit Drilling purchased the following assets this year. Original Basis Purchase Date March 08...
Fantastic news! We've Found the answer you've been seeking!
Question:


Transcribed Image Text:
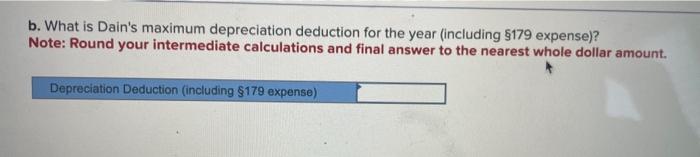
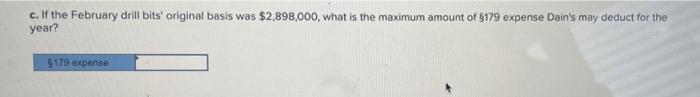
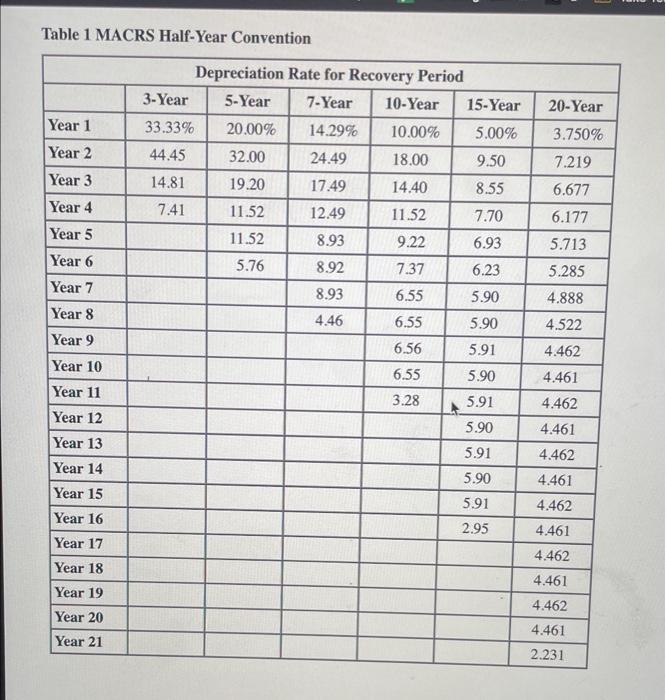
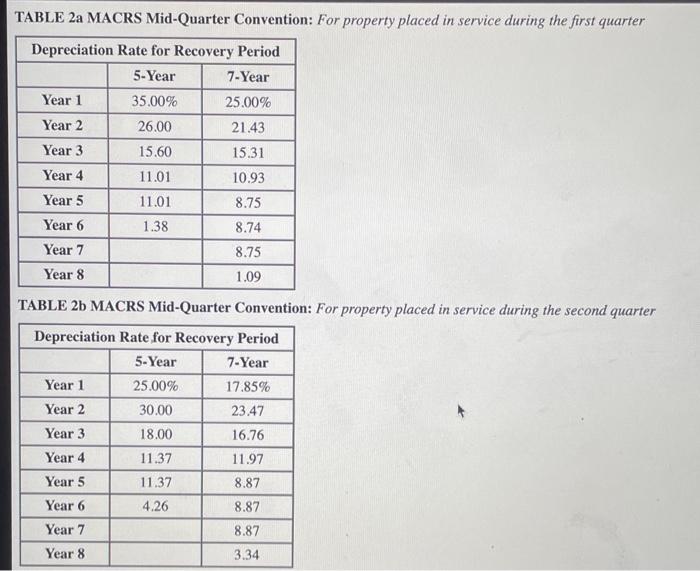
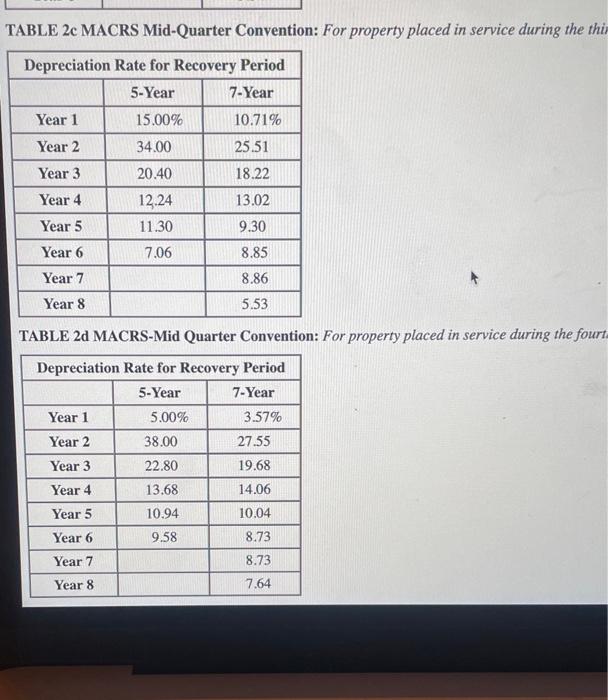
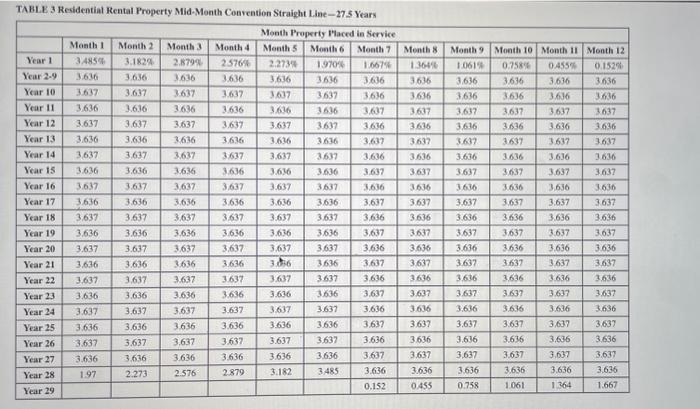
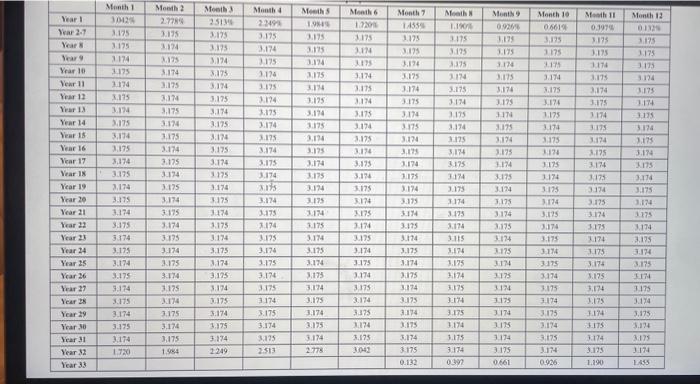
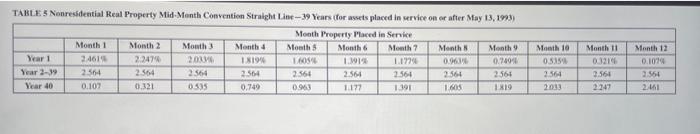
Dain's Diamond Bit Drilling purchased the following assets this year. Original Basis Purchase Date March 08 $ 92,300 Asset Drill bits (5-year) Drill bits (5-year) Commercial building July 11 June 15 97,300 266.000 Assume its taxable income for the year was $76,000 for purposes of computing the $179 expense (assume no bonus depreciation). (Use MACRS Table 1 Table 2. Table 3. Table 4 and Table 5) Note: Leave no answer blank. Enter zero if applicable. a. What is the maximum amount of 5179 expense Dain's may deduct for the year? $179 expense b. What is Dain's maximum depreciation deduction for the year (including 179 expense)? Note: Round your intermediate calculations and final answer to the nearest whole dollar amount. Depreciation Deduction (including $179 expense) c. If the February drill bits' original basis was $2,898,000, what is the maximum amount of $179 expense Dain's may deduct for the year? $179 expense d. If the February drill bits' original basis was $3,898,000, what is the maximum amount of $179 expense Dain's may deduct for the year? Maximum 5179 expense Table 1 MACRS Half-Year Convention Depreciation Rate for Recovery Period 3-Year 5-Year 7-Year 10-Year 15-Year 20-Year Year 1 33.33% 20.00% 14.29% 10.00% 5.00% 3.750% Year 2 44.45 32.00 24.49 18.00 9.50 7.219 Year 3 14.81 19.20 17.49 14.40 8.55 6.677 Year 4 7.41 11.52 12.49 11.52 7.70 6.177 Year 5 11.52 8.93 9.22 6.93 5.713 Year 6 5.76 8.92 7.37 6.23 5.285 Year 7 8.93 6.55 5.90 4.888 Year 8 4.46 6.55 5.90 4.522 Year 9 6.56 5.91 4.462 Year 10 6.55 5.90 4.461 Year 11 3.28 5.91 4.462 Year 12 5.90 4.461 Year 13 5.91 4.462 Year 14 5.90 4.461 Year 15 5.91 4.462 Year 16 2.95 4.461 Year 17 4.462 Year 18 4.461 Year 19 4.462 Year 20 4.461 Year 21 2.231 TABLE 2a MACRS Mid-Quarter Convention: For property placed in service during the first quarter Depreciation Rate for Recovery Period 5-Year 7-Year Year 1 35.00% 25.00% Year 2 26.00 21.43 Year 3 15.60 15.31 Year 4 11.01 10.93 Year 5 11.01 8.75 Year 6 1.38 8.74 Year 7 8.75 1.09 Year 8 TABLE 2b MACRS Mid-Quarter Convention: For property placed in service during the second quarter Depreciation Rate for Recovery Period 5-Year 7-Year Year 1 25.00% 17.85% Year 2 30.00 23.47 Year 3 18.00 16.76 Year 4 11.37 11.97 Year 5 11.37 8.87 Year 6 4.26 8.87. Year 7 8.87 Year 8 3.34 TABLE 2c MACRS Mid-Quarter Convention: For property placed in service during the thir Depreciation Rate for Recovery Period 5-Year 7-Year Year 1 15.00% 10.71% Year 2 34.00 25.51 Year 3 20.40 18.22 Year 4 12.24 13.02 Year 5 11.30 9.30 Year 6 7.06 8.85 Year 7 8.86 5.53 Year 8 TABLE 2d MACRS-Mid Quarter Convention: For property placed in service during the fourt Depreciation Rate for Recovery Period 5-Year 7-Year Year 1 5.00% 3.57% Year 2 38.00 27.55 Year 3 22.80 19.68 Year 4 13.68 14.06 Year 5 10.94 10.04 Year 6 9.58 8.73 Year 7 8.73 Year 8 7.64 TABLE 3 Residential Rental Property Mid-Month Convention Straight Line-27.5 Years Month Property Placed in Service Month 1 Month 2 Month 31 Month 4 Month 5 Month 6 Month 7 Month 8. Month 9 Month 10 Month 11 Month 12 Year 1 3.485% 3.182% 2.879% 2576% 2.273% 1970 % 1.667% 1.364% 1.061% 0.758% 0.455% 0.152% Year 2-9 3.636 3.636. 3.636 3.636 3.636 3.636 3.636 3.636 3.636 3.636 3.636 3.636 Year 10 3.637 3.637 3.637 3.637 3,637 3637 3.636 3.636 3.6361 3.636 3.636 3.636 Year 11 3.636 3.636 3.636 3.636 3.636 3636 3.637 3.637 3.637 3.637 3.637 3.637 Year 12 3.637 3.637 3.637 3.637 3.637 3.637 3.636 3.636 3,636 3.636 3.636 3.636 Year 13 3.636 3.636 3.636 3.636 3.636 3.636 3.637 3.637 3.637 3.637 3.637 3.637 Year 14 3.637 3.637 3.637 3.637 3.637 3.637 3.636 3.636 3.636 3.636 3.636 3.636 Year 15 3.636 3.636 3.636 3.636 3.636 3.636 3.637 3.637 3.637 3.637 3.637 3.637 Year 16 3.637 3.637 3.637 3.637 3.637 3.637 3.636 3.636 3.636 3.636 3,636 3.636 Year 17 3.636 3.636 3.636 3.636 3.636 3.636 3.637 3.637 3.637 3.637 3.637 3.637 Year 18 3.637 3.637 3.637 3.637 3.637 3.637 3.636 3.636 3.636 3.636 3.636 3.636 Year 19 3.636 3.636 3.636 3.636 3.636 3.636 3.637 3.637 3.637 3.637 3.637 3.637 Year 20 3.637 3.637 3.637 3.637 3.637 3.637 3.636 3.636 3.636 3.636 3.636 3.636 Year 21 3.636 3.636 3.636 3.636 3.036 3.636 3.637 3.637 3.637 3.637 3.637 3.637 Year 22 3.637 3.637 3.637 3.637 3.637 3.637 3.636 3.636 3.636 3.636 3.636 3.636 Year 23 3.636 3.636 3.636 3.636 3.636 3.636 3.637 3.637 3.637 3.637 3.637 3.637 Year 24 3.637 3.637 3.637 3.637 3.637 3.637 3.636 3.636 3.636 3.636 3.636 3.636 Year 25 3.636 3.636 3.636 3.636 3.636 3.636 3.637 3.637 3.637 3.637 3,637 3,637 Year 26 3.637 3.637 3.637 3.637 3.6371 3.637 3.636 3.636 3.636 3.636 3.636 3.636 Year 27 3.636 3.636 3.636 3.636 3.636 3.636 3.637 3.637 3,637 3.637 3.637 3.637 Year 28 1.97 2.273 2.576 2.879 3.182 3.485 3.636) 3.636 3.636 3.636 3.636 3.636 0.152 0.455 0.758 1.061 1.364 1.667 Year 29 Month 1 Month 2 Month 3 Month 4 Month 5 Month 6 Month 7 Meath N Month 9 Month 10 Month 11 Month 12 Year 1 3042% 2.778% 2513% 2249% 1984% 1.220% 1455% 1.190 0.926% 0.661% 0.397% 0132% Year 2-7 3.175 3.175 3.175 3.375 3.375 3.375 3.175 3475 3.175 3,375 3.175 3.175 Year 8 3.175 3.174 3.375 3.174 3.175 3.174 3.175 3.175 3.175 3.175 3.375 3175 Year 9 3.174 3.175 3.374 3.375 3.174 3175 3.174 3.375 3.374 3.175 3.174 3175 Year 10 3.375 3.174 3.175 3.174 3175 3.174 3.175 3.174 3175 3.174 3375 3.374 Year 11 3.174 3.175 3.174 3.175 3.374 3.175 3.174 3.175 3.174 3.175 3.174 3175 Year 12 3.175 3.374 3.175 3.174 3.175 3.174 3.175 3174 3.175 3.174 3.375 3174 Year 13 3.174 3.175 3.374 3.175 3.174 3.375 3.174 3175 3174 3.175 3.174 3.175 Year 141 3175 3.174 3.175 3.174 3.375 3.174 3.375 3.174 3375 3.174 3:375 3.374 Year 15 3.174 3.175 3.174 3.175 3.174 3.375 3,174 3.175 3.374 3175 3.174 3.175 Year 16 3.175 3.174 3.175 3.174 3.375 3.174 3.175 3.174 3.175 3.374 3.175 3.174 Year 17 3.174 3.175 3.174 3.175 3.174 3.175 3.174 3.175 3.174 3:175 3.174 3175 Year 18 3.375 3.374 3.175 3.174 3.175 3.174 3.175 3374 3.175 3.174 3175 3374 Year 19 3.174 3175 3.174 3375 3.174 3.175 3.174 3.175 3.174 3175 3.174 3.375 Year 20 3.375 3.174 3175 3.174 3.175 3.174 3.375 3.374 3.175 3,174 3.175 3.174 Year 21 3.174 3:175 3.174 3.175 3174 3175 3.174 3.175 3.174 3.375 3.374 3375 Year 22 3.375 3.174 3.175 3.174 3.175 3.174 3.175 3.174 3.175 3.174 3175 3.174 Year 23 3374 3.375 3.174 3.175 3.174 3.175 3174 3.115 3174 3.175 3174 3.375 Year 24 3.175 3.174 3.175 3.174 3.175 3.174 3.175 3.174 3.175 3.174 3.175 3.174 Year 25 3.174 3.175 3.174 3.175 3.174 3.175 3374 3.175 3174 3175 3174 3.175 Year 261 3.175 3.174 3.175 3.174 3,175 3.174 3375 3.174 3175 3.174 3.175 3174 Year 27 3.174 3.175 3.174 3.375 3.174 3.375 3374 3375 3174 3.175 3.174 3.175 Year 28 3.375 3:174 3.175 3.174 3.175 3.174 3375 3.174 3375 3.174 3.175 3.174 Year 29 3.174 3.175 3.174 3.175 3.174 3.375 3.174 3.175 3.174 3.175 3.174 3.175 Year 30 3.175 3.174 3.175 3.174 3.175 3.374 3.175 3.174 3.175 3.174 3.375 3.374 Year 31 3174 3,175 3:174 3375 3.174 3.175 3.174 3.175 3.174 3.175 3.374 3375 Year 32 1.720 1.984 2249 2.513 2778 3.042 3.175 3.174 3.175 3.374 3.175 3174 Year 33 0.132 0397 0.661 0.926 1.190 LASS TABLE 5 Nonresidential Real Property Mid-Month Convention Straight Line-39 Years (for assets placed in service on or after May 13, 1993) Month Property Placed in Service Month 1 Month 2 Month 3. Month 4 Month 51 Month 6 Month 7 Month S Month 9 Month 10 Month 11 Month 12 Year 1 Year 2-39 2.461% 2.247% 2033 1.819% 1605% 1391% 1.177% 0.963% 0.749% 0535% 0.321% 0.107% 2.564 2.564 2564 2.564 2.564 2.564 2564 2.564 2564 2.5641 2.564 2.564 Year 40 0.107 0.321 0.535 0.749 0.963 1.177 1391 1605 1819 2033 2247 2461 Dain's Diamond Bit Drilling purchased the following assets this year. Original Basis Purchase Date March 08 $ 92,300 Asset Drill bits (5-year) Drill bits (5-year) Commercial building July 11 June 15 97,300 266.000 Assume its taxable income for the year was $76,000 for purposes of computing the $179 expense (assume no bonus depreciation). (Use MACRS Table 1 Table 2. Table 3. Table 4 and Table 5) Note: Leave no answer blank. Enter zero if applicable. a. What is the maximum amount of 5179 expense Dain's may deduct for the year? $179 expense b. What is Dain's maximum depreciation deduction for the year (including 179 expense)? Note: Round your intermediate calculations and final answer to the nearest whole dollar amount. Depreciation Deduction (including $179 expense) c. If the February drill bits' original basis was $2,898,000, what is the maximum amount of $179 expense Dain's may deduct for the year? $179 expense d. If the February drill bits' original basis was $3,898,000, what is the maximum amount of $179 expense Dain's may deduct for the year? Maximum 5179 expense Table 1 MACRS Half-Year Convention Depreciation Rate for Recovery Period 3-Year 5-Year 7-Year 10-Year 15-Year 20-Year Year 1 33.33% 20.00% 14.29% 10.00% 5.00% 3.750% Year 2 44.45 32.00 24.49 18.00 9.50 7.219 Year 3 14.81 19.20 17.49 14.40 8.55 6.677 Year 4 7.41 11.52 12.49 11.52 7.70 6.177 Year 5 11.52 8.93 9.22 6.93 5.713 Year 6 5.76 8.92 7.37 6.23 5.285 Year 7 8.93 6.55 5.90 4.888 Year 8 4.46 6.55 5.90 4.522 Year 9 6.56 5.91 4.462 Year 10 6.55 5.90 4.461 Year 11 3.28 5.91 4.462 Year 12 5.90 4.461 Year 13 5.91 4.462 Year 14 5.90 4.461 Year 15 5.91 4.462 Year 16 2.95 4.461 Year 17 4.462 Year 18 4.461 Year 19 4.462 Year 20 4.461 Year 21 2.231 TABLE 2a MACRS Mid-Quarter Convention: For property placed in service during the first quarter Depreciation Rate for Recovery Period 5-Year 7-Year Year 1 35.00% 25.00% Year 2 26.00 21.43 Year 3 15.60 15.31 Year 4 11.01 10.93 Year 5 11.01 8.75 Year 6 1.38 8.74 Year 7 8.75 1.09 Year 8 TABLE 2b MACRS Mid-Quarter Convention: For property placed in service during the second quarter Depreciation Rate for Recovery Period 5-Year 7-Year Year 1 25.00% 17.85% Year 2 30.00 23.47 Year 3 18.00 16.76 Year 4 11.37 11.97 Year 5 11.37 8.87 Year 6 4.26 8.87. Year 7 8.87 Year 8 3.34 TABLE 2c MACRS Mid-Quarter Convention: For property placed in service during the thir Depreciation Rate for Recovery Period 5-Year 7-Year Year 1 15.00% 10.71% Year 2 34.00 25.51 Year 3 20.40 18.22 Year 4 12.24 13.02 Year 5 11.30 9.30 Year 6 7.06 8.85 Year 7 8.86 5.53 Year 8 TABLE 2d MACRS-Mid Quarter Convention: For property placed in service during the fourt Depreciation Rate for Recovery Period 5-Year 7-Year Year 1 5.00% 3.57% Year 2 38.00 27.55 Year 3 22.80 19.68 Year 4 13.68 14.06 Year 5 10.94 10.04 Year 6 9.58 8.73 Year 7 8.73 Year 8 7.64 TABLE 3 Residential Rental Property Mid-Month Convention Straight Line-27.5 Years Month Property Placed in Service Month 1 Month 2 Month 31 Month 4 Month 5 Month 6 Month 7 Month 8. Month 9 Month 10 Month 11 Month 12 Year 1 3.485% 3.182% 2.879% 2576% 2.273% 1970 % 1.667% 1.364% 1.061% 0.758% 0.455% 0.152% Year 2-9 3.636 3.636. 3.636 3.636 3.636 3.636 3.636 3.636 3.636 3.636 3.636 3.636 Year 10 3.637 3.637 3.637 3.637 3,637 3637 3.636 3.636 3.6361 3.636 3.636 3.636 Year 11 3.636 3.636 3.636 3.636 3.636 3636 3.637 3.637 3.637 3.637 3.637 3.637 Year 12 3.637 3.637 3.637 3.637 3.637 3.637 3.636 3.636 3,636 3.636 3.636 3.636 Year 13 3.636 3.636 3.636 3.636 3.636 3.636 3.637 3.637 3.637 3.637 3.637 3.637 Year 14 3.637 3.637 3.637 3.637 3.637 3.637 3.636 3.636 3.636 3.636 3.636 3.636 Year 15 3.636 3.636 3.636 3.636 3.636 3.636 3.637 3.637 3.637 3.637 3.637 3.637 Year 16 3.637 3.637 3.637 3.637 3.637 3.637 3.636 3.636 3.636 3.636 3,636 3.636 Year 17 3.636 3.636 3.636 3.636 3.636 3.636 3.637 3.637 3.637 3.637 3.637 3.637 Year 18 3.637 3.637 3.637 3.637 3.637 3.637 3.636 3.636 3.636 3.636 3.636 3.636 Year 19 3.636 3.636 3.636 3.636 3.636 3.636 3.637 3.637 3.637 3.637 3.637 3.637 Year 20 3.637 3.637 3.637 3.637 3.637 3.637 3.636 3.636 3.636 3.636 3.636 3.636 Year 21 3.636 3.636 3.636 3.636 3.036 3.636 3.637 3.637 3.637 3.637 3.637 3.637 Year 22 3.637 3.637 3.637 3.637 3.637 3.637 3.636 3.636 3.636 3.636 3.636 3.636 Year 23 3.636 3.636 3.636 3.636 3.636 3.636 3.637 3.637 3.637 3.637 3.637 3.637 Year 24 3.637 3.637 3.637 3.637 3.637 3.637 3.636 3.636 3.636 3.636 3.636 3.636 Year 25 3.636 3.636 3.636 3.636 3.636 3.636 3.637 3.637 3.637 3.637 3,637 3,637 Year 26 3.637 3.637 3.637 3.637 3.6371 3.637 3.636 3.636 3.636 3.636 3.636 3.636 Year 27 3.636 3.636 3.636 3.636 3.636 3.636 3.637 3.637 3,637 3.637 3.637 3.637 Year 28 1.97 2.273 2.576 2.879 3.182 3.485 3.636) 3.636 3.636 3.636 3.636 3.636 0.152 0.455 0.758 1.061 1.364 1.667 Year 29 Month 1 Month 2 Month 3 Month 4 Month 5 Month 6 Month 7 Meath N Month 9 Month 10 Month 11 Month 12 Year 1 3042% 2.778% 2513% 2249% 1984% 1.220% 1455% 1.190 0.926% 0.661% 0.397% 0132% Year 2-7 3.175 3.175 3.175 3.375 3.375 3.375 3.175 3475 3.175 3,375 3.175 3.175 Year 8 3.175 3.174 3.375 3.174 3.175 3.174 3.175 3.175 3.175 3.175 3.375 3175 Year 9 3.174 3.175 3.374 3.375 3.174 3175 3.174 3.375 3.374 3.175 3.174 3175 Year 10 3.375 3.174 3.175 3.174 3175 3.174 3.175 3.174 3175 3.174 3375 3.374 Year 11 3.174 3.175 3.174 3.175 3.374 3.175 3.174 3.175 3.174 3.175 3.174 3175 Year 12 3.175 3.374 3.175 3.174 3.175 3.174 3.175 3174 3.175 3.174 3.375 3174 Year 13 3.174 3.175 3.374 3.175 3.174 3.375 3.174 3175 3174 3.175 3.174 3.175 Year 141 3175 3.174 3.175 3.174 3.375 3.174 3.375 3.174 3375 3.174 3:375 3.374 Year 15 3.174 3.175 3.174 3.175 3.174 3.375 3,174 3.175 3.374 3175 3.174 3.175 Year 16 3.175 3.174 3.175 3.174 3.375 3.174 3.175 3.174 3.175 3.374 3.175 3.174 Year 17 3.174 3.175 3.174 3.175 3.174 3.175 3.174 3.175 3.174 3:175 3.174 3175 Year 18 3.375 3.374 3.175 3.174 3.175 3.174 3.175 3374 3.175 3.174 3175 3374 Year 19 3.174 3175 3.174 3375 3.174 3.175 3.174 3.175 3.174 3175 3.174 3.375 Year 20 3.375 3.174 3175 3.174 3.175 3.174 3.375 3.374 3.175 3,174 3.175 3.174 Year 21 3.174 3:175 3.174 3.175 3174 3175 3.174 3.175 3.174 3.375 3.374 3375 Year 22 3.375 3.174 3.175 3.174 3.175 3.174 3.175 3.174 3.175 3.174 3175 3.174 Year 23 3374 3.375 3.174 3.175 3.174 3.175 3174 3.115 3174 3.175 3174 3.375 Year 24 3.175 3.174 3.175 3.174 3.175 3.174 3.175 3.174 3.175 3.174 3.175 3.174 Year 25 3.174 3.175 3.174 3.175 3.174 3.175 3374 3.175 3174 3175 3174 3.175 Year 261 3.175 3.174 3.175 3.174 3,175 3.174 3375 3.174 3175 3.174 3.175 3174 Year 27 3.174 3.175 3.174 3.375 3.174 3.375 3374 3375 3174 3.175 3.174 3.175 Year 28 3.375 3:174 3.175 3.174 3.175 3.174 3375 3.174 3375 3.174 3.175 3.174 Year 29 3.174 3.175 3.174 3.175 3.174 3.375 3.174 3.175 3.174 3.175 3.174 3.175 Year 30 3.175 3.174 3.175 3.174 3.175 3.374 3.175 3.174 3.175 3.174 3.375 3.374 Year 31 3174 3,175 3:174 3375 3.174 3.175 3.174 3.175 3.174 3.175 3.374 3375 Year 32 1.720 1.984 2249 2.513 2778 3.042 3.175 3.174 3.175 3.374 3.175 3174 Year 33 0.132 0397 0.661 0.926 1.190 LASS TABLE 5 Nonresidential Real Property Mid-Month Convention Straight Line-39 Years (for assets placed in service on or after May 13, 1993) Month Property Placed in Service Month 1 Month 2 Month 3. Month 4 Month 51 Month 6 Month 7 Month S Month 9 Month 10 Month 11 Month 12 Year 1 Year 2-39 2.461% 2.247% 2033 1.819% 1605% 1391% 1.177% 0.963% 0.749% 0535% 0.321% 0.107% 2.564 2.564 2564 2.564 2.564 2.564 2564 2.564 2564 2.5641 2.564 2.564 Year 40 0.107 0.321 0.535 0.749 0.963 1.177 1391 1605 1819 2033 2247 2461
Expert Answer:

Related Book For 

Taxation Of Individuals And Business Entities 2016
ISBN: 9781259334870
7th Edition
Authors: Brian Spilker, Benjamin Ayers, John Robinson, Edmund Outslay, Ronald Worsham, John Barrick, Connie Weaver
Posted Date:
Students also viewed these accounting questions
-
Dains Diamond Bit Drilling purchased the following assets this year. Assume its taxable income for the year was $53,000 for purposes of computing the §179 expense (assume no bonus depreciation)....
-
Dain's Diamond Bit Drilling purchased the following assets this year. Assume its taxable income for the year was $53,000 before deducting any 179 expense (assume no bonus depreciation but assume that...
-
Aquarius -EAST B Capricornus Horizon Sagittarius SOUTH SUN Scorpius Libra WEST- E Description: If you could see both the Sun and the other stars during the day, this is what the sky would look like...
-
In early 2012, the spot exchange rate between the Swiss Franc and U.S. dollar was 1.0404 ($ per franc). Interest rates in the U.S. and Switzerland were 0.25% and 0% per annum, respectively, with...
-
(Pappus's Theorem) Assume that T0, U0, and V0 are collinear and that T1, U1, and V1 are collinear. Consider these three points: (i) the intersection V2 of the lines T0U1 and T1U0, (ii) the...
-
Find the natural frequencies of the stepped bar shown in Fig. 12.38 with the following data using consistent- and lumped-mass matrices: \(A_{1}=0.001 \mathrm{~m}^{2}, A_{2}=0.0006 \mathrm{~m}^{2}\),...
-
Yoshi Company completed the following transactions and events involving its delivery trucks. 2012 Jan. 1 Paid $ 20,515 cash plus $ 1,485 in sales tax for a new delivery truck estimated to have a...
-
What are the key factors that influence ethical decision-making at both individual and organizational levels, and how do these factors interplay to shape organizational outcomes ?
-
American gross domestic product (GDP) that we spend on health care each year impact our nation's economy overall? What other areas of our economy may currently be suffering because of so much medical...
-
Long Island Rum accounts for production costs using the FIFO method of process costing. Direct materials are all added at the beginning of production and conversion costs are incurred uniformly...
-
Extra credit: Who sued the production of Straight Outta Compton for a false portrayal of him? You are going to have to look this one up.
-
Assuming the variable costs, the depreciation expense, and the rent and utilties would all remain the same, but the bonus is based on the variable cost of goods manufactured per unit decreasing by...
-
Wells Technical Institute (WTI), a school owned by Tristana Wells, provides training to individuals who pay tuition directly to the school. WTI also offers training to groups in off-site locations....
-
Question 1: List six (6) sources of external information to determine OHS requirements, policies and procedures. Question 2: Mention the eight (8) key sources of information for hazard...
-
What was the primary purpose of the FCPA?
-
Why is it important to understand the macro-environment when making decisions about an international retail venture?
-
A pressure-vessel head is supported by a set of steel cables of length \(2 \mathrm{~m}\) as shown in Fig. 2.75. The time period of axial vibration (in vertical direction) is found to vary from \(5...
-
The crate, of mass \(250 \mathrm{~kg}\), hanging from a helicopter (shown in Fig. 2.74(a)) can be modeled as shown in Fig. 2.74(b). The rotor blades of the helicopter rotate at \(300 \mathrm{rpm}\)....
-
The inclined manometer, shown in Fig. 2.73, is used to measure pressure. If the total length of mercury in the tube is \(L\), find an expression for the natural frequency of oscillation of the...

Study smarter with the SolutionInn App