

Date SP500 IBM Target XYZ 22-May-06 -0.39 0.12 -0.06 0.32 15-May-06 -1.87 3.50 -5.64 0.24 5...
Fantastic news! We've Found the answer you've been seeking!
Question:
Transcribed Image Text:
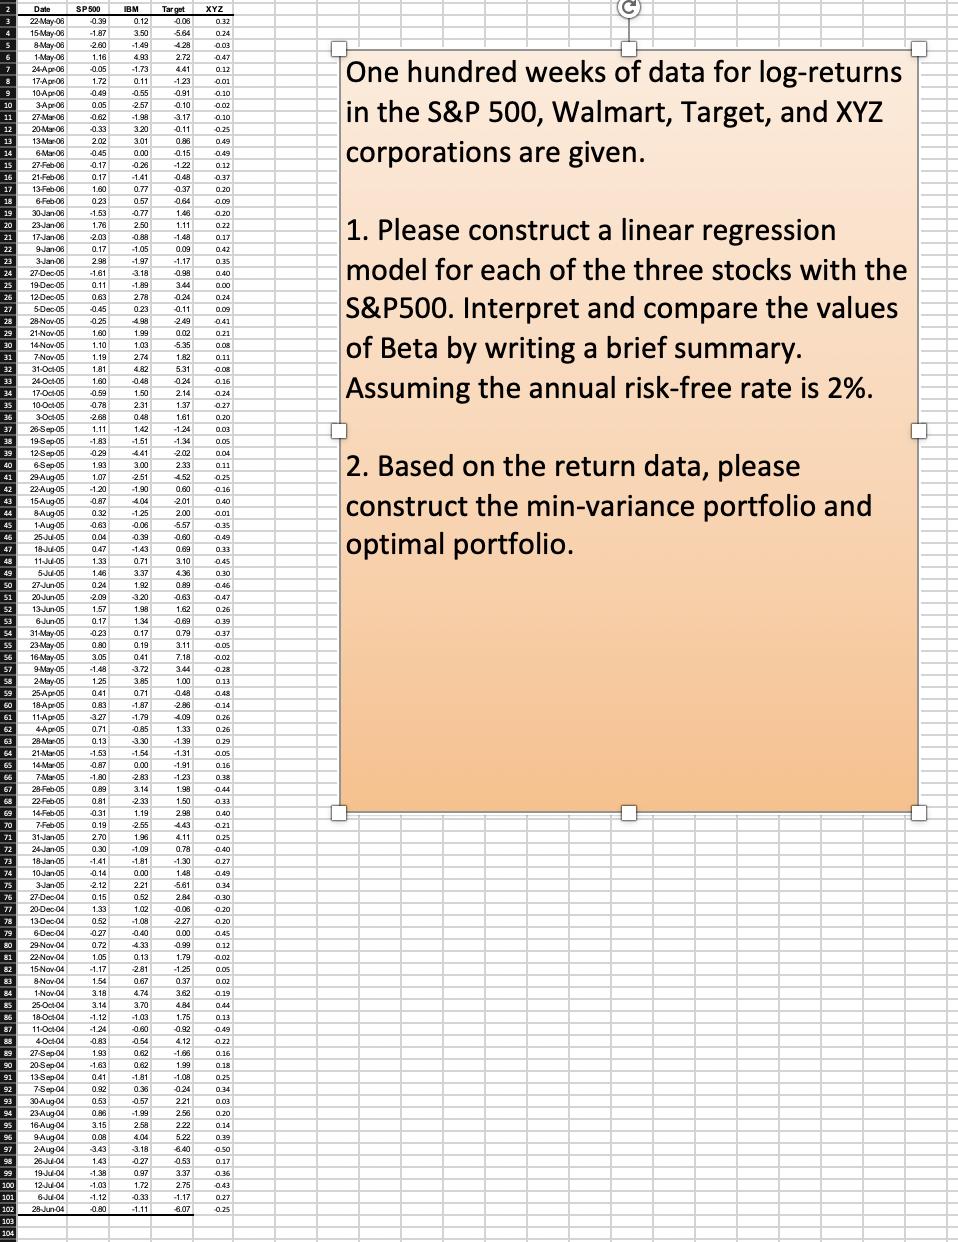
Date SP500 IBM Target XYZ 22-May-06 -0.39 0.12 -0.06 0.32 15-May-06 -1.87 3.50 -5.64 0.24 5 8-May-06 -2.60 -1.49 428 -0.03 6 1-May-06 1.16 4.93 2.72 -0.47 7 24-Apr06 -0.05 -1.73 4.41 0.12 17-Apr-06 1.72 0.11 -1.23 -0.01 10-Apr-06 -0.49 -0.55 -0.91 -0.10 10 3-Apr-06 0.05 -2.57 -0.10 -0.02 11 27-Mar-06 -0.62 -1.98 -3.17 -0.10 12 20-Mar-06 -0.33 3.20 -0.11 -0.25 13 13-Mar-06 2.02 3.01 0.86 0.49 14 6-Mar-06 -0.45 0.00 -0.15 -0.49 15 27-Feb-06 -0.17 -0.26 -1.22 0.12 16 21-Feb-06 0.17 -1.41 -0.48 0.37 17 13-Feb-06 1.601 0.77 -0.37 0.20 18 6-Feb-06 0.23 0.57 -0.64 -0.09 19 30-Jan-06 -1.53 -0.77 1.46 -0.20 20 23-Jan-06 1.76 2.50 1.11 0.22 21 17-Jan-06 -2.03 -0.88 -1.48 0.17 22 9-Jan-06 0.17 -1.05 0.09 0.42 23 3-Jan-06 2.98 -1.97 -1.17 0.35 24 27-Dec-05 -1.61 3.18 -0.98 0.40 25 19-Dec-05 0.11 -1.89 3.44 0.00 26 12-Dec-05 0.63 2.78 -0.24 0.24 27 5-Dec-05 -0.45 0.23 -0.11 0.09 28 28-Nov-05 -0.25 -4.98 -2.49 -0.41 29 21-Nov-05 1.60 1.99 0.02 0.21 30 14-Nov-05 1.10 1.03 -5.35 0.08 31 7-Nov-05 1.19 2.74 1.82 0.11 32 31-Oct-05 1.81 4.82 5.31 -0.08 33 24-Oct-05 1.60 -0.48 -0.24 -0.16 34 17-Oct-05 -0.59 1.50 2.14 -0.24 35 10-Oct-05 -0.78 2.31 1.37 -0.27 36 3-Oct-05 -2.68 0.48 1.61 0.20 37 26-Sep-05 1.11 1.42 -1.24 0.03 19-Sep-05 -1.83 -1.51 -1.34 0.05 39 12-Sep-05 -0.29 4.41 -2.02 0.04 40 6-Sep-05 1.931 3.00 2.33 0.11 41 29-Aug-05 1.07 -2.51 4.52 0.25 42 22-Aug-05 -1.20 -1.90 0.60 -0.16 43 15-Aug-05 -0.87 -4.04 -2.01 0.40 44 8-Aug-05 0.32 -1.25 2.00 -0.01 45 1-Aug-05 -0.63 -0.06 -5.57 -0.35 46 25-Jul-05 0.04 -0.39 -0.60 -0.49 47 18-Jul-05 0.47 -1.43 0.69 0.33 48 11-Ju-05 1.33 0.71 3.10 -0.45 49 5-Jul-05 1.46 3.37 4.36 0.30 50 27-Jun-05 0.24 1.92 0.89 -0.46 51 20-Jun-05 -2.09 3.20 -0.63 -0.47 52 13-Jun-05 1.57 1.98 1.62 0.26 53 6-Jun-05 0.17 1.34 -0.69 -0.39 54 31-May-05 -0.23 0.17 0.79 0.37 55 23-May-05 0.80 0.19 3.11 -0.05 56 16-May-05 3.05 0.41 7.18 -0.02 57 9-May-05 -1.48 -3.72 3.44 -0.28 58 2-May-05 1.25 3.85 1.00 0.13 59 25-Apr 05 0.41 0.71 -0.48 0.48 60 18-Apr05 0.83 -1.87 -2.86 -0.14 61 11-Apr05 3.27 -1.79 4.09 0.26 62 4-Apr-05 0.71 -0.85 1.33 0.26 63 28-Ma-05 0.13 -3.30 -1.39 0.29 64 21-Ma-05 -1.53 -1.54 -1.31 -0.05 65 14-Mar-05 -0.87 0.00 -1.91 0.16 66 7-Ma-05 -1.80 -2.83 -1.23 0.38 67 28-Feb-05 0.89 3.14 1.98 0.44 68 22-Feb-05 0.81 -2.33 1.50 -0.33 69 14-Feb-05 -0.31 1.19 2.98 0.40 70 7-Feb-05 0.19 -2.55 4.43 -0.21 71 31-Jan-05 2.70 1.96 4.11 0.25 72 24-Jan-05 0.30 -1.09 0.78 -0.40 73 18-Jan-05 -1.41 -1.81 -1.30 -0.27 74 10-Jan-05 -0.14 0.00 1.48 -0.49 75 3-Jan-05 -2.12 2.21 -5.61 0.34 76 27-Dec-04 0.15 0.52 2.84 -0.30 77 20-Dec-04 1.33 1.02 -0.06 -0.20 78 13-Dec-04 0.52 -1.08 -2.27 -0.20 79 6-Dec-04 -0.27 -0.40 0.00 -0.45 80 29-Nov-04 0.72 -4.33 -0.99 0.12 81 22-Nov-04 1.05 0.13 1.79 -0.02 82 15-Nov-04 -1.17 -2.81 -1.25 0.05 83 8-Nov-04 1.54 0.67 0.37 0.02 84 1-Nov-04 3.18 4.74 3.62 -0.19 85 25-Oct-04 3.14 3.70 4.84 0.44 86 18-Oct-04 -1.12 -1.03 1.75 0.13 87 11-Oct-04 -1.24 -0.60 -0.92 -0.49 4-Oct-04 -0.83 -0.54 4.12 -0.22 89 27-Sep-04 1.93 0.62 -1.66 0.16 90 20-Sep-04 -1.63 0.62 1.99 0.18 91 13-Sep-04 0.41 -1.81 -1.08 0.25 92 7-Sep-04 0.92 0.36 -0.24 0.34 93 30-Aug-04 0.53 -0.57 2.21 0.03 94 23-Aug-04 0.86 -1.99 2.56 0.20 95 16-Aug-04 3.15 2.58 2.22 0.14 96 9-Aug-04 0.08 4.04 5.22 0.39 97 2-Aug-04 3.43 3.18 -6.40 -0.50 98 26-Jul-04 1.43 -0.27 -0.53 0.17 99 19-Jul-04 -1.38 0.97 3.37 -0.36 100 12-Jul-04 -1.03 1.72 2.75 -0.43 101 6-Jul-04 -1.12 -0.33 -1.17 0.27 102 28-Jun-04 -0.80 -1.11 -6.07 -0.25 103 104 One hundred weeks of data for log-returns in the S&P 500, Walmart, Target, and XYZ corporations are given. 1. Please construct a linear regression model for each of the three stocks with the S&P500. Interpret and compare the values of Beta by writing a brief summary. Assuming the annual risk-free rate is 2%. 2. Based on the return data, please construct the min-variance portfolio and optimal portfolio. Date SP500 IBM Target XYZ 22-May-06 -0.39 0.12 -0.06 0.32 15-May-06 -1.87 3.50 -5.64 0.24 5 8-May-06 -2.60 -1.49 428 -0.03 6 1-May-06 1.16 4.93 2.72 -0.47 7 24-Apr06 -0.05 -1.73 4.41 0.12 17-Apr-06 1.72 0.11 -1.23 -0.01 10-Apr-06 -0.49 -0.55 -0.91 -0.10 10 3-Apr-06 0.05 -2.57 -0.10 -0.02 11 27-Mar-06 -0.62 -1.98 -3.17 -0.10 12 20-Mar-06 -0.33 3.20 -0.11 -0.25 13 13-Mar-06 2.02 3.01 0.86 0.49 14 6-Mar-06 -0.45 0.00 -0.15 -0.49 15 27-Feb-06 -0.17 -0.26 -1.22 0.12 16 21-Feb-06 0.17 -1.41 -0.48 0.37 17 13-Feb-06 1.601 0.77 -0.37 0.20 18 6-Feb-06 0.23 0.57 -0.64 -0.09 19 30-Jan-06 -1.53 -0.77 1.46 -0.20 20 23-Jan-06 1.76 2.50 1.11 0.22 21 17-Jan-06 -2.03 -0.88 -1.48 0.17 22 9-Jan-06 0.17 -1.05 0.09 0.42 23 3-Jan-06 2.98 -1.97 -1.17 0.35 24 27-Dec-05 -1.61 3.18 -0.98 0.40 25 19-Dec-05 0.11 -1.89 3.44 0.00 26 12-Dec-05 0.63 2.78 -0.24 0.24 27 5-Dec-05 -0.45 0.23 -0.11 0.09 28 28-Nov-05 -0.25 -4.98 -2.49 -0.41 29 21-Nov-05 1.60 1.99 0.02 0.21 30 14-Nov-05 1.10 1.03 -5.35 0.08 31 7-Nov-05 1.19 2.74 1.82 0.11 32 31-Oct-05 1.81 4.82 5.31 -0.08 33 24-Oct-05 1.60 -0.48 -0.24 -0.16 34 17-Oct-05 -0.59 1.50 2.14 -0.24 35 10-Oct-05 -0.78 2.31 1.37 -0.27 36 3-Oct-05 -2.68 0.48 1.61 0.20 37 26-Sep-05 1.11 1.42 -1.24 0.03 19-Sep-05 -1.83 -1.51 -1.34 0.05 39 12-Sep-05 -0.29 4.41 -2.02 0.04 40 6-Sep-05 1.931 3.00 2.33 0.11 41 29-Aug-05 1.07 -2.51 4.52 0.25 42 22-Aug-05 -1.20 -1.90 0.60 -0.16 43 15-Aug-05 -0.87 -4.04 -2.01 0.40 44 8-Aug-05 0.32 -1.25 2.00 -0.01 45 1-Aug-05 -0.63 -0.06 -5.57 -0.35 46 25-Jul-05 0.04 -0.39 -0.60 -0.49 47 18-Jul-05 0.47 -1.43 0.69 0.33 48 11-Ju-05 1.33 0.71 3.10 -0.45 49 5-Jul-05 1.46 3.37 4.36 0.30 50 27-Jun-05 0.24 1.92 0.89 -0.46 51 20-Jun-05 -2.09 3.20 -0.63 -0.47 52 13-Jun-05 1.57 1.98 1.62 0.26 53 6-Jun-05 0.17 1.34 -0.69 -0.39 54 31-May-05 -0.23 0.17 0.79 0.37 55 23-May-05 0.80 0.19 3.11 -0.05 56 16-May-05 3.05 0.41 7.18 -0.02 57 9-May-05 -1.48 -3.72 3.44 -0.28 58 2-May-05 1.25 3.85 1.00 0.13 59 25-Apr 05 0.41 0.71 -0.48 0.48 60 18-Apr05 0.83 -1.87 -2.86 -0.14 61 11-Apr05 3.27 -1.79 4.09 0.26 62 4-Apr-05 0.71 -0.85 1.33 0.26 63 28-Ma-05 0.13 -3.30 -1.39 0.29 64 21-Ma-05 -1.53 -1.54 -1.31 -0.05 65 14-Mar-05 -0.87 0.00 -1.91 0.16 66 7-Ma-05 -1.80 -2.83 -1.23 0.38 67 28-Feb-05 0.89 3.14 1.98 0.44 68 22-Feb-05 0.81 -2.33 1.50 -0.33 69 14-Feb-05 -0.31 1.19 2.98 0.40 70 7-Feb-05 0.19 -2.55 4.43 -0.21 71 31-Jan-05 2.70 1.96 4.11 0.25 72 24-Jan-05 0.30 -1.09 0.78 -0.40 73 18-Jan-05 -1.41 -1.81 -1.30 -0.27 74 10-Jan-05 -0.14 0.00 1.48 -0.49 75 3-Jan-05 -2.12 2.21 -5.61 0.34 76 27-Dec-04 0.15 0.52 2.84 -0.30 77 20-Dec-04 1.33 1.02 -0.06 -0.20 78 13-Dec-04 0.52 -1.08 -2.27 -0.20 79 6-Dec-04 -0.27 -0.40 0.00 -0.45 80 29-Nov-04 0.72 -4.33 -0.99 0.12 81 22-Nov-04 1.05 0.13 1.79 -0.02 82 15-Nov-04 -1.17 -2.81 -1.25 0.05 83 8-Nov-04 1.54 0.67 0.37 0.02 84 1-Nov-04 3.18 4.74 3.62 -0.19 85 25-Oct-04 3.14 3.70 4.84 0.44 86 18-Oct-04 -1.12 -1.03 1.75 0.13 87 11-Oct-04 -1.24 -0.60 -0.92 -0.49 4-Oct-04 -0.83 -0.54 4.12 -0.22 89 27-Sep-04 1.93 0.62 -1.66 0.16 90 20-Sep-04 -1.63 0.62 1.99 0.18 91 13-Sep-04 0.41 -1.81 -1.08 0.25 92 7-Sep-04 0.92 0.36 -0.24 0.34 93 30-Aug-04 0.53 -0.57 2.21 0.03 94 23-Aug-04 0.86 -1.99 2.56 0.20 95 16-Aug-04 3.15 2.58 2.22 0.14 96 9-Aug-04 0.08 4.04 5.22 0.39 97 2-Aug-04 3.43 3.18 -6.40 -0.50 98 26-Jul-04 1.43 -0.27 -0.53 0.17 99 19-Jul-04 -1.38 0.97 3.37 -0.36 100 12-Jul-04 -1.03 1.72 2.75 -0.43 101 6-Jul-04 -1.12 -0.33 -1.17 0.27 102 28-Jun-04 -0.80 -1.11 -6.07 -0.25 103 104 One hundred weeks of data for log-returns in the S&P 500, Walmart, Target, and XYZ corporations are given. 1. Please construct a linear regression model for each of the three stocks with the S&P500. Interpret and compare the values of Beta by writing a brief summary. Assuming the annual risk-free rate is 2%. 2. Based on the return data, please construct the min-variance portfolio and optimal portfolio.
Expert Answer:

Related Book For 

Understanding Basic Statistics
ISBN: 9781111827021
6th Edition
Authors: Charles Henry Brase, Corrinne Pellillo Brase
Posted Date:
Students also viewed these finance questions
-
This assignment requires you to complete the 2022 tax reporting for a fictional woman named Anna Smith. Question 1 T1 - step 4 - line 66 This is Anna's taxable income Answer: Question 2 T1 - step...
-
Adventure Rafting runs rafts on the Colorado River. It has eight rafts in its inventory. The demand for rafts during the busy months of June and July has been either 4, 5, 6, 7 or 8, with...
-
My question is how to write the code in WareHouse.java This is WareHouse.java package warehouse; /* * * This class implements a warehouse on a Hash Table like structure, * where each entry of the...
-
Karamazov Semiconductors is considering an investment to expand its existing line of business. The investment will cost $10 million and is expected to produce after-tax cash flows of $1 million per...
-
What impact do investors expectations about inflation have on a firms cost of debt? Is the firms cost of equity affected? Explain.
-
What are the major contents of liquid fuels? Explain in detail.
-
What is the difference between expenses and cash flow?
-
Madsen Company had five convertible securities outstanding during all of 2007. It paid the appropriate interest (and amortized any related premium or discount using the straight-line method) and...
-
SwissAir Founded in 1931, SwissAir was the national airline of Switzerland until it was dissolved in 2002.For most of its existence, SwissAir was a very respected, stable, and profitable business,...
-
Perry decides to wait until his niece starts kindergarten to start her college fund. If he is depositing $100 per month into an account that pays 10%, how much will there be for her in 13 years?...
-
Consider the second-order analog system described by Extra \left or missing ight where T ( s ) T ( s ) is the closed-loop transfer function and G p ( s ) G p ( s ) is the plant transfer function....
-
When was the first adoption statute in this country passed? What factors prompted its passage?
-
Why were adoptions not recognized under English common law?
-
What purpose did adoptions serve in ancient Rome?
-
Explain how safe haven laws work.
-
Read the case study Richter: Information Technology at Hungarys Largest Pharma and answer the following question: How does the organization ensure the accuracy of the data it stores?

Study smarter with the SolutionInn App