

Derive, showing all working, the magnitude and phase spectrum of the signal up to twelve (12) harmonics.
Fantastic news! We've Found the answer you've been seeking!
Question:
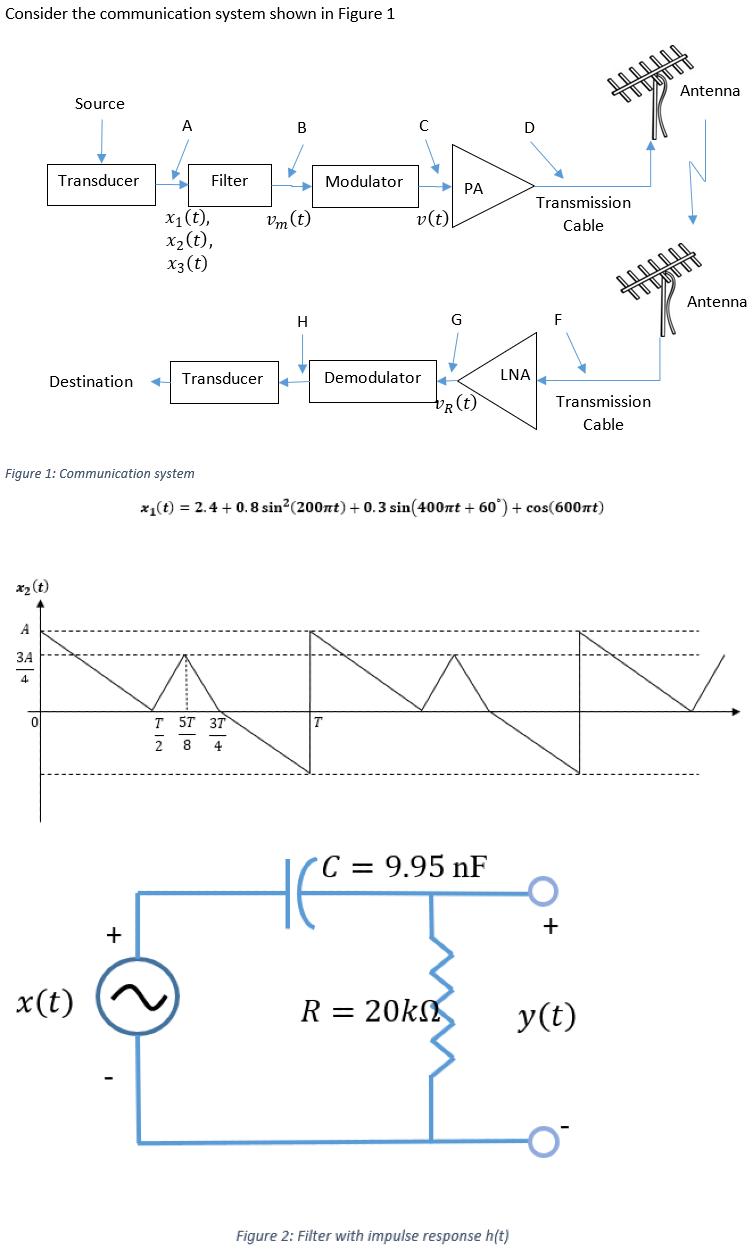
- Derive, showing all working, the magnitude and phase spectrum of the signal up to twelve (12) harmonics. Provide a fully labelled sketch. Tabulate the calculated Fourier coefficients. Also provide plots of the signals in the time domain up to three full cycles.
(25 marks)
- MATLAB would be used for the functions
- Write a function called [time, signal_output]=plot_signal2 that is called like this plot_signal2(). This function plots and outputs signal 2 in the time domain using the Fourier series and the number of harmonics, n = 2000. Set the time resolution to 1/fs where fs (sampling frequency) = 44100 and the time from 0 to 0.03 seconds.
- (15 marks)
- Write a function called [frequency,magnitude]=plot_signal2_mag_spec that is called like this plot_signal2_mag_spec(). This function plots the magnitude spectrum of signal 2 and outputs the frequency vector and the magnitude vector. Do not use the fft_wrapper function. You will have to convert the equation from its trigonometric form to its harmonic form. Set the number of harmonics (n) to 300 and the frequency range from 0 to (n×f0) Hz, where f0 is the fundamental frequency. Set the frequency resolution to the fundamental frequency.
Expert Answer:

Related Book For 
Fundamentals of Electric Circuits
ISBN: 978-0078028229
6th edition
Authors: Charles K Alexander, Matthew Sadiku
Posted Date:
