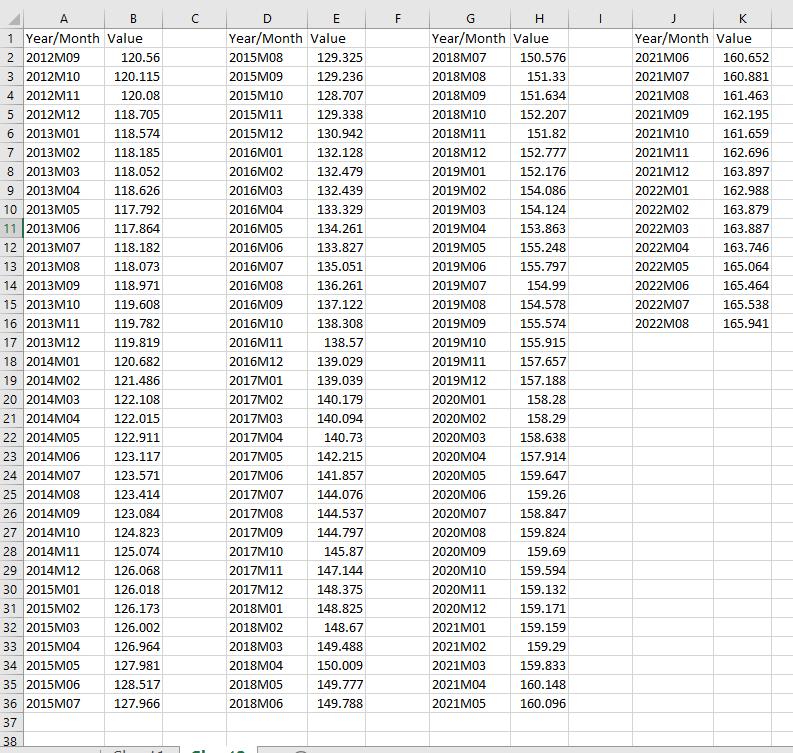
Derive the first stocks monthly VaR at a 98% confidence level and interpret your results in dollars.
Fantastic news! We've Found the answer you've been seeking!
Question:
Derive the first stock’s monthly VaR at a 98% confidence level and interpret your results in dollars. Assume the investment for this stock is $1,000,000. To save time,
you do not need to derive the VaRs for the second and third stock.
(The columns continue from the bottom of the previous to the top of the next)
Transcribed Image Text:
A B 1 Year/Month Value 2 2012M09 3 2012M10 4 2012M11 5 2012M12 6 2013M01 7 2013M02 8 2013M03 9 2013M04 10 2013M05 11 2013M06 12 2013M07 13 2013M08 14 2013M09 15 2013M10 16 2013M11 17 2013M12 18 2014M01 19 2014M02 20 2014M03 21 2014M04 22 2014M05 23 2014M06 24 2014M07 25 2014M08 26 2014M09 27 2014M10 28 2014M11 29 2014M12 30 2015M01 31 2015M02 32 2015M03 33 2015M04 34 2015M05 35 2015M06 36 2015M07 m m 678 37 38 120.56 120.115 120.08 118.705 118.574 118.185 118.052 118.626 117.792 117.864 118.182 118.073 118.971 119.608 119.782 119.819 120.682 121.486 122.108 122.015 122.911 123.117 123.571 123.414 123.084 124.823 125.074 126.068 126.018 126.173 126.002 126.964 127.981 128.517 127.966 al с E Year/Month Value 2015M08 2015M09 2015M10 2015M11 2015M12 2016M01 2016M02 2016M03 2016M04 2016M05 2016M06 2016M07 2016M08 2016M09 2016M10 2016M11 2016M12 2017M01 2017M02 2017M03 2017M04 2017M05 2017M06 2017M07 2017M08 2017M09 2017M10 2017M11 2017M12 2018M01 2018M02 2018M03 2018M04 2018M05 2018M06 129.325 129.236 128.707 129.338 130.942 132.128 132.479 132.439 133.329 134.261 133.827 135.051 136.261 137.122 138.308 138.57 139.029 139.039 140.179 140.094 140.73 142.215 141.857 144.076 144.537 144.797 145.87 147.144 148.375 148.825 148.67 149.488 150.009 149.777 149.788 F LL G H Year/Month Value 2018M07 2018M08 2018M09 2018M10 2018M11 2018M12 2019M01 2019M02 2019M03 2019M04 2019M05 2019M06 2019M07 2019M08 2019M09 2019M10 2019M11 2019M12 2020M01 2020M02 2020M03 2020M04 2020M05 2020M06 2020M07 2020M08 2020M09 2020M10 2020M11 2020M12 2021M01 2021M02 2021M03 2021M04 2021M05 150.576 151.33 151.634 152.207 151.82 152.777 152.176 154.086 154.124 153.863 155.248 155.797 154.99 154.578 155.574 155.915 157.657 157.188 158.28 158.29 158.638 157.914 159.647 159.26 158.847 159.824 159.69 159.594 159.132 159.171 159.159 159.29 159.833 160.148 160.096 J Year/Month Value 2021M06 2021M07 2021M08 2021M09 2021M10 2021M11 2021M12 2022M01 2022M02 2022M03 2022M04 2022M05 2022M06 2022M07 2022M08 160.652 160.881 161.463 162.195 161.659 162.696 163.897 162.988 163.879 163.887 163.746 165.064 165.464 165.538 165.941 A B 1 Year/Month Value 2 2012M09 3 2012M10 4 2012M11 5 2012M12 6 2013M01 7 2013M02 8 2013M03 9 2013M04 10 2013M05 11 2013M06 12 2013M07 13 2013M08 14 2013M09 15 2013M10 16 2013M11 17 2013M12 18 2014M01 19 2014M02 20 2014M03 21 2014M04 22 2014M05 23 2014M06 24 2014M07 25 2014M08 26 2014M09 27 2014M10 28 2014M11 29 2014M12 30 2015M01 31 2015M02 32 2015M03 33 2015M04 34 2015M05 35 2015M06 36 2015M07 m m 678 37 38 120.56 120.115 120.08 118.705 118.574 118.185 118.052 118.626 117.792 117.864 118.182 118.073 118.971 119.608 119.782 119.819 120.682 121.486 122.108 122.015 122.911 123.117 123.571 123.414 123.084 124.823 125.074 126.068 126.018 126.173 126.002 126.964 127.981 128.517 127.966 al с E Year/Month Value 2015M08 2015M09 2015M10 2015M11 2015M12 2016M01 2016M02 2016M03 2016M04 2016M05 2016M06 2016M07 2016M08 2016M09 2016M10 2016M11 2016M12 2017M01 2017M02 2017M03 2017M04 2017M05 2017M06 2017M07 2017M08 2017M09 2017M10 2017M11 2017M12 2018M01 2018M02 2018M03 2018M04 2018M05 2018M06 129.325 129.236 128.707 129.338 130.942 132.128 132.479 132.439 133.329 134.261 133.827 135.051 136.261 137.122 138.308 138.57 139.029 139.039 140.179 140.094 140.73 142.215 141.857 144.076 144.537 144.797 145.87 147.144 148.375 148.825 148.67 149.488 150.009 149.777 149.788 F LL G H Year/Month Value 2018M07 2018M08 2018M09 2018M10 2018M11 2018M12 2019M01 2019M02 2019M03 2019M04 2019M05 2019M06 2019M07 2019M08 2019M09 2019M10 2019M11 2019M12 2020M01 2020M02 2020M03 2020M04 2020M05 2020M06 2020M07 2020M08 2020M09 2020M10 2020M11 2020M12 2021M01 2021M02 2021M03 2021M04 2021M05 150.576 151.33 151.634 152.207 151.82 152.777 152.176 154.086 154.124 153.863 155.248 155.797 154.99 154.578 155.574 155.915 157.657 157.188 158.28 158.29 158.638 157.914 159.647 159.26 158.847 159.824 159.69 159.594 159.132 159.171 159.159 159.29 159.833 160.148 160.096 J Year/Month Value 2021M06 2021M07 2021M08 2021M09 2021M10 2021M11 2021M12 2022M01 2022M02 2022M03 2022M04 2022M05 2022M06 2022M07 2022M08 160.652 160.881 161.463 162.195 161.659 162.696 163.897 162.988 163.879 163.887 163.746 165.064 165.464 165.538 165.941 A B 1 Year/Month Value 2 2012M09 3 2012M10 4 2012M11 5 2012M12 6 2013M01 7 2013M02 8 2013M03 9 2013M04 10 2013M05 11 2013M06 12 2013M07 13 2013M08 14 2013M09 15 2013M10 16 2013M11 17 2013M12 18 2014M01 19 2014M02 20 2014M03 21 2014M04 22 2014M05 23 2014M06 24 2014M07 25 2014M08 26 2014M09 27 2014M10 28 2014M11 29 2014M12 30 2015M01 31 2015M02 32 2015M03 33 2015M04 34 2015M05 35 2015M06 36 2015M07 m m 678 37 38 120.56 120.115 120.08 118.705 118.574 118.185 118.052 118.626 117.792 117.864 118.182 118.073 118.971 119.608 119.782 119.819 120.682 121.486 122.108 122.015 122.911 123.117 123.571 123.414 123.084 124.823 125.074 126.068 126.018 126.173 126.002 126.964 127.981 128.517 127.966 al с E Year/Month Value 2015M08 2015M09 2015M10 2015M11 2015M12 2016M01 2016M02 2016M03 2016M04 2016M05 2016M06 2016M07 2016M08 2016M09 2016M10 2016M11 2016M12 2017M01 2017M02 2017M03 2017M04 2017M05 2017M06 2017M07 2017M08 2017M09 2017M10 2017M11 2017M12 2018M01 2018M02 2018M03 2018M04 2018M05 2018M06 129.325 129.236 128.707 129.338 130.942 132.128 132.479 132.439 133.329 134.261 133.827 135.051 136.261 137.122 138.308 138.57 139.029 139.039 140.179 140.094 140.73 142.215 141.857 144.076 144.537 144.797 145.87 147.144 148.375 148.825 148.67 149.488 150.009 149.777 149.788 F LL G H Year/Month Value 2018M07 2018M08 2018M09 2018M10 2018M11 2018M12 2019M01 2019M02 2019M03 2019M04 2019M05 2019M06 2019M07 2019M08 2019M09 2019M10 2019M11 2019M12 2020M01 2020M02 2020M03 2020M04 2020M05 2020M06 2020M07 2020M08 2020M09 2020M10 2020M11 2020M12 2021M01 2021M02 2021M03 2021M04 2021M05 150.576 151.33 151.634 152.207 151.82 152.777 152.176 154.086 154.124 153.863 155.248 155.797 154.99 154.578 155.574 155.915 157.657 157.188 158.28 158.29 158.638 157.914 159.647 159.26 158.847 159.824 159.69 159.594 159.132 159.171 159.159 159.29 159.833 160.148 160.096 J Year/Month Value 2021M06 2021M07 2021M08 2021M09 2021M10 2021M11 2021M12 2022M01 2022M02 2022M03 2022M04 2022M05 2022M06 2022M07 2022M08 160.652 160.881 161.463 162.195 161.659 162.696 163.897 162.988 163.879 163.887 163.746 165.064 165.464 165.538 165.941
Expert Answer:
Answer rating: 100% (QA)
To calculate the first stocks monthly VaR at a 98 confidence level we need to perform the following ... View the full answer
Related Book For
Financial Reporting Financial Statement Analysis and Valuation a strategic perspective
ISBN: 978-1337614689
9th edition
Authors: James M. Wahlen, Stephen P. Baginski, Mark Bradshaw
Posted Date:
Students also viewed these accounting questions
-
The following additional information is available for the Dr. Ivan and Irene Incisor family from Chapters 1-5. Ivan's grandfather died and left a portfolio of municipal bonds. In 2012, they pay Ivan...
-
A researcher wanted to find out if there was difference between older movie goers and younger movie goers with respect to their estimates of a successful actors income. The researcher first...
-
Use the attached "words.txt" file to store the words along with their ranks in an AVL tree. Then provide the user the option to search for any word. If the word exists the program displays the rank...
-
The curve known as the Bernoulli spiral (Figure 7) has parametrization r(t) = (e t cos 4 t , e t sin 4t). (a) Evaluate s(1) = ||' (u) du. It is convenient to take lower limit -co because _lim_r(1) =...
-
Draw the shear and bending-moment diagrams for the beam AB, and determine the maximum absolute values of the shear and bending moment. |4 kN 2 kN 1 kN A. 500 mm 500 mm 500 mm
-
Professionals in the UK, for example, doctors, solicitors, accountants, etc., normally work within partnerships. Many tradesmen, such as plumbers, car mechanics, carpenters, and so on, operate as...
-
What are the advantages and disadvantages of permitting counter-claims for insurance claims to be offset in financial reports? Consider the views of management, shareholders and a non-governmental...
-
How important was Ians knowledge of the billing procedures used within the steel industry in his being able to establish his business? Given his cash position when he opened his business, do you...
-
What are closed-end funds? Why do some closed-end funds use leverage to raise more funds rather than issue new shares like mutual funds? Why might the price of a share of a closed-end fund diverge...
-
Retro Productions Ltd. is a Vancouver-based furniture manufacturer. The company reported the following information on its trial balance for 11 months of the year ended November 30, 2018. Retro...
-
Explain whether private health care is more costly than public health care because private health care providers make profits.
-
a) Suppose we have a distillation process where the objective is to separate components of a mixture in the input stream. The relationship between the input variable, temperature, and the output...
-
What are the key factors driving organizational learning and knowledge management initiatives, and how can organizations foster a learning culture to enhance their competitive advantage in the...
-
Forecast pro-forma unlevered income statements for the next 3 years (2020-2022) using percent of sales forecasting (assume it is the beginning of 2020). You don't need to forecast the balance sheet....
-
1. Debug the following code by compiling it for debugging and executing it within a debugger. At which line of code does the program crash? Why does it crash there? #include #include main(int argc,...
-
Marketing mix analysis mini-study case for BMW company 1- Brand Management: Describe the company's 3 Cs of its brand communication, contribution, and competitive advantage; the concept of brand...
-
On December 31, Sleek Corporation reported, on its annual report, the following (in millions): Year 2 Year 1 Operating income $4,589.1 $3,961.1 Net earnings $3,100.8 $2,759.3 Calculate year-over-year...
-
Refrigerant R-12 at 30C, 0.75 MPa enters a steady flow device and exits at 30C, 100 kPa. Assume the process is isothermal and reversible. Find the change in availability of the refrigerant.
-
Sunbeam Corporation manufactures and sells a variety of small household appliances, including toasters, food processors, and waffle grills. Exhibit 3.26 presents a statement of cash flows for Sunbeam...
-
Conceptually, why should an analyst expect valuation based on dividends and valuation based on the free cash flows for common equity shareholders to yield identical value estimates?
-
United Van Lines purchased a truck with a list price of $250,000 subject to a 6 percent discount if paid within 30 days. United Van Lines paid within the discount period. It paid $4,000 to obtain...
-
True or False. In the matrix iteration method, any computational error will not yield incorrect results.
-
A uniform simply supported beam carries two masses \(m_{1}\) and \(m_{2}\) with \(m_{2}=3 m_{1}\) as shown in Fig. 7.12. Find the fundamental natural frequency of the beam using Dunkerley's method....
-
Using Rayleigh's method, find the fundamental natural frequency of the torsional system shown in Fig. 6.11. Assume that \(J_{1}=J_{0}, J_{2}=2 J_{0}, J_{3}=3 J_{0}\), and \(k_{t 1}=k_{t 2}=k_{t...
Study smarter with the SolutionInn App