

Dirty Bird, Inc. is a chain of chicken sandwich restaurants. Your economic consulting firm has been hired
Question:
Dirty Bird, Inc. is a chain of chicken sandwich restaurants. Your economic consulting firm has been hired by Dirty Bird to conduct a quantitative analysis of demand for chicken sandwiches to better understand its potential for increased profitability.
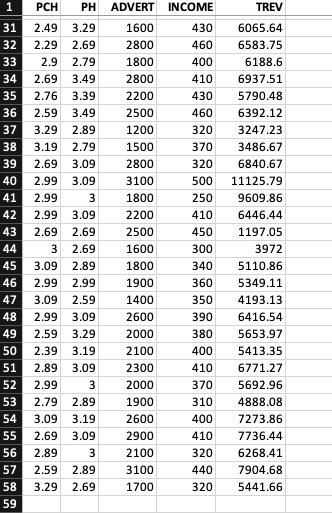
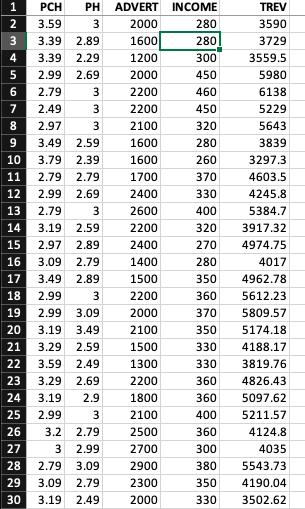
You have been given data on 57 Dirty Bird’s existing locations, with each location’s price charged for chicken sandwiches and the corresponding total revenue. You are also given the values of a few other variables that Dirty Bird believes are important: the price of hamburgers (a competing product sold by another firm) at a given store, the amount of advertising by Dirty Bird stores (in dollars), and consumers’ weekly income (in dollars) in the area where the store is located. All the variables in the dataset are as follows:
“TREV” – total revenues earned from sales of chicken sandwiches
“PCH” – price of chicken sandwiches
“PH” – Price of hamburgers
“ADVERT” – the amount spent on advertising (in dollars)
“INCOME” – an average consumer’s weekly income (in dollars) in a given location
In this project, you will have to use your skills in regression analysis, mathematics, MS Excel, and elasticity. Be sure to review these topics before you begin. Your report should present regression output for all questions that ask about one.
Questions
First, begin by estimating the demand function with quantity of chicken sandwiches as the dependent variable and price of chicken sandwiches, price of hamburgers, amount spent on advertising, and income. (You’ll have to obtain the quantity demanded variable first from the data you’ve been given.) Then, Dirty Bird’s management would like you to answer:
1. If the price of chicken sandwiches is increased by $0.89, by how much is quantity demanded expected to decrease?
2. If the price of chicken sandwiches is increased by 10%, by how many percentage points is quantity demanded expected to decrease? (You should like to log-transform the variables for this question.)
3. If we increase the price of chicken sandwiches by 10%, by how many percentage points will total revenues change? (Use the A = B*C %∆A = %∆B + %∆C.)
4. What would the total revenue be if all variables are held at their mean (average) level?
5. If income of our consumers decreases by 20%, by how many percentage points would we need to change the price of chicken sandwiches to keep quantity demanded at its original level? (Hint: think about the change in quantity demanded.)
6. Based on the advertising elasticity of demand (you will have to calculate it), by how many percentage points will demand increase if we increase advertising by 15%?
7. Are chicken sandwiches normal or inferior goods? Can we be sure either way, based on regression output?
8. Are hamburgers substitute or complementary goods? How do you know?
9. Find the expression for demand for chicken sandwiches as a function of the price of chicken sandwiches only.
10. Using the regression equation from question (9), please find the revenue-maximizing level of output and the price of chicken sandwiches.
Expert Answer:


Matching Supply with Demand An Introduction to Operations Management
ISBN: 978-0073525204
3rd edition
Authors: Gerard Cachon, Christian Terwiesch
