

DLW Corporation acquired and placed in service the following assets during the year. Cost Basis $...
Fantastic news! We've Found the answer you've been seeking!
Question:
Transcribed Image Text:
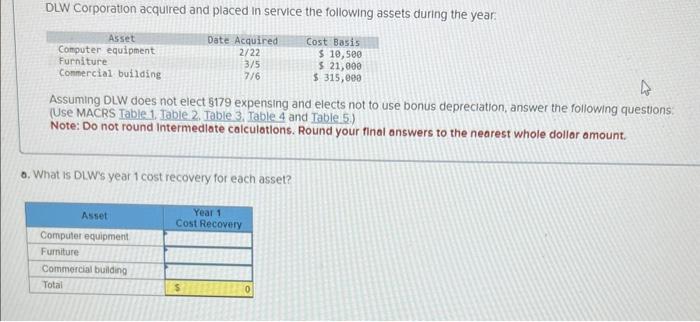
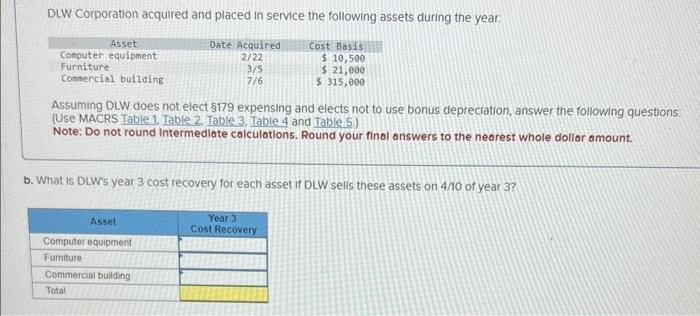
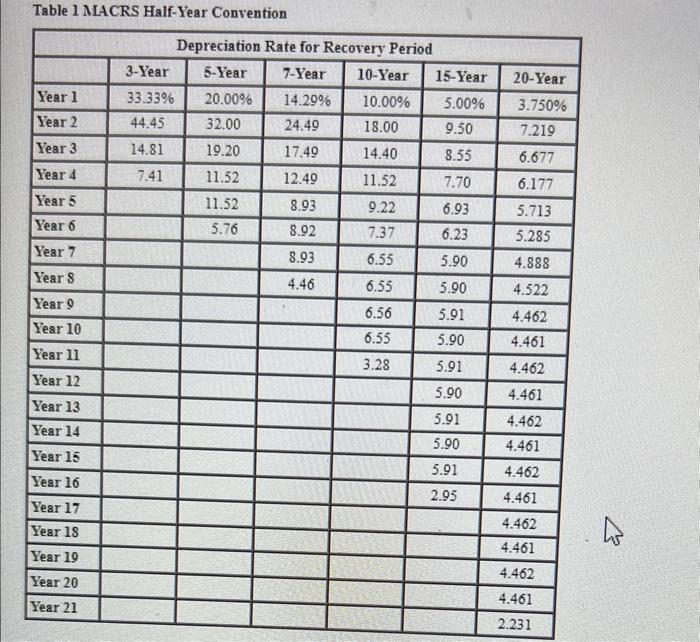
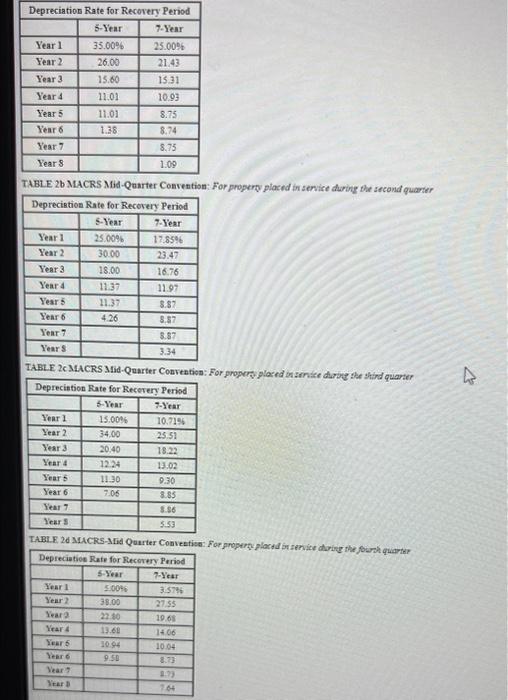
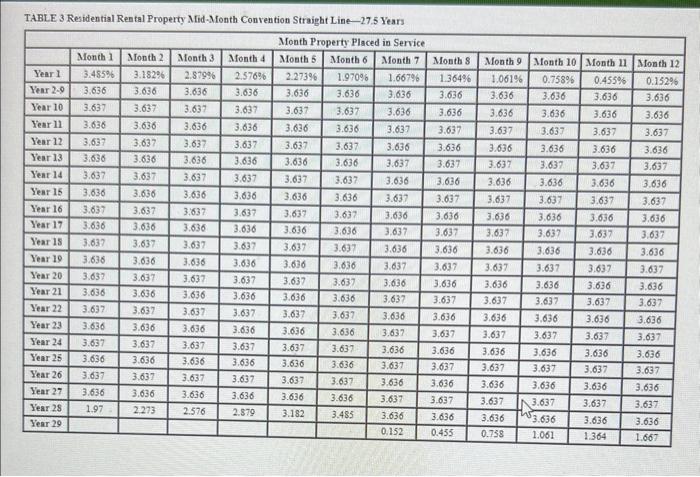
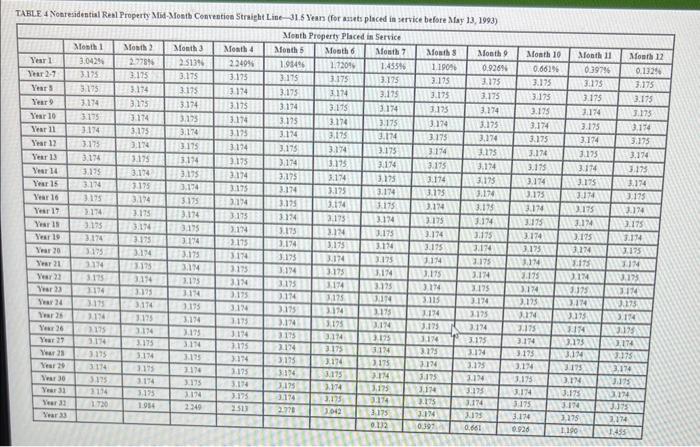
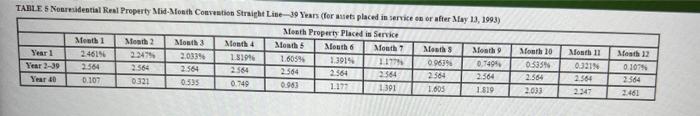
DLW Corporation acquired and placed in service the following assets during the year. Cost Basis $ 10,500 $ 21,000 $ 315,000 Asset Computer equipment Furniture Commercial building Assuming DLW does not elect $179 expensing and elects not to use bonus depreciation, answer the following questions: (Use MACRS Table 1. Table 2. Table 3. Table 4 and Table 5.) Note: Do not round Intermediate calculations. Round your final answers to the nearest whole dollar amount. Date Acquired 2/22 3/5 7/6 a. What is DLW's year 1 cost recovery for each asset? Year 1 Cost Recovery Asset Computer equipment Furniture Commercial building Total $ DLW Corporation acquired and placed in service the following assets during the year Cost Basis $ 10,500 $ 21,000 $ 315,000 Asset Computer equipment Furniture Commercial building Date Acquired 2/22 3/5 7/6 Assuming DLW does not elect 179 expensing and elects not to use bonus depreciation, answer the following questions (Use MACRS Table 1. Table 2. Table 3, Table 4 and Table 5.) Note: Do not round Intermediate calculations. Round your final answers to the nearest whole dollar amount. b. What is DLW's year 3 cost recovery for each asset if DLW sells these assets on 4/10 of year 3? Year 3 Cost Recovery Asset Computer equipment Furniture Commercial building Total Table 1 MACRS Half-Year Convention Year 1 Year 2 Year 3 Year 4 Year 5 Year 6 Year 7 Year 8 Year 9 Year 10 Year 11 Year 12 Year 13 Year 14 Year 15 Year 16 Year 17 Year 18 Year 19 Year 20 Year 21 Depreciation Rate for Recovery Period 3-Year 5-Year 7-Year 10-Year 15-Year 20.00% 14.29% 5.00% 32.00 24.49 9.50 19.20 17.49 8.55 11.52 12.49 7.70 11.52 6.93 5.76 6.23 5.90 5.90 5.91 5.90 5.91 5.90 5.91 5.90 5.91 2.95 33.33% 44.45 14.81 7.41 8.93 8.92 8.93 4.46 10.00% 18.00 14.40 11.52 9.22 7.37 6.55 6.55 6.56 6.55 3.28 20-Year 3.750% 7.219 6.677 6.177 5.713 5.285 4.888 4.522 4.462 4.461 4.462 4.461 4.462 4.461 4.462 4.461 4.462 4.461 4.462 4.461 2.231 K Depreciation Rate for Recovery Period 5-Year 7-Year 35.00% 25.00% 26.00 21.43 15.60 15.31 11.01 10.93 11.01 8.75 1.38 8.74 Year 1 Year 2 Year 3 Year 4 Year 5 Year 6 Year 7 Year 8 TABLE 26 MACRS Mid-Quarter Convention: For property placed in service during the second quarter Depreciation Rate for Recovery Period 5-Year 7-Year 25.00% 17.85% 30.00 23.47 18.00 16.76 11.37 11.97 11.37 8.87 4.26 8.87 8.87 3.34 Year 1 Year 2 Year 3 Year 4 Year 5 Year 6 Year 7 Year S TABLE 2c MACRS Mid-Quarter Convention: For property placed in service during the third quarter Depreciation Rate for Recovery Period 5-Year 7-Year Year 1 Year 2 Year 3 Year 4 Year 5 Year 6 Year 7 Year S TABLE 26 MACRS-Mid Quarter Convention For property placed in service during the fourth quarter 15.00% 34.00 20.40 12.24 11.30 7.06 Year 1 Year 2 8.75 1.09 Year 2 Year 4 Year 6 Year 6 Year 7 Year B Depreciation Rate for Recovery Period 5-Year 7-Year 5.00% 38.00 22.80 13.60 10.94 9.50 10.71% 25.51 18.22 13.02 9.30 8.85 5.56 5.53 3.57% 27.55 19.68 14.06 10.04 8.73 8.79 7.64 TABLE 3 Residential Rental Property Mid-Month Convention Straight Line-27.5 Years Month Property Placed in Service Month 5 Month 6 Month 7 Year 1 Year 2-9 Year 10 Year 11 Year 12 Year 13 Year 14 Year 15 Year 16 Year 17 Year 15 Year 19 Year 20 Year 21 Year 22 Year 23 Year 24 Year 25 Year 26 Year 27 Year 28 Year 29 Month 1 3.485% 3.636 3.637 3.636 3.637 3.636 3.637 3.636 3.637 3.636 3.637 3.636 3.637 3.636 3.637 3.636 3.637 3.636 3.637 3.636 1.97 Month 2 Month 3 3.182% 2.879% 3.636 3.636 3.637 3.637 3.636 3.636 3.637 3.637 3.636 3.636 3.637 3.637 3.636 3.636 3.637 3.637 3.636 3.636 3.637 3.637 3.636 3.636 3.637 3.637 3.636 3.636 3.637 3.637 3.636 3.637 3.636 3.637 3.636 2,273 3.636 3.637 3.636 3.637 3.636 2.576 Month 4 2.576% 3.636 3.637 3.636 3.637 3.636 3.637 3.636 3.637 3.636 3.637 3.636 3.637 3.636 3.637 3.636 3.637 3.636 3.637 3.636 2.879 2.2739 3.636 3.637 1.970% 3.636 3.637 3.636 3.636 3.637 3.637 3.636 3.636 3.637 3.637 3.636 3.636 3.637 3.636 3.637 3.636 3.637 3.636 3.637 3.636 3.637 3.636 3.637 3.636 3.182 1.667% 3.636 3.636 3.637 3.636 3.637 3.636 3.637 3.637 3.636 3.637 3.636 3.637 3.636 3.637 3.636 3.637 3.636 3.637 3.636 3.636 3.637 3.485 3.636 0.152 3.636 3.637 3.636 3.637 3.636 3.637 3.636 3.637 3.636 3.637 Month S 1.364% 3.636 3.636 3.637 3.636 3.637 3.636 3.637 3.636 3.637 3.636 3.637 3.636 3.637 Month 9 Month 10 Month 11 Month 12 1.061% 0.758% 0.455% 0.152% 3.636 3.636 3.636 3.636 3.636 3.636 3.636 3.636 3.637 13.637 3.637 3.637 3.636 3.636 3.636 3.636 3.637 3.637 3.637 3.637 3.636 3.636 3.636 3.636 3.637 3.637 3.637 3.637 3.636 3.636 3.636 3.636 3.637 3.637 3.637 3.637 3.636 3.636 3.636 3.636 3.637 3.637 3.637 3.637 3.636 3.636 3.636 3.636 3.637 3.637 3.637 3.637 3.636 3.636 3.636 3.637 3.637 3.637 3.636 3.637 3.636 3.636 3.637 3.637 3.636 3.636 3.637 3.637 3.636 3.637 3.636 0.455 3.636 3.637 3.636 0.758 ! 3.636 3.637 53.636 1.061 3.636 3.637 3.636 3.637 3.636 1.364 3.636 3.637 3.636 3.637 3.636 1.667 TABLE 4 Nonresidential Real Property Mid-Month Convention Straight Line-31.5 Years (for assets placed in service before May 13, 1993) Month Property Placed in Service Month 5 Month 6 Month 7 Year 1 Year 2-7 Year 5 Year 9 Year 10 Year 11 Year 12 Year 13 Year 14 Year 15 Year 16 Year 17 Year 18 Year 19 Year 20 Year 21 ELL Year 23 Year 24 Your 25 Year 26 Year 27 Year 25 Year 29 Year 30 TE Year 32 Year 33 Month 1 Month 2 Month 3 2.7785 2.513% 3.175 3.175 NOHOTE 54F FALE ALTE 3.175 MATE 3.175 YLTE SLEE 3.174 SLEE ( SITE YLEE 3.175 NEE SLEE 3174 FLEE 3.174 SLEE FLEE 3.175 3174 SLF'S 3174 1720 FITE SLTE 3.174 3.175 NTE 3.175 3.174 3.375 3.174 FLUE 3.174 SAFE 3374 FLUE NUE 3.375 3.174 3.175 3.374 SLEE KLEE 3.375 3.174 3.175 1.954 3.175 3374 SCUE 3.174 SLTE 3.174 SAVE 3,174 3175 3.174 SAVE NTE FLUE NUE SATE KEE SLEE 3.174 3.375 NET FLEE 3.374 SLEE PEY OVEZ Month 4 2.249% SLEE 3.174 SLUE 3.174 FALE FLUE 3.175 FLUE 3.175 3.174 SLEE KUC SLEE NTE SLEE NEE SLEE 3.174 3.175 3.174 SLUE 3:374 SLEE PATE 3.175 2513 1.984% 3.175 3.175 FLEE SLEE NUE 3.175 NUE RE 3.374 FLEE 3.174 3.175 PIE STE 3.174 SLEE NUE SLEE PLEC SITE 3.174 SLEE PER 3.175 3.174 BLET 1.720% SLEE NIY 3.175 3.174 SLIE HAFE FLUF 3.174 3.175 PLIE 3.175 NEE 3.175 NEE SLEE 3.174 SLUE NEE 3,175 NEE SITE 3.174 3.175 3.174 SLIVE 3.042 1.455% SLEE SLITE BLUE SLEE 3.174 SLEE 3.174 FLEE 3.174 3.175 3.174 SATE NUE SLEE 3.174 FLEE 3374 SLEE NIE EZEE KIE 3,175 NEE 3.175 bre SLEE 2(10 8 1.190% SLEE 3.175 SLEE 3.174 3.175 PATE SATE 3.174 3.175 NUE SLEE 3.174 3.175 NEF 3.175 NEE STEE 3.174 REE NIE SLEE KEE SLEE NIE. SLEE NEE 0.397 Month 9 0.926% SLEE SLEE BALE SLEE 3,174 SLEE 3.174 SLEE 3.174 3.175 NEE SLEE ALTE SLEE 3.174 SLEE 3.174 SLEE NEE 3.175 FLEE SLEE ACUE SLEE PLEE 3.375 0.661 Month 10 Month 11 0.661% 0.397% SLEE 3.175 SLIE TE SLEE YLEE 3.175 PLIE 3.175 3.174 SLEE 3.174 SLEE 3.374 SLEE 3.174 SCUE 3.175 3.274 0.926 SLEE NIE FLEE KTE ELTE ALTE PLEE SCIE LEE SLEE 3.175 3.174 3.174 SCUE SLEE PATE SATE 3.174 SLEE PLEE REC 1174 FLUE 3374 3.17 3.175 WELFEAW MEIN SLEE NES SLT'T OUT T Month 12 0.1325 3.175 SLED PIE MNEZCOON FER AVICHAKO FLEE SLEE SLTE PALE 3.175 3.174 SLEE 3.174 3.175 NEE SITE NTE SLEE ken WWXZ4 3.174 3.375 3,174 31FE KUC NIE SEPT JJJZEN TABLE 5 Nonresidential Real Property Mid-Month Convention Straight Line-39 Years (for assets placed in service on or after May 13, 1993) Month Property Placed in Service Month 5 Mouth 6 Month 7 1.177% 1.605% 2.564 2564 0.963 1,391 Year 1 Year 2-39 Year 40 Month 1 2461% 2.564 0.107 Month 2 2.247% 2564 0.321 Month 3 2.033% 2.564 0.535 Month 4 1.819% 2564 0.749 1.391% 2.564 1.177 Month 3 0.963% 2564 1.605 Month 9 0.749% 2.564 1.819 Month 10 0.535% 2.564 2.033 Month 11 0.321% 2.564 2247 Mosth 12 0.107% 2564 2.461 DLW Corporation acquired and placed in service the following assets during the year. Cost Basis $ 10,500 $ 21,000 $ 315,000 Asset Computer equipment Furniture Commercial building Assuming DLW does not elect $179 expensing and elects not to use bonus depreciation, answer the following questions: (Use MACRS Table 1. Table 2. Table 3. Table 4 and Table 5.) Note: Do not round Intermediate calculations. Round your final answers to the nearest whole dollar amount. Date Acquired 2/22 3/5 7/6 a. What is DLW's year 1 cost recovery for each asset? Year 1 Cost Recovery Asset Computer equipment Furniture Commercial building Total $ DLW Corporation acquired and placed in service the following assets during the year Cost Basis $ 10,500 $ 21,000 $ 315,000 Asset Computer equipment Furniture Commercial building Date Acquired 2/22 3/5 7/6 Assuming DLW does not elect 179 expensing and elects not to use bonus depreciation, answer the following questions (Use MACRS Table 1. Table 2. Table 3, Table 4 and Table 5.) Note: Do not round Intermediate calculations. Round your final answers to the nearest whole dollar amount. b. What is DLW's year 3 cost recovery for each asset if DLW sells these assets on 4/10 of year 3? Year 3 Cost Recovery Asset Computer equipment Furniture Commercial building Total Table 1 MACRS Half-Year Convention Year 1 Year 2 Year 3 Year 4 Year 5 Year 6 Year 7 Year 8 Year 9 Year 10 Year 11 Year 12 Year 13 Year 14 Year 15 Year 16 Year 17 Year 18 Year 19 Year 20 Year 21 Depreciation Rate for Recovery Period 3-Year 5-Year 7-Year 10-Year 15-Year 20.00% 14.29% 5.00% 32.00 24.49 9.50 19.20 17.49 8.55 11.52 12.49 7.70 11.52 6.93 5.76 6.23 5.90 5.90 5.91 5.90 5.91 5.90 5.91 5.90 5.91 2.95 33.33% 44.45 14.81 7.41 8.93 8.92 8.93 4.46 10.00% 18.00 14.40 11.52 9.22 7.37 6.55 6.55 6.56 6.55 3.28 20-Year 3.750% 7.219 6.677 6.177 5.713 5.285 4.888 4.522 4.462 4.461 4.462 4.461 4.462 4.461 4.462 4.461 4.462 4.461 4.462 4.461 2.231 K Depreciation Rate for Recovery Period 5-Year 7-Year 35.00% 25.00% 26.00 21.43 15.60 15.31 11.01 10.93 11.01 8.75 1.38 8.74 Year 1 Year 2 Year 3 Year 4 Year 5 Year 6 Year 7 Year 8 TABLE 26 MACRS Mid-Quarter Convention: For property placed in service during the second quarter Depreciation Rate for Recovery Period 5-Year 7-Year 25.00% 17.85% 30.00 23.47 18.00 16.76 11.37 11.97 11.37 8.87 4.26 8.87 8.87 3.34 Year 1 Year 2 Year 3 Year 4 Year 5 Year 6 Year 7 Year S TABLE 2c MACRS Mid-Quarter Convention: For property placed in service during the third quarter Depreciation Rate for Recovery Period 5-Year 7-Year Year 1 Year 2 Year 3 Year 4 Year 5 Year 6 Year 7 Year S TABLE 26 MACRS-Mid Quarter Convention For property placed in service during the fourth quarter 15.00% 34.00 20.40 12.24 11.30 7.06 Year 1 Year 2 8.75 1.09 Year 2 Year 4 Year 6 Year 6 Year 7 Year B Depreciation Rate for Recovery Period 5-Year 7-Year 5.00% 38.00 22.80 13.60 10.94 9.50 10.71% 25.51 18.22 13.02 9.30 8.85 5.56 5.53 3.57% 27.55 19.68 14.06 10.04 8.73 8.79 7.64 TABLE 3 Residential Rental Property Mid-Month Convention Straight Line-27.5 Years Month Property Placed in Service Month 5 Month 6 Month 7 Year 1 Year 2-9 Year 10 Year 11 Year 12 Year 13 Year 14 Year 15 Year 16 Year 17 Year 15 Year 19 Year 20 Year 21 Year 22 Year 23 Year 24 Year 25 Year 26 Year 27 Year 28 Year 29 Month 1 3.485% 3.636 3.637 3.636 3.637 3.636 3.637 3.636 3.637 3.636 3.637 3.636 3.637 3.636 3.637 3.636 3.637 3.636 3.637 3.636 1.97 Month 2 Month 3 3.182% 2.879% 3.636 3.636 3.637 3.637 3.636 3.636 3.637 3.637 3.636 3.636 3.637 3.637 3.636 3.636 3.637 3.637 3.636 3.636 3.637 3.637 3.636 3.636 3.637 3.637 3.636 3.636 3.637 3.637 3.636 3.637 3.636 3.637 3.636 2,273 3.636 3.637 3.636 3.637 3.636 2.576 Month 4 2.576% 3.636 3.637 3.636 3.637 3.636 3.637 3.636 3.637 3.636 3.637 3.636 3.637 3.636 3.637 3.636 3.637 3.636 3.637 3.636 2.879 2.2739 3.636 3.637 1.970% 3.636 3.637 3.636 3.636 3.637 3.637 3.636 3.636 3.637 3.637 3.636 3.636 3.637 3.636 3.637 3.636 3.637 3.636 3.637 3.636 3.637 3.636 3.637 3.636 3.182 1.667% 3.636 3.636 3.637 3.636 3.637 3.636 3.637 3.637 3.636 3.637 3.636 3.637 3.636 3.637 3.636 3.637 3.636 3.637 3.636 3.636 3.637 3.485 3.636 0.152 3.636 3.637 3.636 3.637 3.636 3.637 3.636 3.637 3.636 3.637 Month S 1.364% 3.636 3.636 3.637 3.636 3.637 3.636 3.637 3.636 3.637 3.636 3.637 3.636 3.637 Month 9 Month 10 Month 11 Month 12 1.061% 0.758% 0.455% 0.152% 3.636 3.636 3.636 3.636 3.636 3.636 3.636 3.636 3.637 13.637 3.637 3.637 3.636 3.636 3.636 3.636 3.637 3.637 3.637 3.637 3.636 3.636 3.636 3.636 3.637 3.637 3.637 3.637 3.636 3.636 3.636 3.636 3.637 3.637 3.637 3.637 3.636 3.636 3.636 3.636 3.637 3.637 3.637 3.637 3.636 3.636 3.636 3.636 3.637 3.637 3.637 3.637 3.636 3.636 3.636 3.637 3.637 3.637 3.636 3.637 3.636 3.636 3.637 3.637 3.636 3.636 3.637 3.637 3.636 3.637 3.636 0.455 3.636 3.637 3.636 0.758 ! 3.636 3.637 53.636 1.061 3.636 3.637 3.636 3.637 3.636 1.364 3.636 3.637 3.636 3.637 3.636 1.667 TABLE 4 Nonresidential Real Property Mid-Month Convention Straight Line-31.5 Years (for assets placed in service before May 13, 1993) Month Property Placed in Service Month 5 Month 6 Month 7 Year 1 Year 2-7 Year 5 Year 9 Year 10 Year 11 Year 12 Year 13 Year 14 Year 15 Year 16 Year 17 Year 18 Year 19 Year 20 Year 21 ELL Year 23 Year 24 Your 25 Year 26 Year 27 Year 25 Year 29 Year 30 TE Year 32 Year 33 Month 1 Month 2 Month 3 2.7785 2.513% 3.175 3.175 NOHOTE 54F FALE ALTE 3.175 MATE 3.175 YLTE SLEE 3.174 SLEE ( SITE YLEE 3.175 NEE SLEE 3174 FLEE 3.174 SLEE FLEE 3.175 3174 SLF'S 3174 1720 FITE SLTE 3.174 3.175 NTE 3.175 3.174 3.375 3.174 FLUE 3.174 SAFE 3374 FLUE NUE 3.375 3.174 3.175 3.374 SLEE KLEE 3.375 3.174 3.175 1.954 3.175 3374 SCUE 3.174 SLTE 3.174 SAVE 3,174 3175 3.174 SAVE NTE FLUE NUE SATE KEE SLEE 3.174 3.375 NET FLEE 3.374 SLEE PEY OVEZ Month 4 2.249% SLEE 3.174 SLUE 3.174 FALE FLUE 3.175 FLUE 3.175 3.174 SLEE KUC SLEE NTE SLEE NEE SLEE 3.174 3.175 3.174 SLUE 3:374 SLEE PATE 3.175 2513 1.984% 3.175 3.175 FLEE SLEE NUE 3.175 NUE RE 3.374 FLEE 3.174 3.175 PIE STE 3.174 SLEE NUE SLEE PLEC SITE 3.174 SLEE PER 3.175 3.174 BLET 1.720% SLEE NIY 3.175 3.174 SLIE HAFE FLUF 3.174 3.175 PLIE 3.175 NEE 3.175 NEE SLEE 3.174 SLUE NEE 3,175 NEE SITE 3.174 3.175 3.174 SLIVE 3.042 1.455% SLEE SLITE BLUE SLEE 3.174 SLEE 3.174 FLEE 3.174 3.175 3.174 SATE NUE SLEE 3.174 FLEE 3374 SLEE NIE EZEE KIE 3,175 NEE 3.175 bre SLEE 2(10 8 1.190% SLEE 3.175 SLEE 3.174 3.175 PATE SATE 3.174 3.175 NUE SLEE 3.174 3.175 NEF 3.175 NEE STEE 3.174 REE NIE SLEE KEE SLEE NIE. SLEE NEE 0.397 Month 9 0.926% SLEE SLEE BALE SLEE 3,174 SLEE 3.174 SLEE 3.174 3.175 NEE SLEE ALTE SLEE 3.174 SLEE 3.174 SLEE NEE 3.175 FLEE SLEE ACUE SLEE PLEE 3.375 0.661 Month 10 Month 11 0.661% 0.397% SLEE 3.175 SLIE TE SLEE YLEE 3.175 PLIE 3.175 3.174 SLEE 3.174 SLEE 3.374 SLEE 3.174 SCUE 3.175 3.274 0.926 SLEE NIE FLEE KTE ELTE ALTE PLEE SCIE LEE SLEE 3.175 3.174 3.174 SCUE SLEE PATE SATE 3.174 SLEE PLEE REC 1174 FLUE 3374 3.17 3.175 WELFEAW MEIN SLEE NES SLT'T OUT T Month 12 0.1325 3.175 SLED PIE MNEZCOON FER AVICHAKO FLEE SLEE SLTE PALE 3.175 3.174 SLEE 3.174 3.175 NEE SITE NTE SLEE ken WWXZ4 3.174 3.375 3,174 31FE KUC NIE SEPT JJJZEN TABLE 5 Nonresidential Real Property Mid-Month Convention Straight Line-39 Years (for assets placed in service on or after May 13, 1993) Month Property Placed in Service Month 5 Mouth 6 Month 7 1.177% 1.605% 2.564 2564 0.963 1,391 Year 1 Year 2-39 Year 40 Month 1 2461% 2.564 0.107 Month 2 2.247% 2564 0.321 Month 3 2.033% 2.564 0.535 Month 4 1.819% 2564 0.749 1.391% 2.564 1.177 Month 3 0.963% 2564 1.605 Month 9 0.749% 2.564 1.819 Month 10 0.535% 2.564 2.033 Month 11 0.321% 2.564 2247 Mosth 12 0.107% 2564 2.461
Expert Answer:
Answer rating: 100% (QA)
a Year 1 cost recovery for each asset Computer equipment MACRS class life 5 years Recovery percentag... View the full answer

Related Book For 
Taxation Of Individuals And Business Entities 2015
ISBN: 9780077862367
6th Edition
Authors: Brian Spilker, Benjamin Ayers, John Robinson, Edmund Outslay, Ronald Worsham, John Barrick, Connie Weaver
Posted Date:
Students also viewed these finance questions
-
DLW Corporation acquired and placed in service the following assets during the year: Asset Date Acquired Cost Basis Computer equipment .......... 2/17 ......... $10,000 Furniture ......................
-
DLW Corporation acquired and placed in service the following assets during the year: Asset Date Acquired Cost Basis Computer equipment 2/19 $ 16,300 Furniture 4/27 22,900 Commercial building 10/2...
-
The following additional information is available for the Dr. Ivan and Irene Incisor family from Chapters 1-6. On December 12, Irene purchased the building where her store is located. She paid...
-
The regression of the X and Y equation is Y = 48.32 -2.105X, What is the slope of the data.
-
The symmetric magnetic circuit of Figure has three windings. Windings A and B each have N turns and are wound on the two bottom legs of the core. The core dimensions are indicated in the figure. a....
-
In his study of the effect of incarceration on crime rates, suppose Levitt had used the number of lawyers per capita as an instrument. Would this instrument be relevant? Would it be exogenous? Would...
-
Suppose you are starting a business, T-Shirts Plus, Inc., to imprint logos on T-shirts. In organizing the business and setting up its accounting records, you take your information to a CPA to prepare...
-
1. Describe how the work thats done at Google can result in employees feeling both very stressed and also very positive about their work and the company. In what way do these effects depend on Google...
-
4. marks) 4. What are the important factors/qualities that a buyer looks for in a salesperson? What tools, techniques, and processes does a good sales person employ to convey those qualities and do...
-
Ramada Company produces one golf cart model. A partially complete table of company costs follows: Required: 1. Complete the table. 2. Ramada sells its carts for $1,200 each. Prepare a contribution...
-
Jamison Computer Sales Store orders 150 computer desks. The supply company shipped 150 printer stand. Does the shipment amount to an acceptance of the offer or a counteroffer?
-
Solve yn+2 - Yn+1 + Yn = 0, given that yo Yn+1+Yn 1+ 3 = 1 and y 2
-
Can you please use xcel and show me how you calculated the info. Especially for the Hired and Fired employees. I am struggling with that part. PP.52A manufacturer of solid state drives (SSDs) has...
-
You are walking in the pool area when you see the parents of four small children struggling to keep them nearby. The children are running in all directions and bothering other guests. What is your...
-
What are the similarities and differences between accounting for nonprofit entities and accounting for state and local government entities. What are the similarities and differences between...
-
2. In an experiment to verify Boyle's law, a student measured the length / of a column of air of fixed mass and uniform diameter, at different values of air pressure p. The following data were...
-
05 Question No: 05 This is a subjective question, hence you have to write your answer in the Text-Field given below. 22da0-4ve to w Given two classification models A and B where the model A provides...
-
In what ways does a well-designed enterprise search software vary from popular search engines (e.g., Bing, DuckDuckGo, and Google)?
-
Under what circumstances will a deposit of cash to a bank account held in joint tenancy be considered a completed gift?
-
What are the tax practitioner's standards to avoid a penalty for recommending a tax return position?
-
Montel argues that a flat income tax rate system is vertically equitable. Oprah argues that a progressive tax rate structure is vertically equitable. How do their arguments differ? Who is correct?
-
The following reaction takes place in a system consisting of \(3 \mathrm{~mol} \mathrm{CH}_{4}, 5 \mathrm{~mol} \mathrm{H}_{2} \mathrm{O}\), \(1 \mathrm{~mol} \mathrm{CO}\) and \(4 \mathrm{~mol}...
-
A system is said to be in thermodynamic equilibrium if its (a) Temperature remains unchanged (b) Pressure remains unchanged (c) Chemical potential remains unchanged (d) Temperature, pressure and...
-
A system initially containing \(3 \mathrm{~mol} \mathrm{CO}_{2}, 5 \mathrm{~mol} \mathrm{H}_{2}\) and \(1 \mathrm{~mol} \mathrm{H}_{2} \mathrm{O}\) is undergoing the following reactions: \[...

Study smarter with the SolutionInn App