Do a trend and peer comparison analysis of the companys solvency, stored liquidity, cash flow liquidity and
Fantastic news! We've Found the answer you've been seeking!
Question:
Do a trend and peer comparison analysis of the company’s solvency, stored liquidity, cash flow liquidity and performance trends for the current year compared to the previous year by looking at:
Summarize the strengths and weaknesses for the company based on your above analysis including what you found for the entire analysis including your analysis of liquidity, solvency, and financial performance.
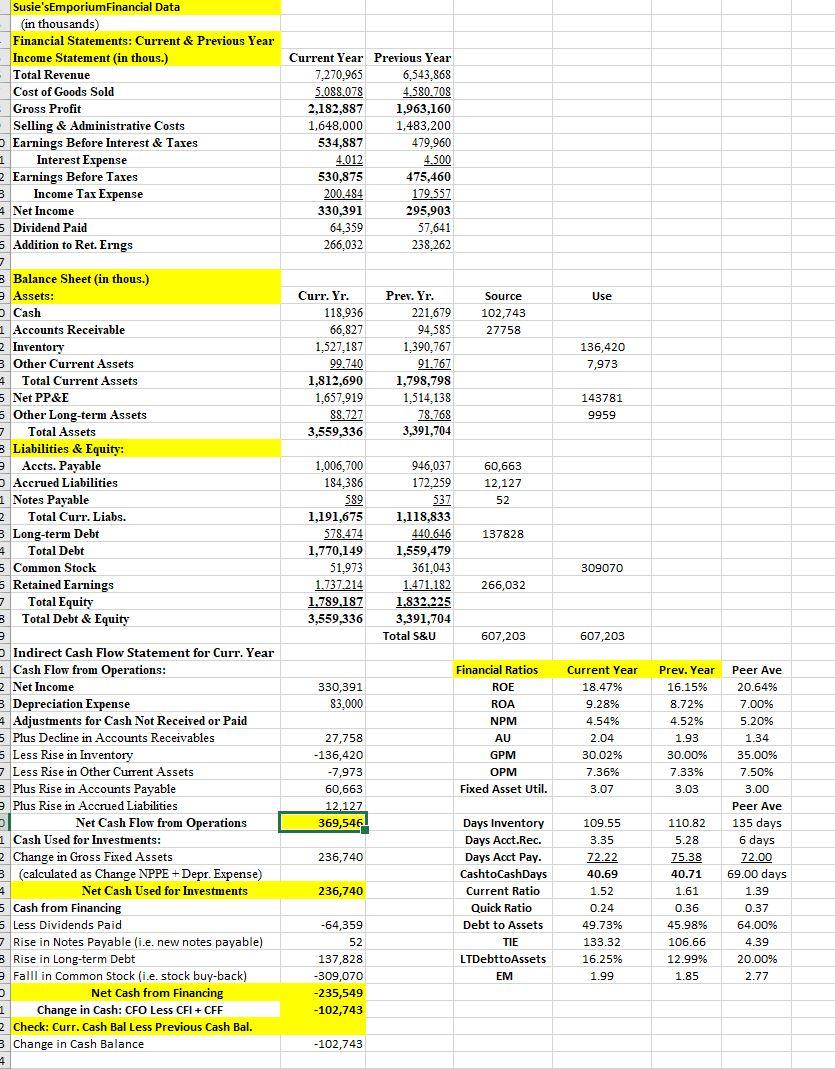
Transcribed Image Text:
Susie'sEmporiumFinancial Data (in thousands) Financial Statements: Current & Previous Year Income Statement (in thous.) Total Revenue Cost of Goods Sold Current Year Previous Year 7.270.965 6,543,868 5.088.078 4.580.708 Gross Profit 2,182,887 1,963,160 Selling & Administrative Costs O Earnings Before Interest & Taxes Interest Expense 2 Earnings Before Taxes Income Tax Expense 4 Net Income 5 Dividend Paid 5 Addition to Ret. Erngs 1,648,000 1,483,200 534,887 479,960 4.012 4.500 530,875 475,460 179.557 295,903 57,641 238,262 200.484 330,391 64,359 266,032 3 Balance Sheet (in thous.) e Assets: P Cash 1 Accounts Receivable 2 Inventory 3 Other Current Assets 4 Total Current Assets 5 Net PP&E 5 Other Long-term Assets Curr. Yr. Prev. Yr. Source Use 118,936 221,679 94.585 102,743 66,827 27758 1,527,187 1,390,767 136,420 99.740 91.767 7,973 1,812,690 1,657,919 88.727 3,559,336 1,798,798 1,514,138 143781 78.768 3,391,704 9959 Total Assets 3 Liabilities & Equity: e Accts. Payable p Accrued Liabilities 1 Notes Payable 2 Total Curr. Liabs. 3 Long-term Debt 4 Total Debt 5 Common Stock 5 Retained Earnings Total Equity 3 Total Debt & Equity 1,006,700 184,386 589 1,191,675 946,037 172,259 60,663 12,127 537 52 1,118,833 440,646 578.474 1,770,149 137828 1,559,479 51,973 361,043 309070 1.737.214 1,789,187 1.471.182 266,032 1.832,225 3,391,704 Total S&U 3,559,336 607,203 607,203 o Indirect Cash Flow Statement for Curr. Year 1 Cash Flow from Operations: 2 Net Income 3 Depreciation Expense 4 Adjustments for Cash Not Received or Paid 5 Plus Decline in Accounts Receivables 5 Less Rise in Inventory - Less Rise in Other Current Assets 8 Plus Rise in Accounts Payable e Plus Rise in Accrued Liabilities Financial Ratios Current Year Prev. Year Peer Ave 330,391 ROE 18.47% 16.15% 20.64% 83.000 ROA 9.28% 8.72% 7.00% NPM 4.54% 4.52% 5.20% 27,758 AU 2.04 1.93 1.34 -136,420 GPM 30.02% 30.00% 35.00% -7,973 OPM 7.36% 7.33% 7.50% 60,663 Fixed Asset Util. 3.07 3.03 3.00 12,127 Peer Ave Net Cash Flow from Operations 369,546 Days Inventory 135 days 109.55 110.82 1 Cash Used for Investments: 2 Change in Gross Fixed Assets 3 (calculated as Change NPPE + Depr. Expense) Days Acct.Rec. 3.35 5.28 6 days 236,740 Days Acct Pay. 72.22 75.38 72.00 69.00 day CashtoCashDays Current Ratio 40.69 40.71 Net Cash Used for Investments 236,740 1.52 1.61 1.39 5 Cash from Financing 5 Less Dividends Paid 7 Rise in Notes Payable (i.e. new notes payable) B Rise in Long-term Debt e Falll in Common Stock (i.e. stock buy-back) Quick Ratio 0.24 0.36 0.37 -64,359 Debt to Assets 49.73% 45.98% 64.00% 52 TIE 133.32 106.66 4.39 137,828 LTDebttoAssets 16.25% 12.99% 20.00% -309,070 EM 1.99 1.85 2.77 Net Cash from Financing -235,549 Change in Cash: CFO Less CFI + CFF -102,743 2 Check: Curr. Cash Bal Less Previous Cash Bal. 3 Change in Cash Balance -102,743 Susie'sEmporiumFinancial Data (in thousands) Financial Statements: Current & Previous Year Income Statement (in thous.) Total Revenue Cost of Goods Sold Current Year Previous Year 7.270.965 6,543,868 5.088.078 4.580.708 Gross Profit 2,182,887 1,963,160 Selling & Administrative Costs O Earnings Before Interest & Taxes Interest Expense 2 Earnings Before Taxes Income Tax Expense 4 Net Income 5 Dividend Paid 5 Addition to Ret. Erngs 1,648,000 1,483,200 534,887 479,960 4.012 4.500 530,875 475,460 179.557 295,903 57,641 238,262 200.484 330,391 64,359 266,032 3 Balance Sheet (in thous.) e Assets: P Cash 1 Accounts Receivable 2 Inventory 3 Other Current Assets 4 Total Current Assets 5 Net PP&E 5 Other Long-term Assets Curr. Yr. Prev. Yr. Source Use 118,936 221,679 94.585 102,743 66,827 27758 1,527,187 1,390,767 136,420 99.740 91.767 7,973 1,812,690 1,657,919 88.727 3,559,336 1,798,798 1,514,138 143781 78.768 3,391,704 9959 Total Assets 3 Liabilities & Equity: e Accts. Payable p Accrued Liabilities 1 Notes Payable 2 Total Curr. Liabs. 3 Long-term Debt 4 Total Debt 5 Common Stock 5 Retained Earnings Total Equity 3 Total Debt & Equity 1,006,700 184,386 589 1,191,675 946,037 172,259 60,663 12,127 537 52 1,118,833 440,646 578.474 1,770,149 137828 1,559,479 51,973 361,043 309070 1.737.214 1,789,187 1.471.182 266,032 1.832,225 3,391,704 Total S&U 3,559,336 607,203 607,203 o Indirect Cash Flow Statement for Curr. Year 1 Cash Flow from Operations: 2 Net Income 3 Depreciation Expense 4 Adjustments for Cash Not Received or Paid 5 Plus Decline in Accounts Receivables 5 Less Rise in Inventory - Less Rise in Other Current Assets 8 Plus Rise in Accounts Payable e Plus Rise in Accrued Liabilities Financial Ratios Current Year Prev. Year Peer Ave 330,391 ROE 18.47% 16.15% 20.64% 83.000 ROA 9.28% 8.72% 7.00% NPM 4.54% 4.52% 5.20% 27,758 AU 2.04 1.93 1.34 -136,420 GPM 30.02% 30.00% 35.00% -7,973 OPM 7.36% 7.33% 7.50% 60,663 Fixed Asset Util. 3.07 3.03 3.00 12,127 Peer Ave Net Cash Flow from Operations 369,546 Days Inventory 135 days 109.55 110.82 1 Cash Used for Investments: 2 Change in Gross Fixed Assets 3 (calculated as Change NPPE + Depr. Expense) Days Acct.Rec. 3.35 5.28 6 days 236,740 Days Acct Pay. 72.22 75.38 72.00 69.00 day CashtoCashDays Current Ratio 40.69 40.71 Net Cash Used for Investments 236,740 1.52 1.61 1.39 5 Cash from Financing 5 Less Dividends Paid 7 Rise in Notes Payable (i.e. new notes payable) B Rise in Long-term Debt e Falll in Common Stock (i.e. stock buy-back) Quick Ratio 0.24 0.36 0.37 -64,359 Debt to Assets 49.73% 45.98% 64.00% 52 TIE 133.32 106.66 4.39 137,828 LTDebttoAssets 16.25% 12.99% 20.00% -309,070 EM 1.99 1.85 2.77 Net Cash from Financing -235,549 Change in Cash: CFO Less CFI + CFF -102,743 2 Check: Curr. Cash Bal Less Previous Cash Bal. 3 Change in Cash Balance -102,743
Expert Answer:
Answer rating: 100% (QA)
complete solution is given below 1 Comparison analysis of company solvency a Debt to asset ratio debts Total assets Debts long term loans long term de... View the full answer
Related Book For
Posted Date:
Students also viewed these accounting questions
-
Do a case analysis of the company "INVITROGEN" Analysis: External Environment- General Environment- Industry Environment- Competitor Environment- Internal Organization- SWOT: Strength- Weakness-...
-
Identify which of the following is an example of an unobservable input: Stock prices of listed entities Company cash flow projections Real estate transactions Spot prices for oil
-
Write up a strategic analysis of the company Levi Strauss. The format of the paper is as follows: I. Executive summary Ii. Introduction Iii. Goals, vision/mission, constraints Iv. External...
-
What is a Java package, and what is its purpose?
-
What is deep ecology? According to this view, what are the root causes of our environmental problems?
-
A rare disease exists in which only 1 in 500 are affected. A test for the disease exists but of course it is not infallible. A correct positive result (patient actually has the disease) occurs 95% of...
-
Gegax Manufacturing incurred the following costs in acquiring land, making land improvements, and constructing and furnishing a new building. Gegax Manufacturing depreciates buildings over 40 years,...
-
Suppose the current USD/euro exchange rate is 1.2000 dollar per euro. The six month forward exchange rate is 1.1950. The six month USD interest rate is 1% per annum continuously compounded? Estimate...
-
Using MySQL Workbench: Create a new schema for this lab and import Lab07DB.sql. Create a second new schema for this lab and import dept_emp.sql. Following the steps in Lab 4: Reverse engineer the...
-
1. Are you persuaded by the states evidence that it had an individual of a different national origin who was treated similarly to Herawi? If Ward (or other managers) treated everyone equally poorly,...
-
Explain the Third Habit Book-The Seven Habits of Highly Effective People. Book Link : ati.dae.gov.in/ati12052021_1.pdf
-
High ethical standards are essential in the Healthcare industry. These standards fall under the umbrella of health or medical ethics, the field of applied ethics that is concerned with moral...
-
Reagan Corp. has reported a net income of $804,400 for the year. The company's share price is $13.29, and the company has318,110 shares outstanding. Compute the firm's price-earnings ratio up to two...
-
Shereen is in physics class, working on her projectile motion lab. Part of the lab is to launch a projectile into a can. This physics lab is taking place outside on the school field. Shereen launches...
-
White Company has two departments, Cutting and Finishing. The company uses a job-order costing system and computes a predetermined overhead rate in each department. The Cutting Department bases its...
-
Factor 45x - 20y
-
What are bought and sold in a financial market? (Select all that apply.) real estate collectible coins equity securities debt securities
-
Suppose that the electrical potential at the point (x, y, z) is E(x, y, z) = x + y - 2z. What is the direction of the acceleration at the point (1,3,2)?
-
A venture capital company buys 400,000 shares of a start-ups stock for $5 million. If the company has 1.6 million shares outstanding prior to the purchase, what is the companys pre-money value? What...
-
Revisit General Designs option to grow in Problem 17. Suppose you are at time 2, and stage 1 has been successful. Because the stage 2 cash flows are now relatively certain, their discount rate is now...
-
The table below shows the projected free cash flows of an acquisition target. The potential acquirer wants to estimate its maximum acquisition price at an 8 percent discount rate and a terminal value...
-
What is involved in vouching recorded receivables transactions to supporting documentation and to what specific account balance audit objectives does the evidence pertain?
-
State several financial ratios and their formulas that can be used by the auditor in applying analytical procedures to accounts receivable.
-
a. Under what circumstances may it not be necessary to confirm accounts receivable? b. What factors should be considered in determining the form of the confirmation request? c. When positive...
Study smarter with the SolutionInn App