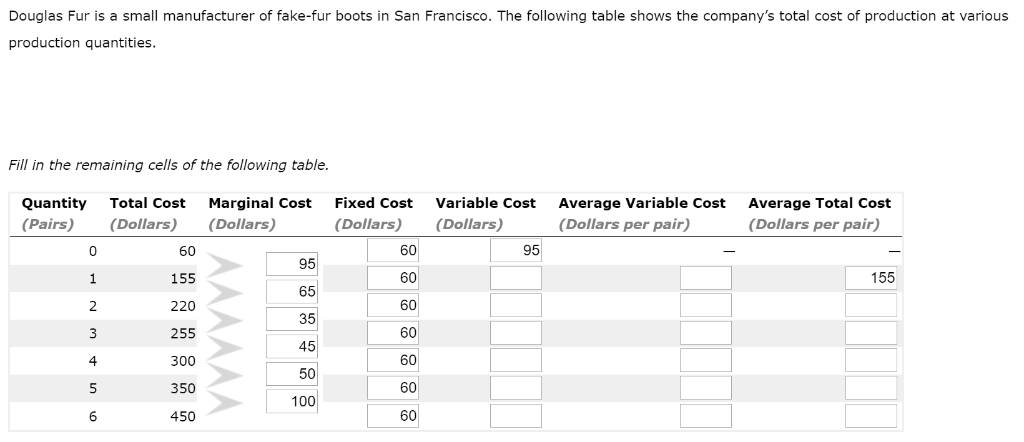
Douglas Fur is a small manufacturer of fake-fur boots in San Francisco. The following table shows...
Fantastic news! We've Found the answer you've been seeking!
Question:
Transcribed Image Text:
Douglas Fur is a small manufacturer of fake-fur boots in San Francisco. The following table shows the company's total cost of production at various production quantities. Fill in the remaining cells of the following table. Total Cost Marginal Cost (Dollars) Quantity Fixed Cost Variable Cost Average Variable Cost Average Total Cost (Pairs) (Dollars) (Dollars) (Dollars) (Dollars per pair) (Dollars per pair) 60 60 95 95 1 155 60 155 65 2 220 60 35 3 255 60 45 4 300 60 50 350 60 100 6 450 60 On the following graph, plot Douglas Fur's average total cost (ATC) curve using the green points (triangle symbol). Next, plot its average variable cost (AVC) curve using the purple points (diamond symbol). Finally, plot its marginal cost (MC) curve using the orange points (square symbol). (Hint: For ATC and AVC, plot the points on the integer; for example, the ATC of producing one pair of boots is $155, so you should start your ATC curve by placing a green point at (1, 155). For MC, plot the points between the integers: For example, the MC of increasing production from zero to one pair of boots is $95, so you should start your MC curve by placing an orange square at (0.5, 95).) Note: Plot your points in the order in which you would like them connected. Line segments will connect the points automatically. 200 175 ATC A 150 125 AVC 100 MC 75 50 25 2 3 5 QUANTITY OF OUTPUT (Pairs of boots) COSTS (Dollars per pair) Douglas Fur is a small manufacturer of fake-fur boots in San Francisco. The following table shows the company's total cost of production at various production quantities. Fill in the remaining cells of the following table. Total Cost Marginal Cost (Dollars) Quantity Fixed Cost Variable Cost Average Variable Cost Average Total Cost (Pairs) (Dollars) (Dollars) (Dollars) (Dollars per pair) (Dollars per pair) 60 60 95 95 1 155 60 155 65 2 220 60 35 3 255 60 45 4 300 60 50 350 60 100 6 450 60 On the following graph, plot Douglas Fur's average total cost (ATC) curve using the green points (triangle symbol). Next, plot its average variable cost (AVC) curve using the purple points (diamond symbol). Finally, plot its marginal cost (MC) curve using the orange points (square symbol). (Hint: For ATC and AVC, plot the points on the integer; for example, the ATC of producing one pair of boots is $155, so you should start your ATC curve by placing a green point at (1, 155). For MC, plot the points between the integers: For example, the MC of increasing production from zero to one pair of boots is $95, so you should start your MC curve by placing an orange square at (0.5, 95).) Note: Plot your points in the order in which you would like them connected. Line segments will connect the points automatically. 200 175 ATC A 150 125 AVC 100 MC 75 50 25 2 3 5 QUANTITY OF OUTPUT (Pairs of boots) COSTS (Dollars per pair)
Expert Answer:
Related Book For
Managerial Decision Modeling with Spreadsheets
ISBN: 978-0136115830
3rd edition
Authors: Nagraj Balakrishnan, Barry Render, Jr. Ralph M. Stair
Posted Date:
Students also viewed these accounting questions
-
The following table shows the UKs Retail Price Index from 1970 to 2009. As you can see, the index was reset to 100 in January 1974, and again in January 1987. What is the annual rate of inflation for...
-
The following table shows key operating statistics for the four largest public accounting firms: a. Determine the revenue per partner and revenue per professional staff for each firm. Round to the...
-
The following table shows the hypothetical labor requirements per ton of wool and per hand-knotted rug, for New Zealand and for India. a. Which country has an absolute advantage in each product? b....
-
In Figure 3-4, the current position of the demand curve is D 1 , and the price of a wireless earbud, which is a normal good, is $3. If there is an increase in consumer incomes, will the demand curve...
-
The Pelican Partnership was formed on August 1 of the current year and admitted Morlan and Merriman as equal partners on that date. The partners both con tributed $300,000 of cash to establish a...
-
Suppose that many stocks are traded in the market and that it is possible to borrow at the risk-free rate, rf. The characteristics of two of the stocks are as follows: Could the equilibrium rf be...
-
A pension fund has just paid some of its liabilities, and as a result of this transaction the fund is no longer fully immunized. The fund manager decides that instead of changing the portfolio, the...
-
Use regression analysis on deseasonalized demand to forecast demand in summer 2013, given the following historical demanddata: YEAR SEASON ACTUAL DEMAND 2011 Spring 205 Summer Winter Summer Winter...
-
Make a swot analysis for In-N-Out using the case blow as reference. What does this analysis tell you? Founded in 1948, In-N-Out was a small but very successful fast-food chain that was primarily...
-
Develop a spreadsheet for computing the demand for any values of the input variables in the linear demand and nonlinear demand prediction models in Examples 1.7 and 1.8 in the chapter.
-
Cash........ Accounts receivable (net) Inventories Prepaid expenses Investments (long-term) Land.... Buildings.. Accumulated depreciation-buildings Machinery and equipment. Comparative Balance Sheet...
-
How does perception influence interpersonal communication?
-
what ways do social theorists grapple with the complexities of power dynamics, including issues of domination, resistance, and hegemony, within various societal frameworks ?
-
Is Positive Psychology used in therapy a better form of therapy then clinical psychology?
-
Negotiation Game for two students Student A You are the CEO of an Accounting company Your employees rely on their computers for work every day. You want to buy 100 new computers for your company but...
-
Activity 2 Directions: Choose a multimedia format to creatively present your experiences in life and tell how you feel about it using the pencil pictures below. Notes to the Teacher If the learner...
-
Ahmad is a developer who aims to design a new sorting algorithm as an alternative variant of the standard Quick Sort, as discussed in his 'algorithms analysis and design' course. This new algorithm...
-
For the next several days, take notes on your listening performance during at least a half-dozen situations in class, during social activities, and at work, if applicable. Referring to the traits of...
-
Would the average output value in a simulation problem change appreciably if a longer period were simulated? Why or why not?
-
Lee Appliances knows that weekly demand for high-end microwaves is normally distributed, with a mean of 25 units and a standard deviation of 7 units. (In your model use integers for all demands.) Lee...
-
Kurts Hardware Store (see Problem 11-37) would like to investigate the effect of adding annual snowfall to the regression model. The table in Problem 11-37 includes the annual snowfall (in inches)...
-
The government regularly publishes many different economic statistics, such as the unemployment rate, the inflation rate, and the surplus or deficit in the federal budget. Study recent newspapers and...
-
Prove that the dual function of Eq. (16.12) is concave Data From Equation (16.12) 19S See https://www.gams.com/ 20 See http://cvxr.com/
-
Consider the quadratic programming problem. min x+x s.t. 1x2 = 4. x1
Study smarter with the SolutionInn App