

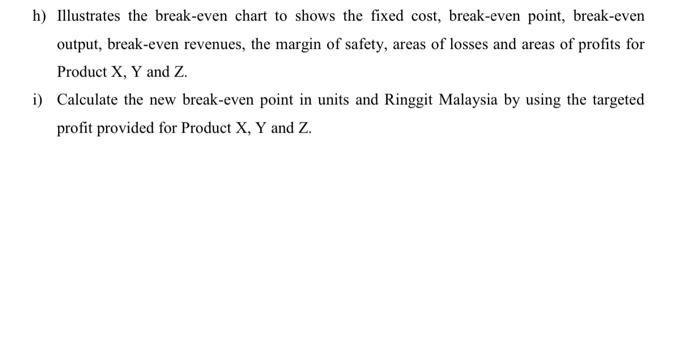
Draw the break-even chart to shows the fixed cost, break-even point, break-even output, break-even revenues, the margin
Fantastic news! We've Found the answer you've been seeking!
Question:
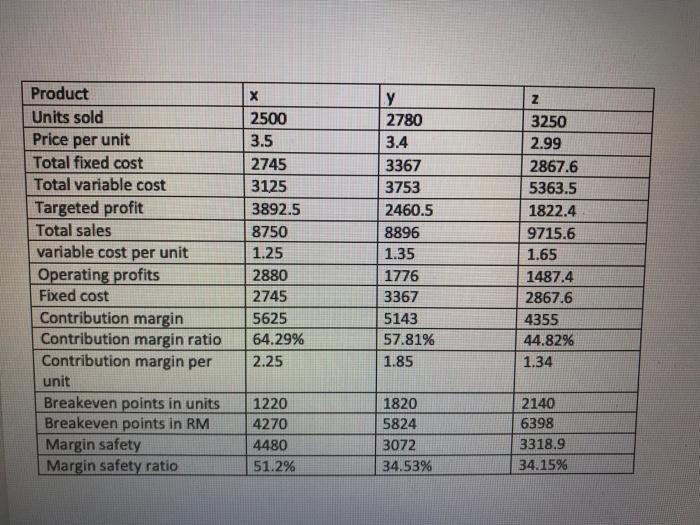
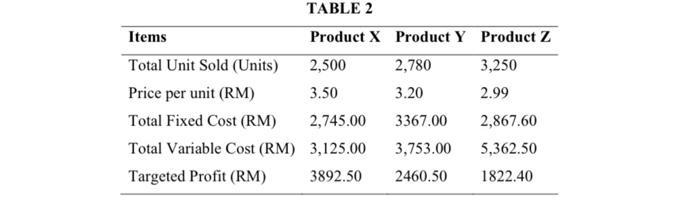
Draw the break-even chart to shows the fixed cost, break-even point, break-even output, break-even revenues, the margin of safety, areas of losses and areas of profits for Product X, Y and Z based in the data below :
Expert Answer:
To illustrate the breakeven chart and calculate the new breakeven point for Product X Y and Z we can use the provided data First lets create the break... View the full answer

Related Book For 

Horngrens Financial and Managerial Accounting
ISBN: 978-0133866292
5th edition
Authors: Tracie L. Nobles, Brenda L. Mattison, Ella Mae Matsumura
Posted Date:
