Answered step by step
Verified Expert Solution
Question
1 Approved Answer
DREW SALES & SERVICE Comparative Income Statement For the Years Ended June 30, 20x2 and 20X1 Revenue Sales Less: Sales Returns and Allowances Net

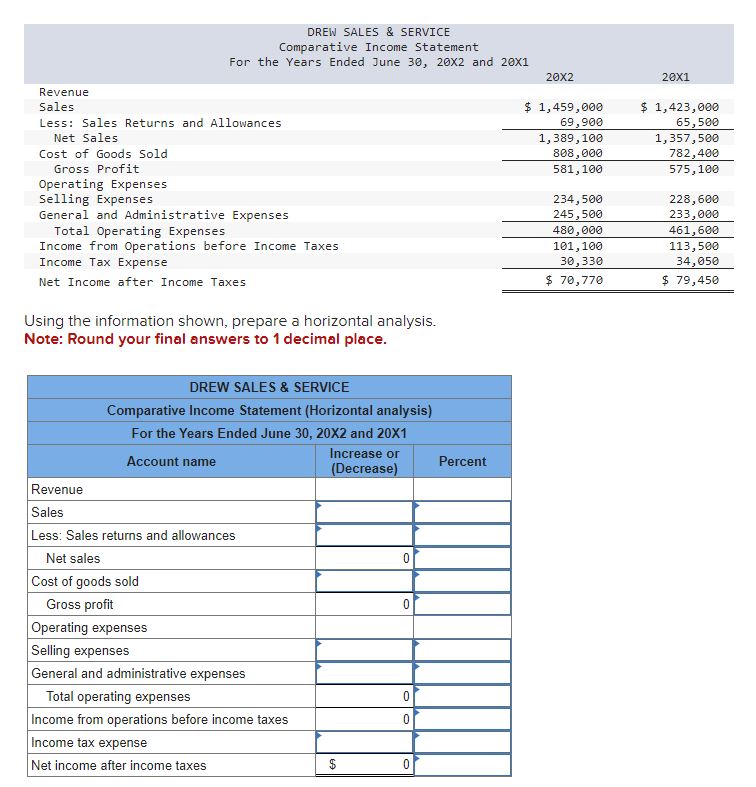
DREW SALES & SERVICE Comparative Income Statement For the Years Ended June 30, 20x2 and 20X1 Revenue Sales Less: Sales Returns and Allowances Net Sales Cost of Goods Sold Gross Profit Operating Expenses Selling Expenses General and Administrative Expenses Total Operating Expenses Income from Operations before Income Taxes Income Tax Expense Net Income after Income Taxes Using the information shown, prepare a horizontal analysis. Note: Round your final answers to 1 decimal place. DREW SALES & SERVICE Comparative Income Statement (Horizontal analysis) For the Years Ended June 30, 20X2 and 20X1 Account name Revenue Sales Less: Sales returns and allowances Net sales Cost of goods sold Gross profit Increase or (Decrease) Percent 0 Operating expenses Selling expenses General and administrative expenses Total operating expenses 0 Income from operations before income taxes 0 Income tax expense Net income after income taxes 0 20X2 20X1 $ 1,459,000 69,900 1,389,100 $ 1,423,000 65,500 1,357,500 808,000 782,400 581,100 575,100 234,500 228,600 245,500 233,000 480,000 461,600 101,100 113,500 30,330 34,050 $ 70,770 $ 79,450
Step by Step Solution
There are 3 Steps involved in it
Step: 1

Get Instant Access to Expert-Tailored Solutions
See step-by-step solutions with expert insights and AI powered tools for academic success
Step: 2

Step: 3

Ace Your Homework with AI
Get the answers you need in no time with our AI-driven, step-by-step assistance
Get Started


